| Param | Original file | Final file |
|---|---|---|
| Filename | modeM0/AS1A04_174T01_9000001876_12676cztM0_level2.evt | modeM0/AS1A04_174T01_9000001876_12676cztM0_level2_quad_clean.evt |
| Size (bytes) | 494,942,400 | 95,270,400 |
| Size | 472.0 MB | 90.9 MB |
| Events in quadrant A | 2,877,868 | 654,834 |
| Events in quadrant B | 5,428,366 | 565,343 |
| Events in quadrant C | 2,862,668 | 644,993 |
| Events in quadrant D | 3,429,471 | 617,263 |
| Mode M9 | |||
|---|---|---|---|
| Quadrant | BADHDUFLAG | Total packets | Discarded packets |
| A | 0 | 10 | 0 |
| B | 0 | 10 | 0 |
| C | 0 | 10 | 0 |
| D | 0 | 10 | 0 |
| Mode M0 | |||
|---|---|---|---|
| Quadrant | BADHDUFLAG | Total packets | Discarded packets |
| A | 0 | 12122 | 2 |
| B | 0 | 19936 | 1 |
| C | 0 | 12207 | 1 |
| D | 0 | 14069 | 1 |
| Mode SS | |||
|---|---|---|---|
| Quadrant | BADHDUFLAG | Total packets | Discarded packets |
| A | 0 | 118 | 0 |
| B | 0 | 118 | 0 |
| C | 0 | 118 | 0 |
| D | 0 | 118 | 0 |
| Quadrant | Total seconds | Saturated seconds | Saturation percentage |
|---|---|---|---|
| A | 5754 | 80 | 1.390337% |
| B | 5754 | 1029 | 17.883212% |
| C | 5754 | 80 | 1.390337% |
| D | 5754 | 180 | 3.128259% |
Noise dominated data is calculated using 1-second bins in cleaned event files. If a bin has >2000 counts, and if more than 50% of those come from <1% of pixels, then it is considered to be noise-dominated and hence unusable.
| Quadrant | # 1 sec bins | Bins with >0 counts | Bins with >2000 counts | High rate bins dominated by noise | Noise dominated (total time) | Noise dominated (detector-on time) | Marked lightcurve |
|---|---|---|---|---|---|---|---|
| A | 6799 | 5753 | 0 | 0 | 0.00% | 0.00% | 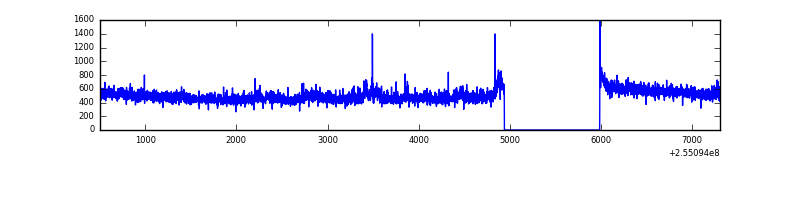 |
| B | 6800 | 5754 | 782 | 782 | 11.50% | 13.59% | 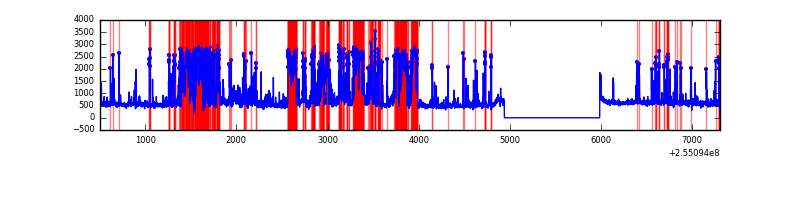 |
| C | 6800 | 5754 | 24 | 24 | 0.35% | 0.42% |  |
| D | 6799 | 5753 | 126 | 126 | 1.85% | 2.19% | 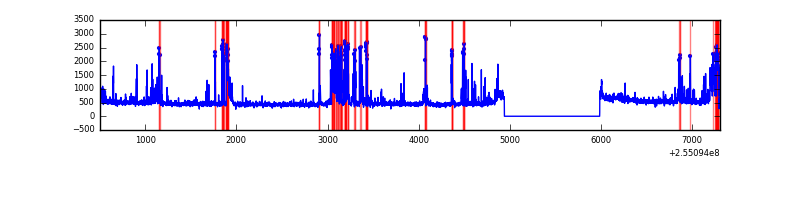 |
Top three noisy pixels from each quadrant. If the there are fewer than three noisy pixels in the level2.evt file, extra rows are filled as -1
| Pixel properties | Quadrant properties | ||||||
|---|---|---|---|---|---|---|---|
| Quadrant | DetID | PixID | Counts | Sigma | Mean | Median | Sigma |
| A | 12 | 189 | 80114 | 533.74 | 724 | 711 | 148.8 |
| A | 0 | 226 | 6442 | 38.52 | 724 | 711 | 148.8 |
| A | 12 | 194 | 5480 | 32.06 | 724 | 711 | 148.8 |
| B | 4 | 239 | 1492724 | 12031.0 | 651 | 639 | 124.0 |
| B | 3 | 64 | 1106193 | 8914.32 | 651 | 639 | 124.0 |
| B | 3 | 209 | 152260 | 1222.55 | 651 | 639 | 124.0 |
| C | 0 | 207 | 144838 | 895.61 | 696 | 702 | 160.9 |
| C | 13 | 61 | 5159 | 27.69 | 696 | 702 | 160.9 |
| C | 8 | 222 | 2574 | 11.63 | 696 | 702 | 160.9 |
| D | 1 | 52 | 592852 | 3567.93 | 692 | 681 | 166.0 |
| D | 10 | 199 | 127070 | 761.51 | 692 | 681 | 166.0 |
| D | 10 | 157 | 27362 | 160.76 | 692 | 681 | 166.0 |
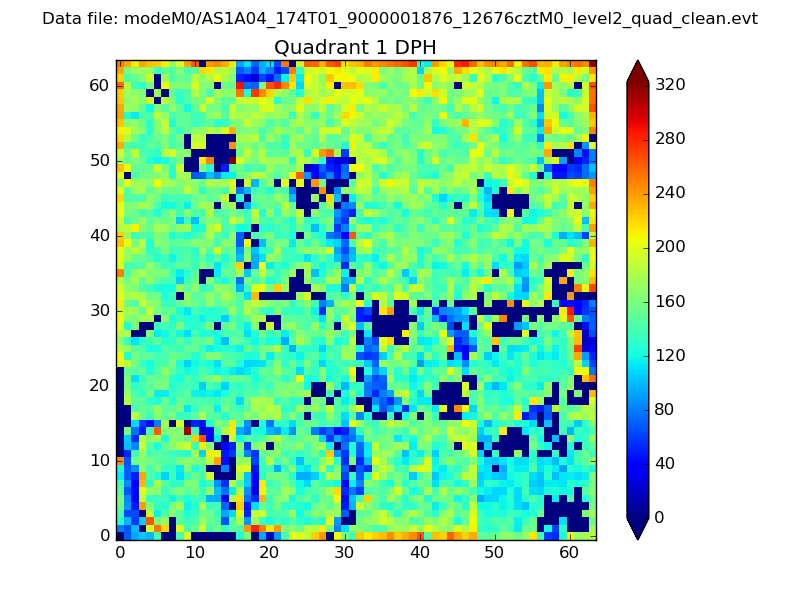
Histogram calculated using DETX and DETY for each event in the final _common_clean file
| Quadrant A | 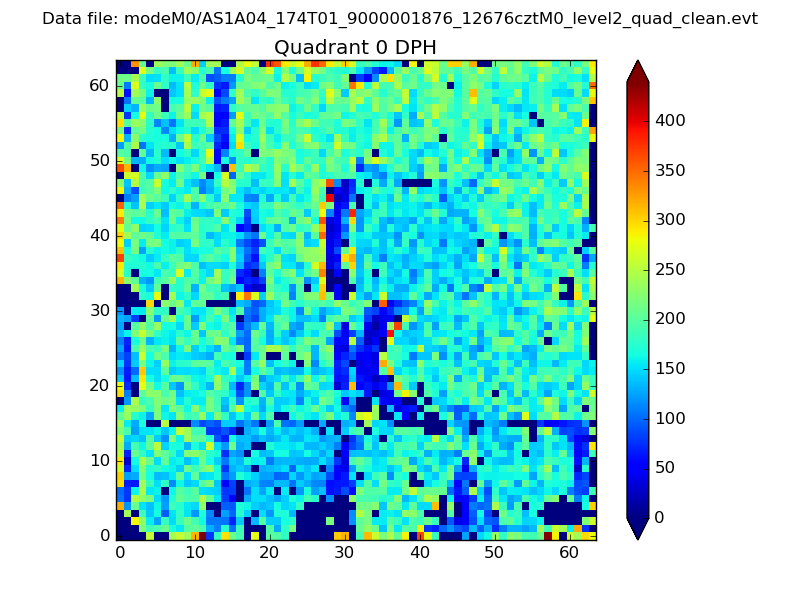 |
 |
Quadrant B |
|---|---|---|---|
| Quadrant D |  |
 |
Quadrant C |
| Plot type | Count rate plots | Images |
|---|---|---|
| Comparison with Poisson distribution Blue bars denote a histogram of data divided into 1 sec bins. Red curve is a Poisson curve with rate = median count rate of data. |
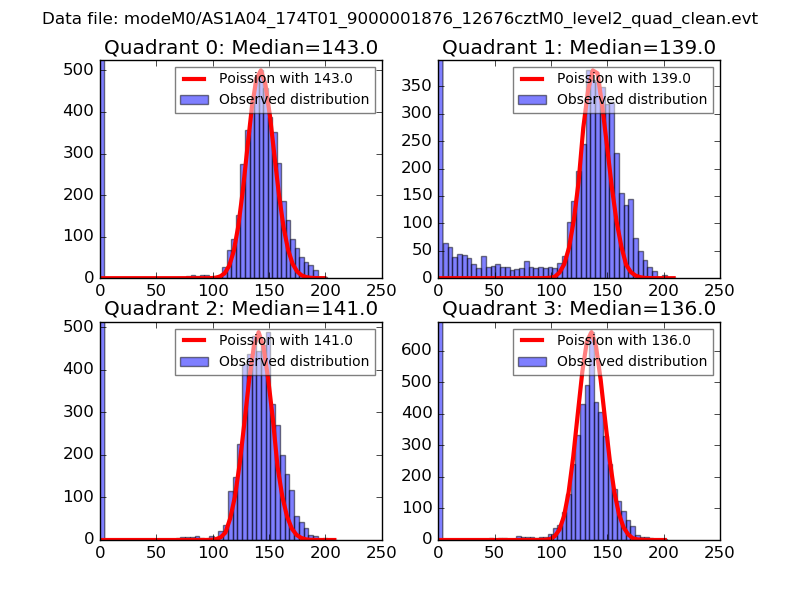 |
 |
| Quadrant-wise count rates Data is divided into 100 sec bins |
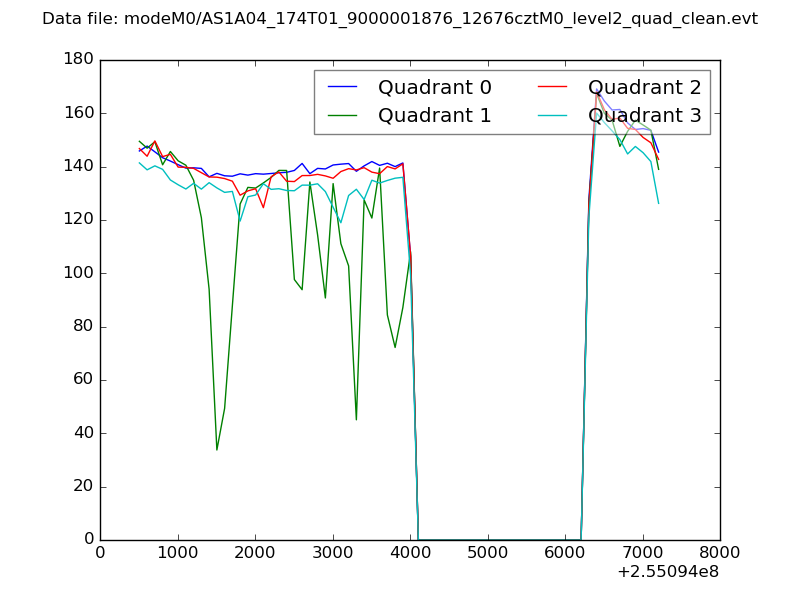 |
|
| Module-wise count rates for Quadrant A Data is divided into 100 sec bins |
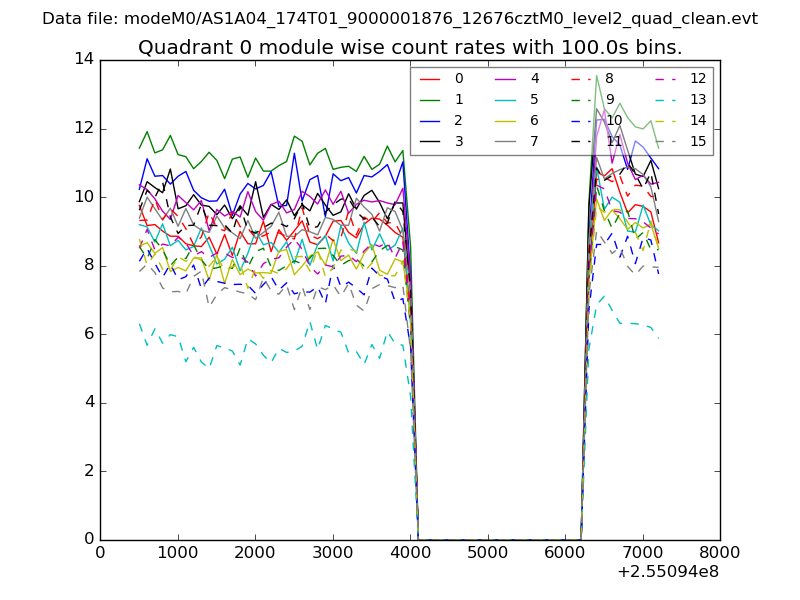 |
 |
| Module-wise count rates for Quadrant B Data is divided into 100 sec bins |
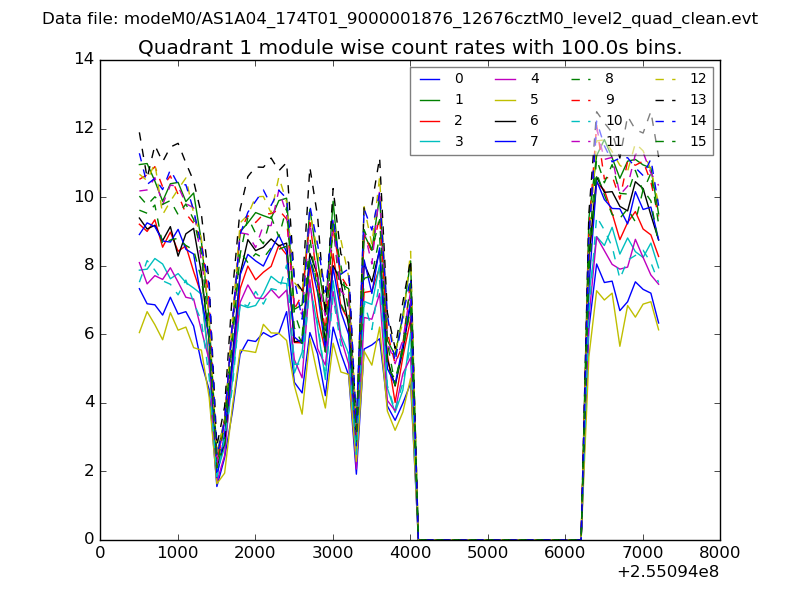 |
 |
| Module-wise count rates for Quadrant C Data is divided into 100 sec bins |
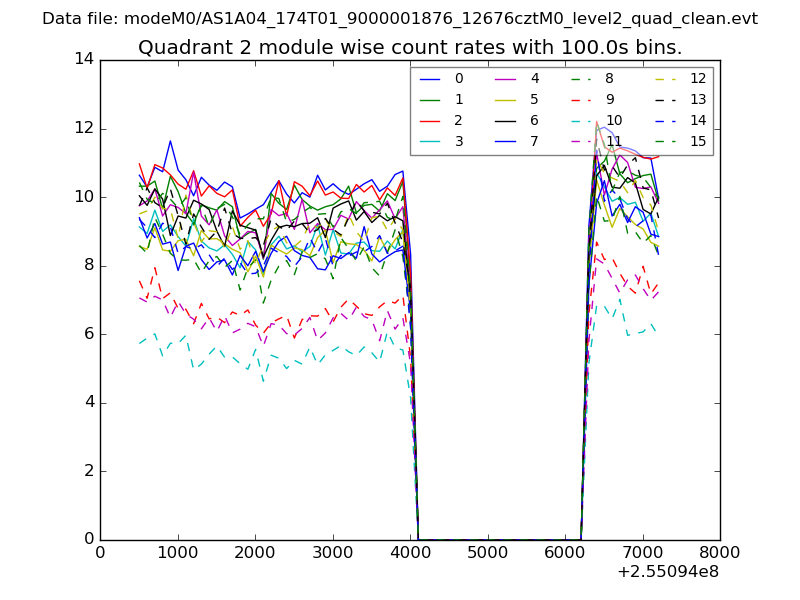 |
 |
| Module-wise count rates for Quadrant D Data is divided into 100 sec bins |
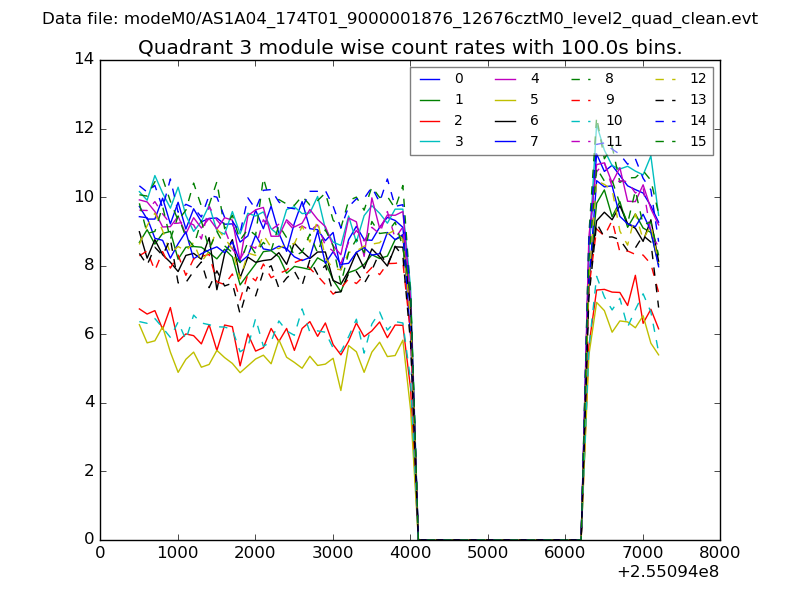 |
 |
| Parameter | Plot |
|---|---|
| CZT HV Monitor | 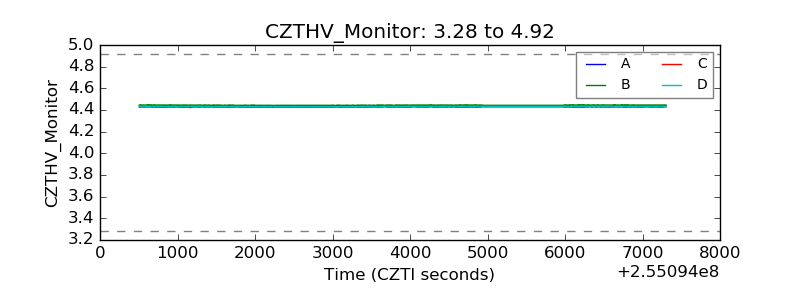 |
| D_VDD | 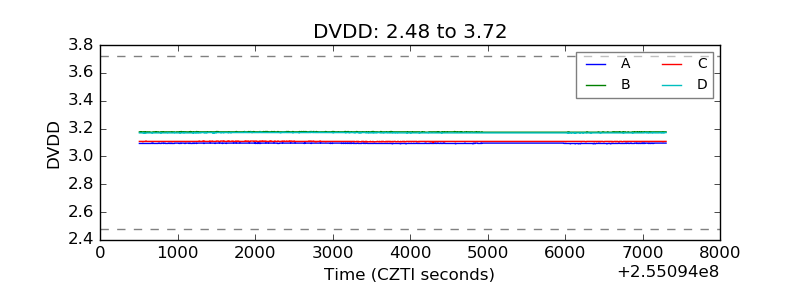 |
| Temperature 1 | 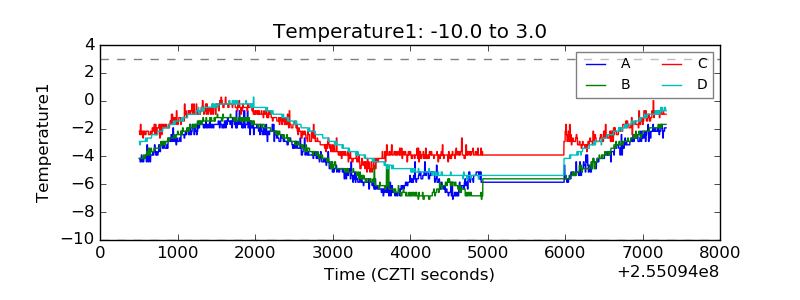 |
| Veto HV Monitor | 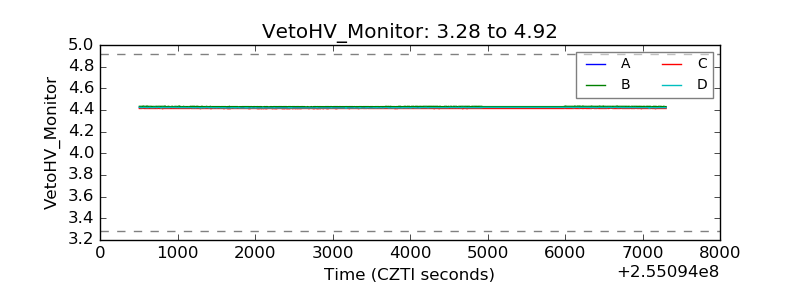 |
| Veto LLD | 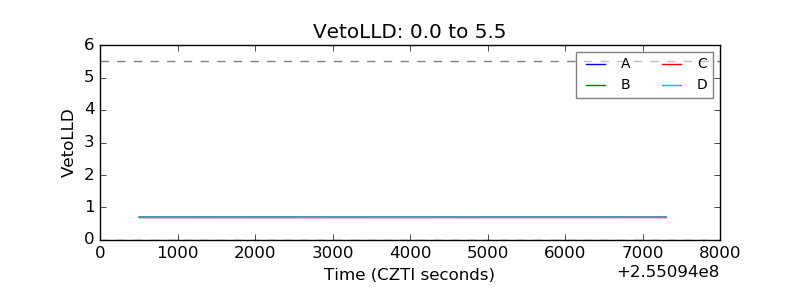 |
| Alpha Counter | 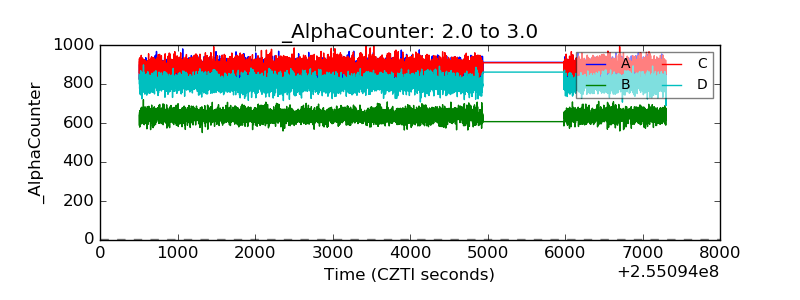 |
| _CPM_Rate | 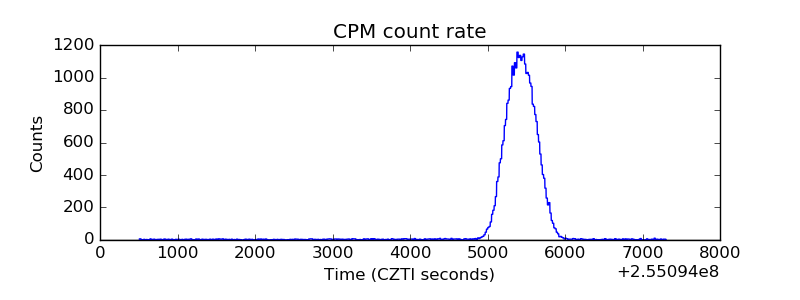 |
| CZT Counter | 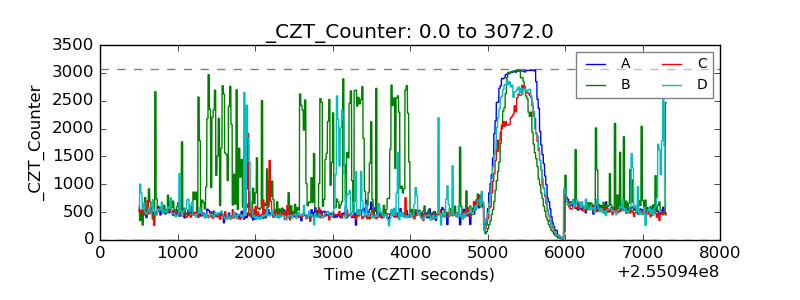 |
| +2.5 Volts monitor |  |
| +5 Volts monitor |  |
| _ROLL_ROT | 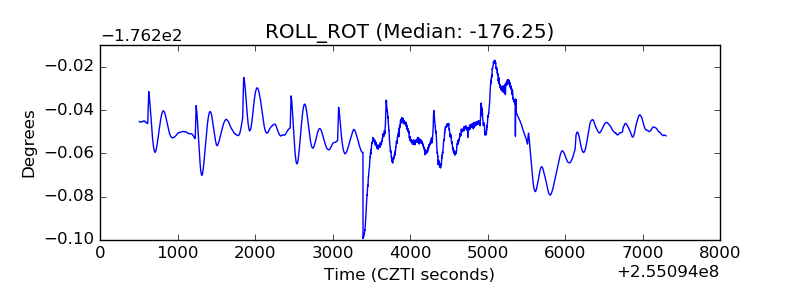 |
| _Roll_DEC | 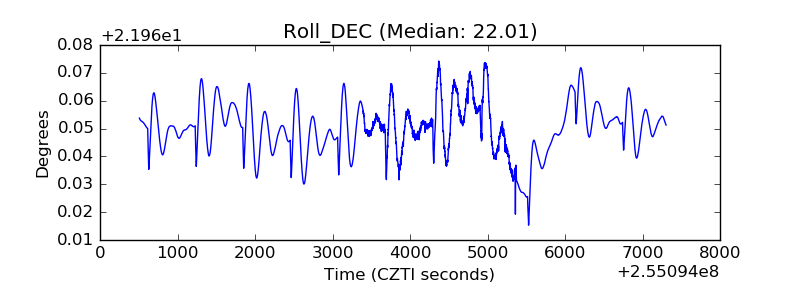 |
| _Roll_RA | 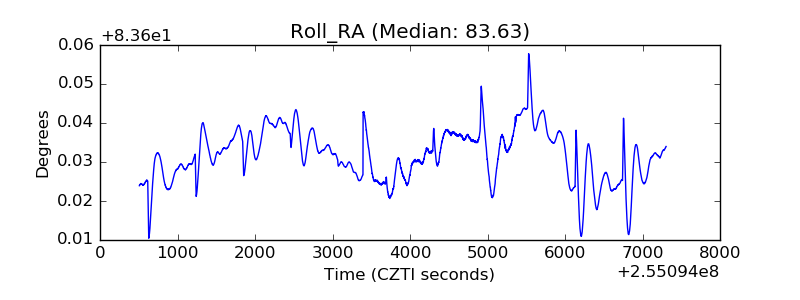 |
| Veto Counter | 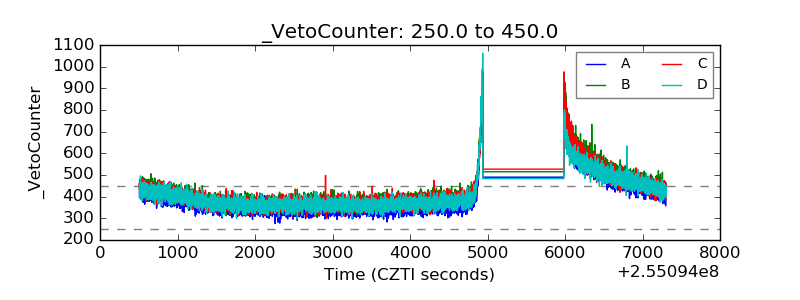 |