| Param | Original file | Final file |
|---|---|---|
| Filename | modeM0/AS1A04_174T01_9000001876_12677cztM0_level2.evt | modeM0/AS1A04_174T01_9000001876_12677cztM0_level2_quad_clean.evt |
| Size (bytes) | 521,144,640 | 102,551,040 |
| Size | 497.0 MB | 97.8 MB |
| Events in quadrant A | 2,921,156 | 713,707 |
| Events in quadrant B | 5,481,759 | 627,637 |
| Events in quadrant C | 2,785,663 | 699,352 |
| Events in quadrant D | 4,201,569 | 660,122 |
| Mode M9 | |||
|---|---|---|---|
| Quadrant | BADHDUFLAG | Total packets | Discarded packets |
| A | 0 | 12 | 0 |
| B | 0 | 12 | 0 |
| C | 0 | 12 | 0 |
| D | 0 | 12 | 0 |
| Mode M0 | |||
|---|---|---|---|
| Quadrant | BADHDUFLAG | Total packets | Discarded packets |
| A | 0 | 12332 | 2 |
| B | 0 | 20193 | 1 |
| C | 0 | 12022 | 1 |
| D | 0 | 16328 | 1 |
| Mode SS | |||
|---|---|---|---|
| Quadrant | BADHDUFLAG | Total packets | Discarded packets |
| A | 0 | 116 | 0 |
| B | 0 | 116 | 0 |
| C | 0 | 116 | 0 |
| D | 0 | 116 | 0 |
| Quadrant | Total seconds | Saturated seconds | Saturation percentage |
|---|---|---|---|
| A | 5795 | 72 | 1.242450% |
| B | 5795 | 1019 | 17.584124% |
| C | 5795 | 47 | 0.811044% |
| D | 5795 | 325 | 5.608283% |
Noise dominated data is calculated using 1-second bins in cleaned event files. If a bin has >2000 counts, and if more than 50% of those come from <1% of pixels, then it is considered to be noise-dominated and hence unusable.
| Quadrant | # 1 sec bins | Bins with >0 counts | Bins with >2000 counts | High rate bins dominated by noise | Noise dominated (total time) | Noise dominated (detector-on time) | Marked lightcurve |
|---|---|---|---|---|---|---|---|
| A | 6950 | 5795 | 0 | 0 | 0.00% | 0.00% | 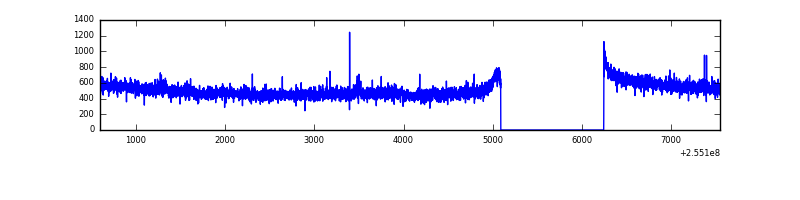 |
| B | 6950 | 5795 | 796 | 796 | 11.45% | 13.74% | 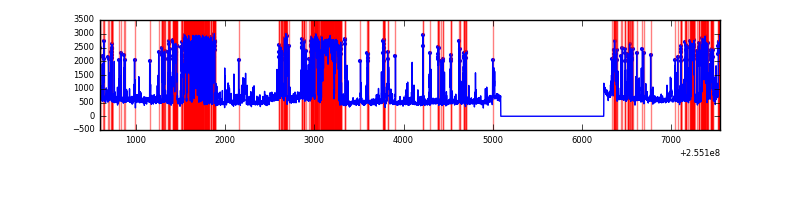 |
| C | 6950 | 5795 | 0 | 0 | 0.00% | 0.00% | 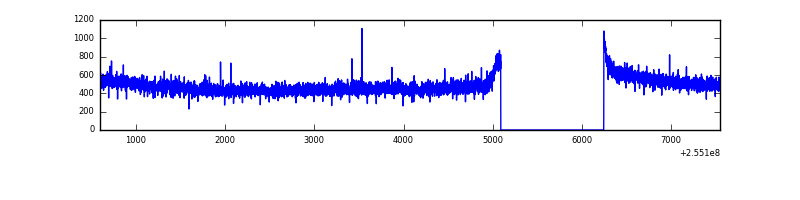 |
| D | 6951 | 5796 | 335 | 335 | 4.82% | 5.78% | 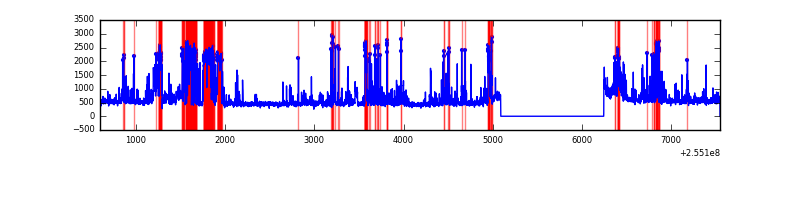 |
Top three noisy pixels from each quadrant. If the there are fewer than three noisy pixels in the level2.evt file, extra rows are filled as -1
| Pixel properties | Quadrant properties | ||||||
|---|---|---|---|---|---|---|---|
| Quadrant | DetID | PixID | Counts | Sigma | Mean | Median | Sigma |
| A | 12 | 189 | 34497 | 220.73 | 747 | 734 | 153.0 |
| A | 8 | 15 | 9108 | 54.75 | 747 | 734 | 153.0 |
| A | 0 | 226 | 6866 | 40.09 | 747 | 734 | 153.0 |
| B | 4 | 239 | 2384624 | 18589.05 | 674 | 659 | 128.2 |
| B | 3 | 209 | 212779 | 1654.01 | 674 | 659 | 128.2 |
| B | 3 | 64 | 100695 | 780.03 | 674 | 659 | 128.2 |
| C | 13 | 61 | 5163 | 26.92 | 714 | 721 | 165.0 |
| C | 14 | 234 | 2729 | 12.17 | 714 | 721 | 165.0 |
| C | 3 | 202 | 1822 | 6.67 | 714 | 721 | 165.0 |
| D | 1 | 52 | 1263687 | 7486.54 | 708 | 692 | 168.7 |
| D | 10 | 199 | 198576 | 1172.98 | 708 | 692 | 168.7 |
| D | 2 | 234 | 21498 | 123.33 | 708 | 692 | 168.7 |
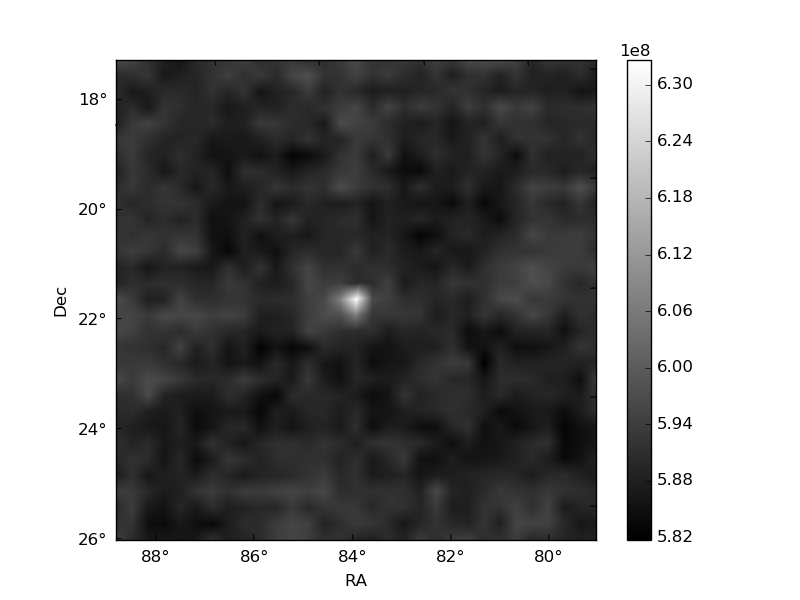
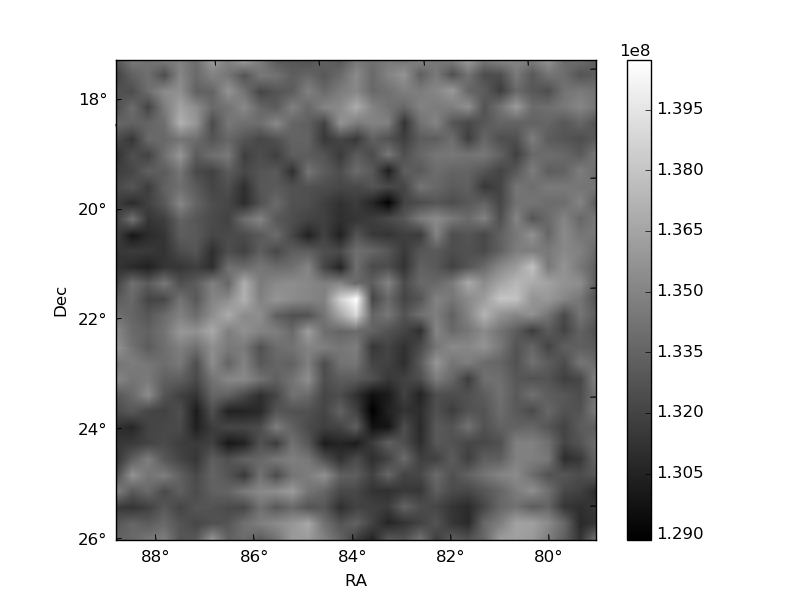
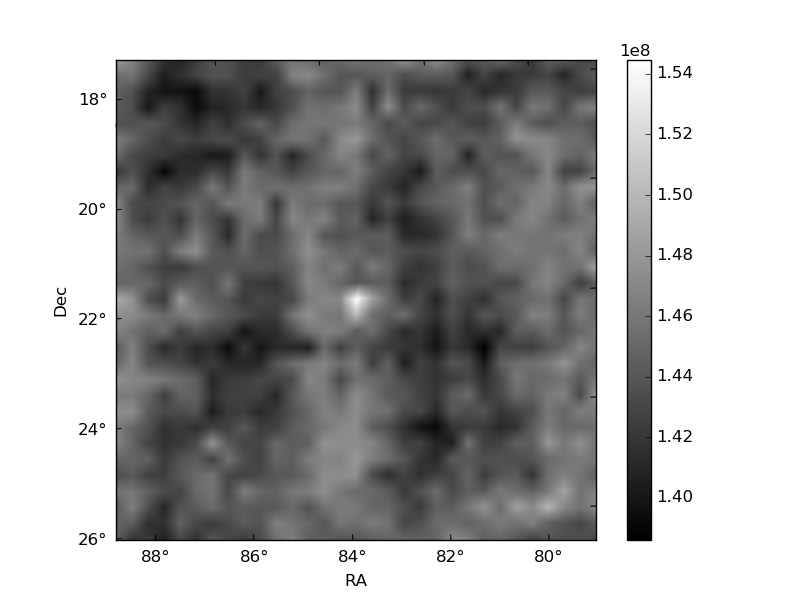
Histogram calculated using DETX and DETY for each event in the final _common_clean file
| Quadrant A | 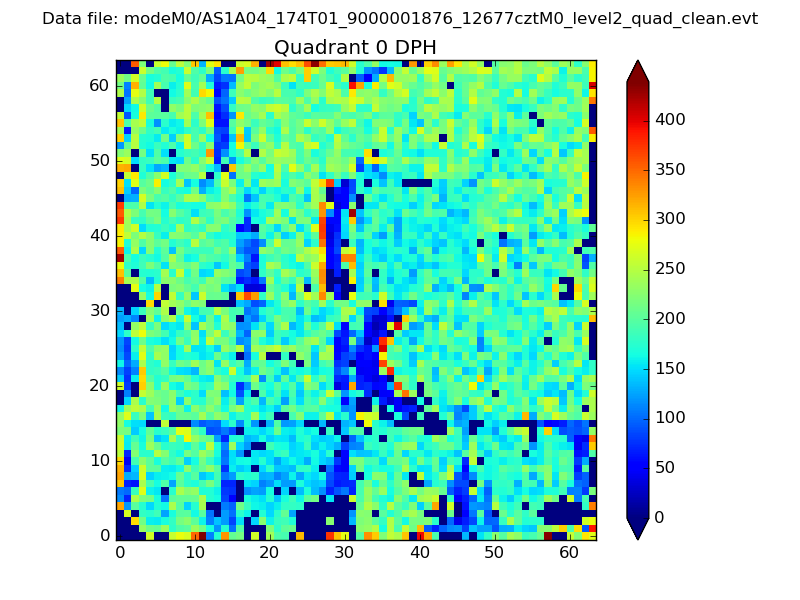 |
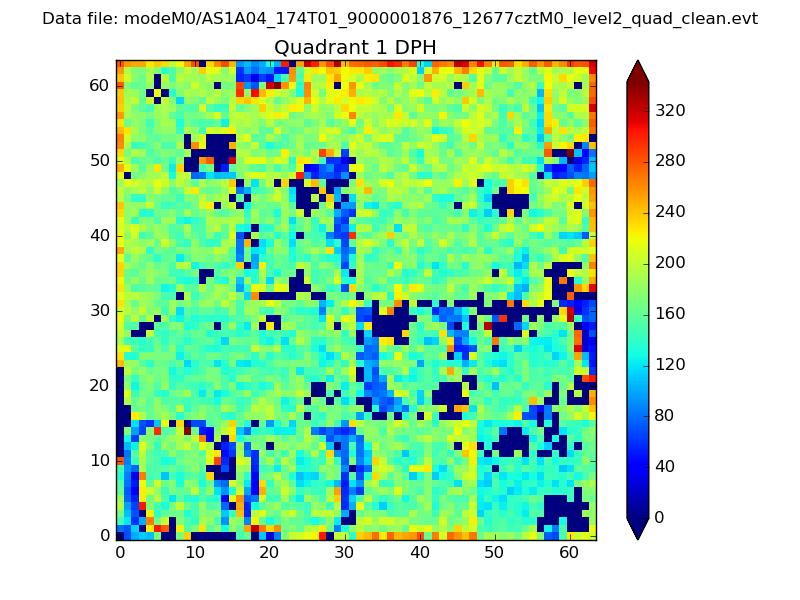 |
Quadrant B |
|---|---|---|---|
| Quadrant D | 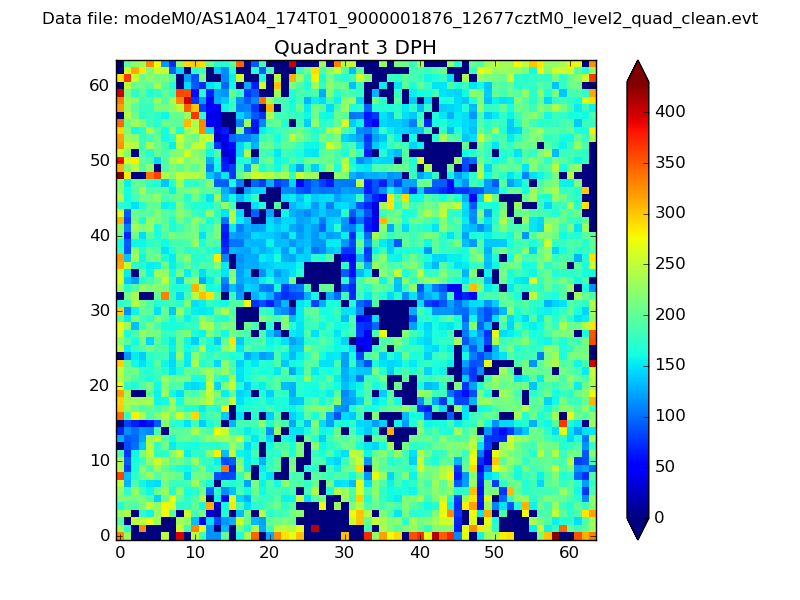 |
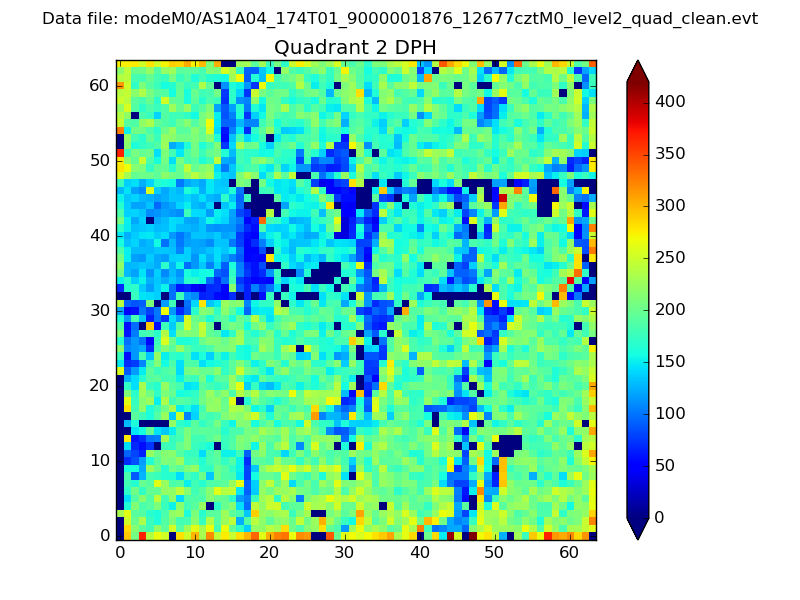 |
Quadrant C |
| Plot type | Count rate plots | Images |
|---|---|---|
| Comparison with Poisson distribution Blue bars denote a histogram of data divided into 1 sec bins. Red curve is a Poisson curve with rate = median count rate of data. |
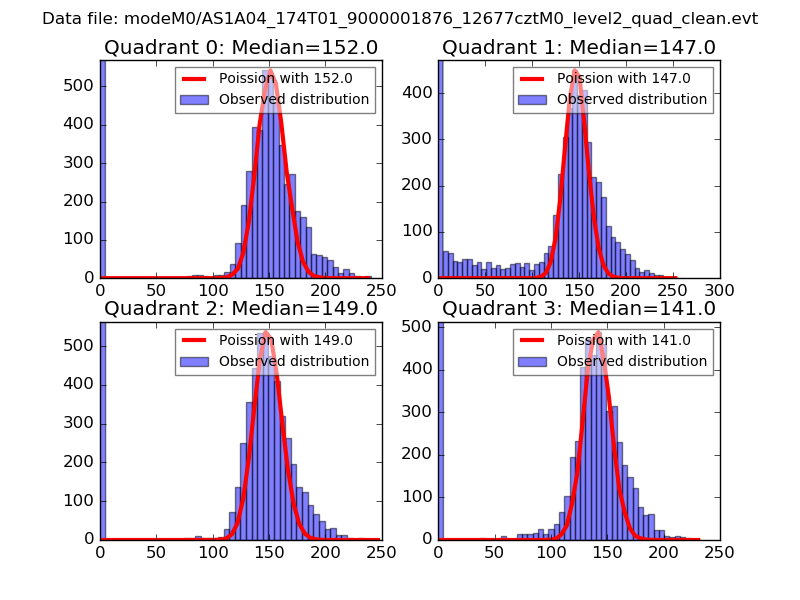 |
 |
| Quadrant-wise count rates Data is divided into 100 sec bins |
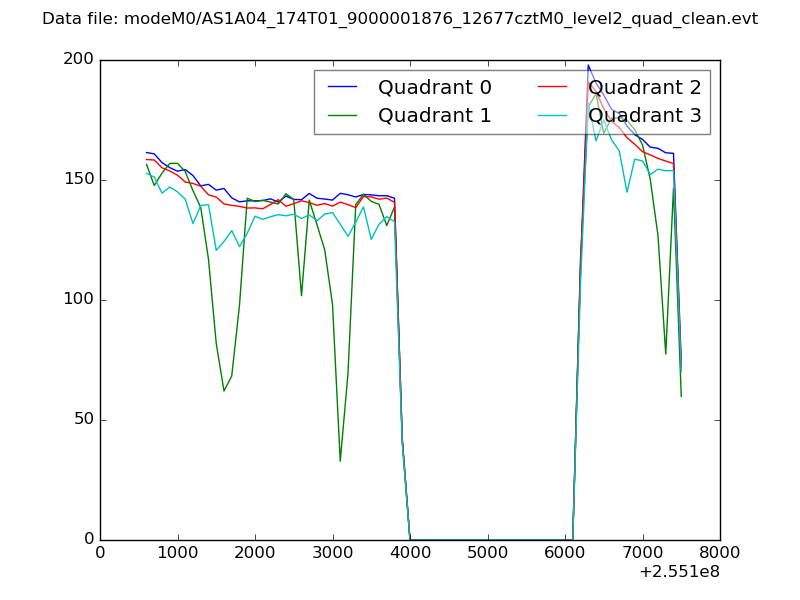 |
|
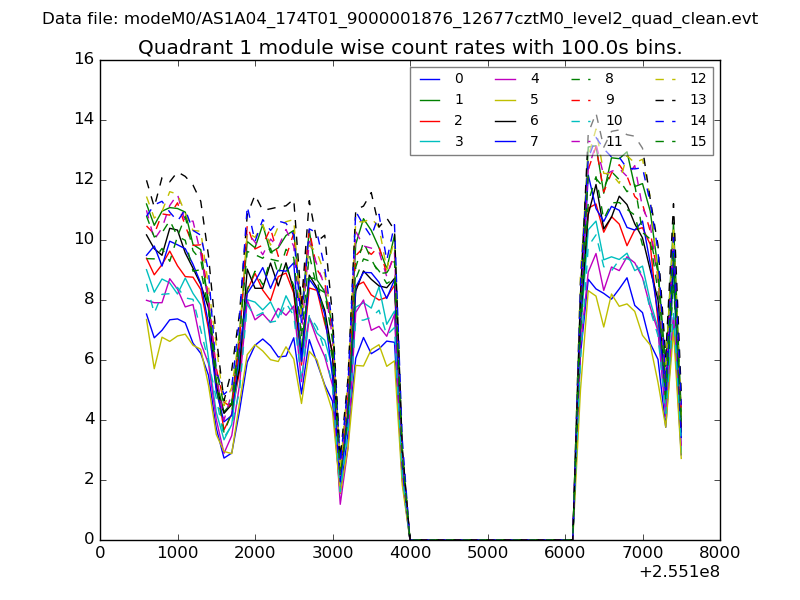
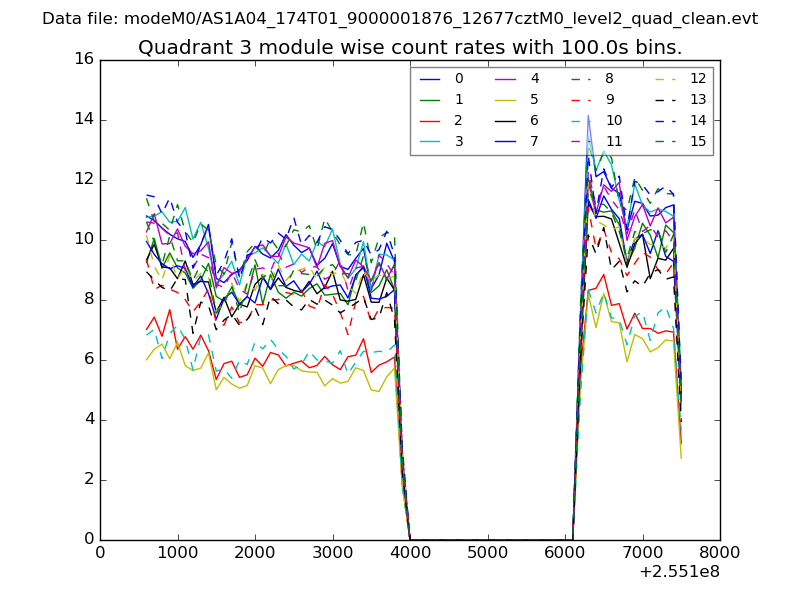
| Module-wise count rates for Quadrant A Data is divided into 100 sec bins |
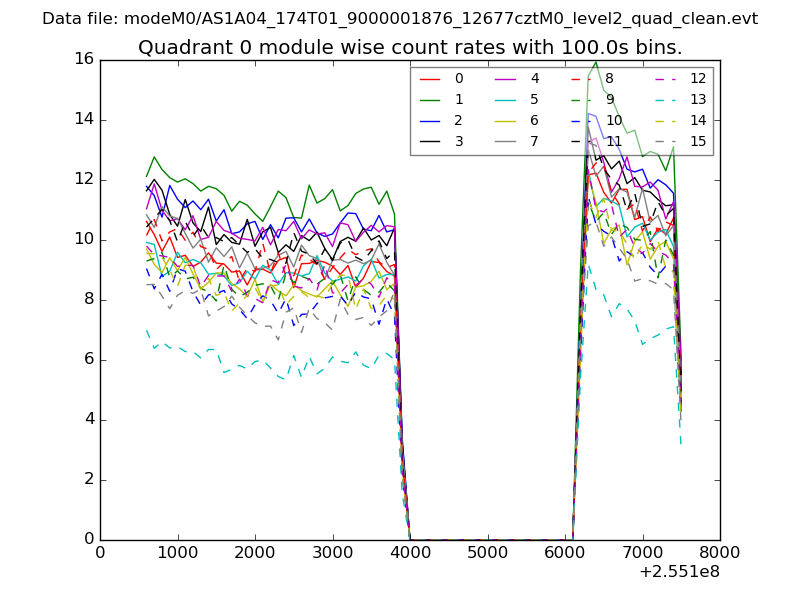 |
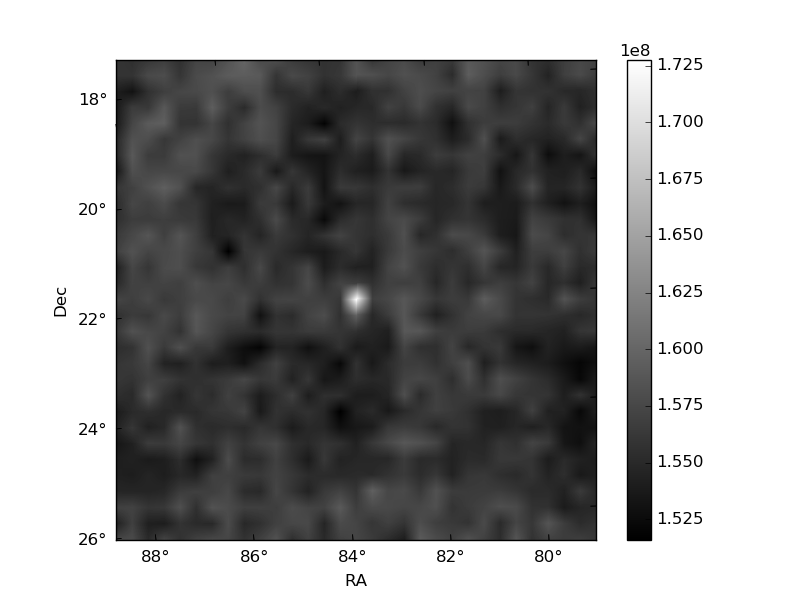 |
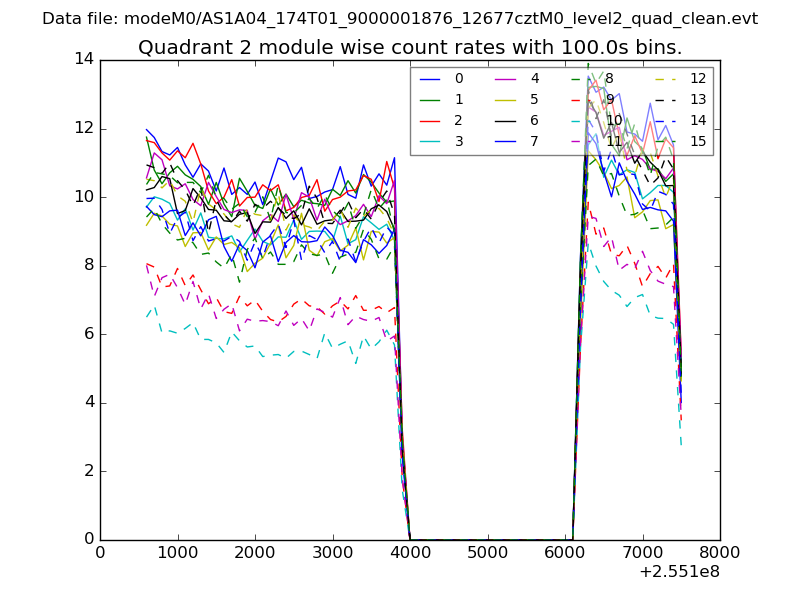
| Module-wise count rates for Quadrant B Data is divided into 100 sec bins |
 |
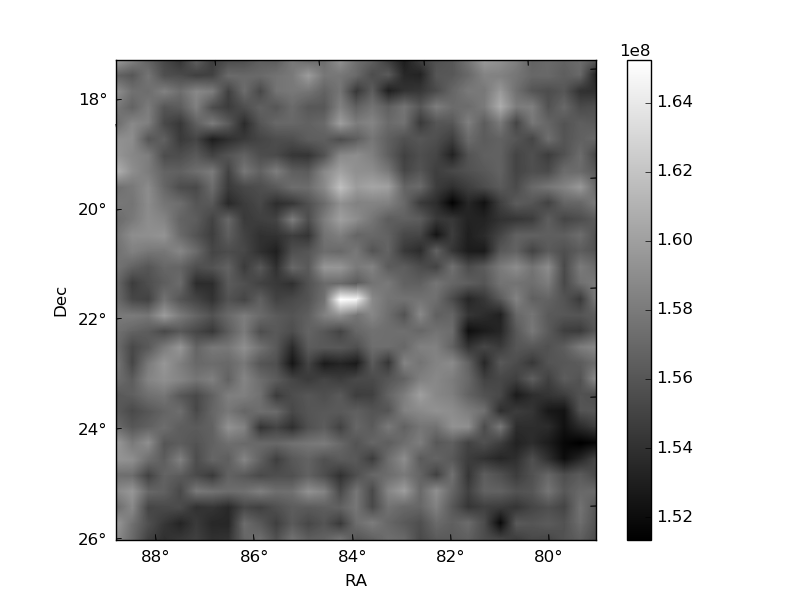 |
| Module-wise count rates for Quadrant C Data is divided into 100 sec bins |
 |
 |
| Module-wise count rates for Quadrant D Data is divided into 100 sec bins |
 |
 |
| Parameter | Plot |
|---|---|
| CZT HV Monitor | 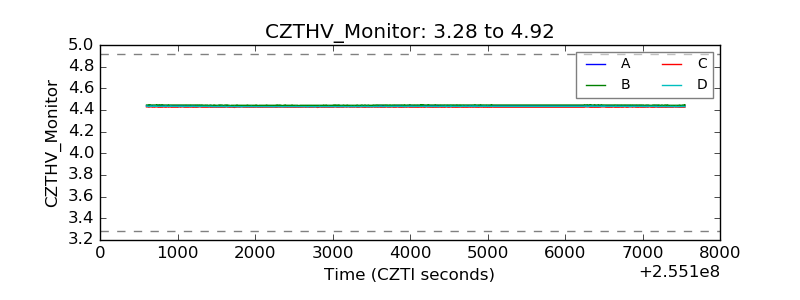 |
| D_VDD | 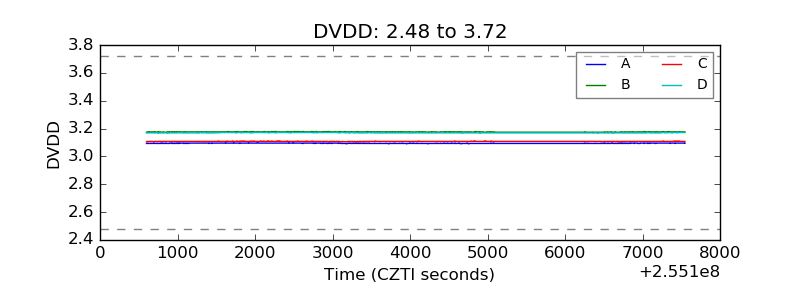 |
| Temperature 1 | 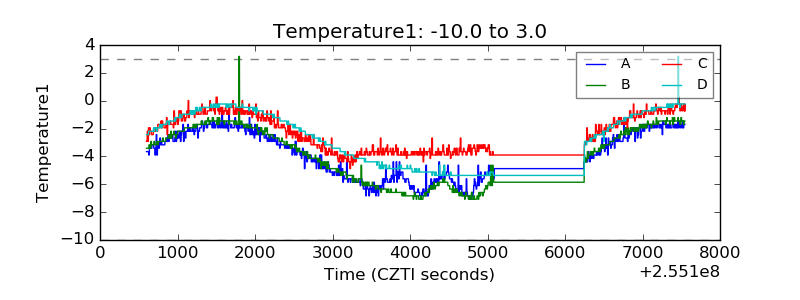 |
| Veto HV Monitor | 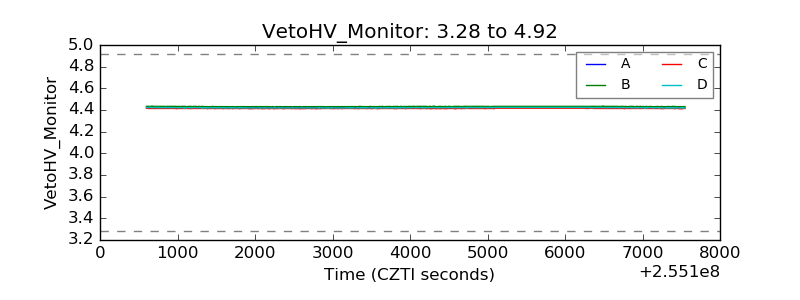 |
| Veto LLD | 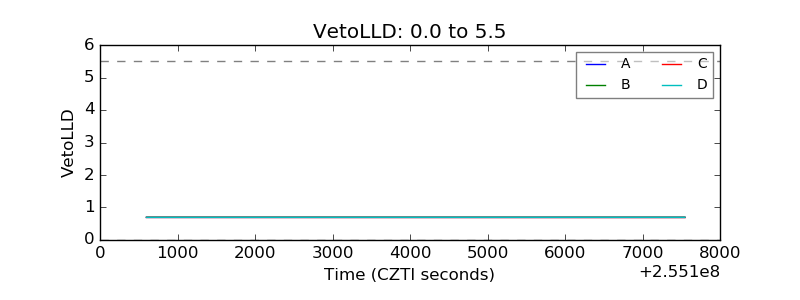 |
| Alpha Counter | 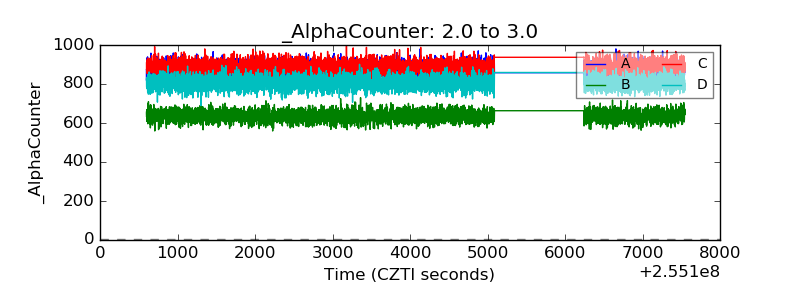 |
| _CPM_Rate | 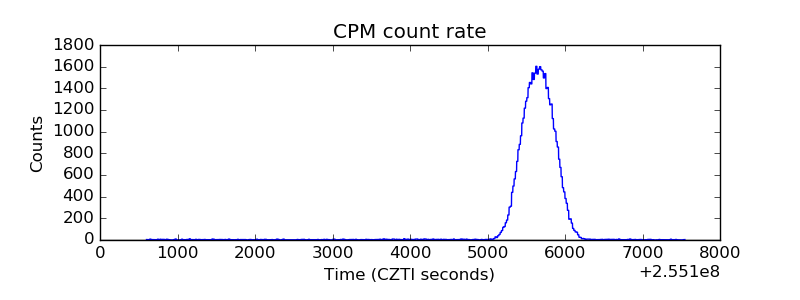 |
| CZT Counter | 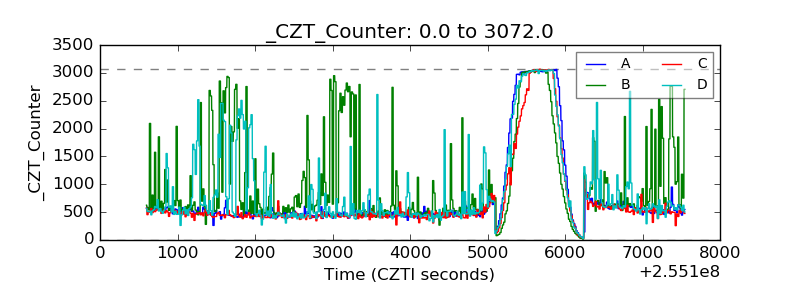 |
| +2.5 Volts monitor |  |
| +5 Volts monitor |  |
| _ROLL_ROT | 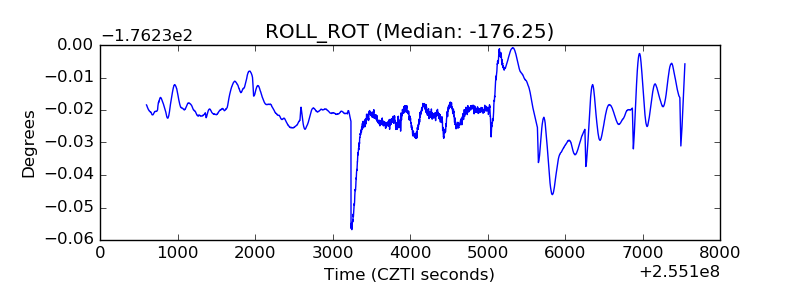 |
| _Roll_DEC | 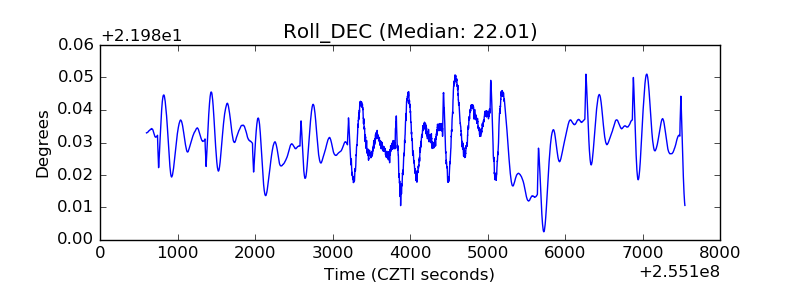 |
| _Roll_RA | 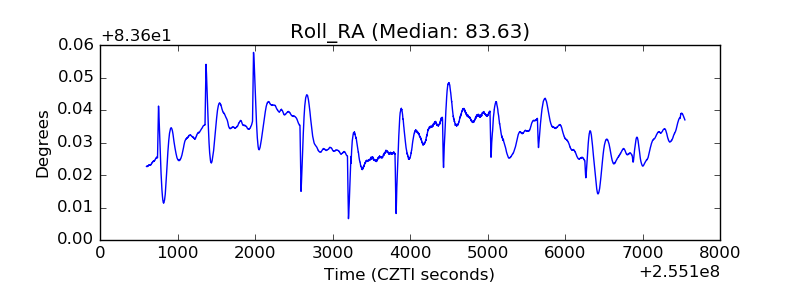 |
| Veto Counter | 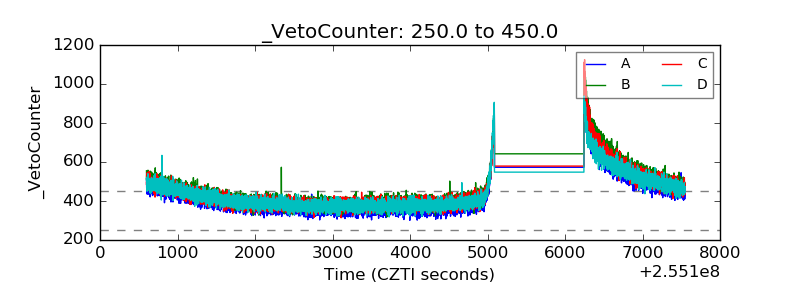 |