| Param | Original file | Final file |
|---|---|---|
| Filename | modeM0/AS1A04_174T01_9000001876_12679cztM0_level2.evt | modeM0/AS1A04_174T01_9000001876_12679cztM0_level2_quad_clean.evt |
| Size (bytes) | 486,766,080 | 92,661,120 |
| Size | 464.2 MB | 88.4 MB |
| Events in quadrant A | 2,920,699 | 634,749 |
| Events in quadrant B | 5,370,318 | 552,444 |
| Events in quadrant C | 2,871,276 | 618,521 |
| Events in quadrant D | 3,184,036 | 593,094 |
| Mode M9 | |||
|---|---|---|---|
| Quadrant | BADHDUFLAG | Total packets | Discarded packets |
| A | 0 | 13 | 0 |
| B | 0 | 13 | 0 |
| C | 0 | 13 | 0 |
| D | 0 | 13 | 0 |
| Mode M0 | |||
|---|---|---|---|
| Quadrant | BADHDUFLAG | Total packets | Discarded packets |
| A | 0 | 12247 | 2 |
| B | 0 | 19764 | 1 |
| C | 0 | 12129 | 1 |
| D | 0 | 13176 | 1 |
| Mode SS | |||
|---|---|---|---|
| Quadrant | BADHDUFLAG | Total packets | Discarded packets |
| A | 0 | 118 | 0 |
| B | 0 | 118 | 0 |
| C | 0 | 118 | 0 |
| D | 0 | 118 | 0 |
| Quadrant | Total seconds | Saturated seconds | Saturation percentage |
|---|---|---|---|
| A | 5825 | 62 | 1.064378% |
| B | 5825 | 934 | 16.034335% |
| C | 5825 | 46 | 0.789700% |
| D | 5825 | 111 | 1.905579% |
Noise dominated data is calculated using 1-second bins in cleaned event files. If a bin has >2000 counts, and if more than 50% of those come from <1% of pixels, then it is considered to be noise-dominated and hence unusable.
| Quadrant | # 1 sec bins | Bins with >0 counts | Bins with >2000 counts | High rate bins dominated by noise | Noise dominated (total time) | Noise dominated (detector-on time) | Marked lightcurve |
|---|---|---|---|---|---|---|---|
| A | 7135 | 5825 | 0 | 0 | 0.00% | 0.00% | 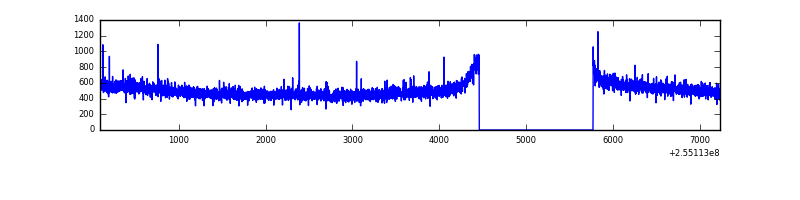 |
| B | 7135 | 5825 | 740 | 740 | 10.37% | 12.70% | 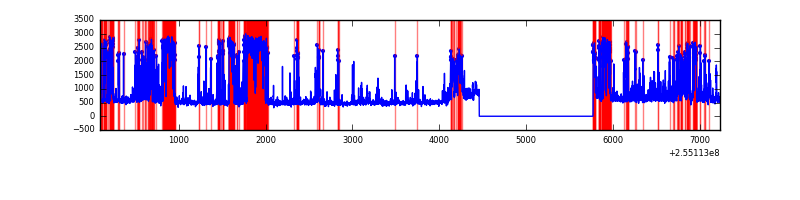 |
| C | 7135 | 5825 | 4 | 4 | 0.06% | 0.07% | 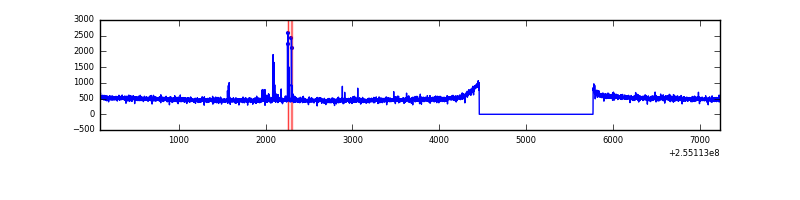 |
| D | 7135 | 5825 | 45 | 45 | 0.63% | 0.77% | 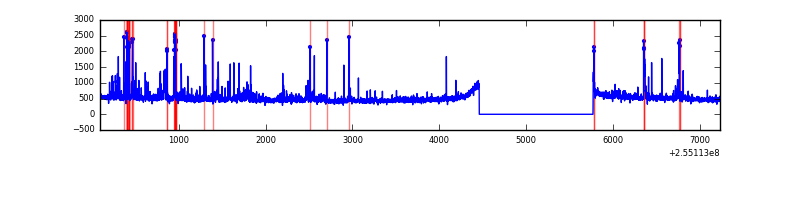 |
Top three noisy pixels from each quadrant. If the there are fewer than three noisy pixels in the level2.evt file, extra rows are filled as -1
| Pixel properties | Quadrant properties | ||||||
|---|---|---|---|---|---|---|---|
| Quadrant | DetID | PixID | Counts | Sigma | Mean | Median | Sigma |
| A | 12 | 189 | 10721 | 64.71 | 754 | 740 | 154.2 |
| A | 0 | 226 | 6945 | 40.23 | 754 | 740 | 154.2 |
| A | 8 | 15 | 6042 | 34.38 | 754 | 740 | 154.2 |
| B | 4 | 239 | 1782603 | 13836.22 | 687 | 673 | 128.8 |
| B | 3 | 64 | 748898 | 5809.77 | 687 | 673 | 128.8 |
| B | 11 | 51 | 57175 | 438.72 | 687 | 673 | 128.8 |
| C | 15 | 208 | 39239 | 231.79 | 724 | 731 | 166.1 |
| C | 13 | 61 | 5265 | 27.29 | 724 | 731 | 166.1 |
| C | 9 | 221 | 5136 | 26.52 | 724 | 731 | 166.1 |
| D | 1 | 52 | 279704 | 1612.57 | 722 | 708 | 173.0 |
| D | 10 | 253 | 60471 | 345.43 | 722 | 708 | 173.0 |
| D | 13 | 61 | 28051 | 158.04 | 722 | 708 | 173.0 |
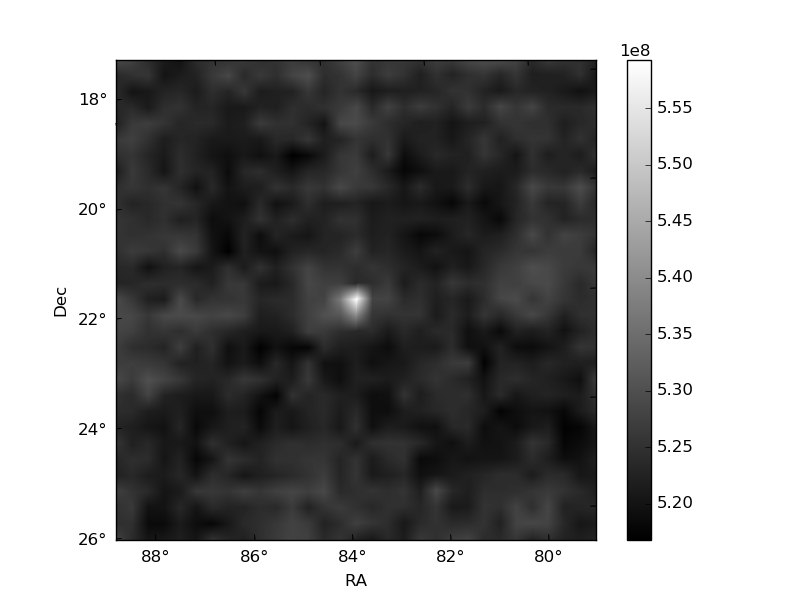
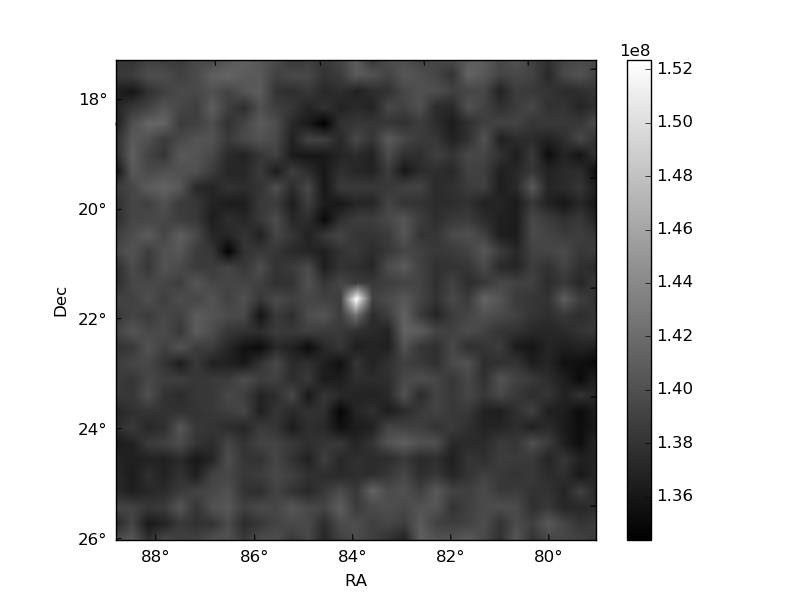
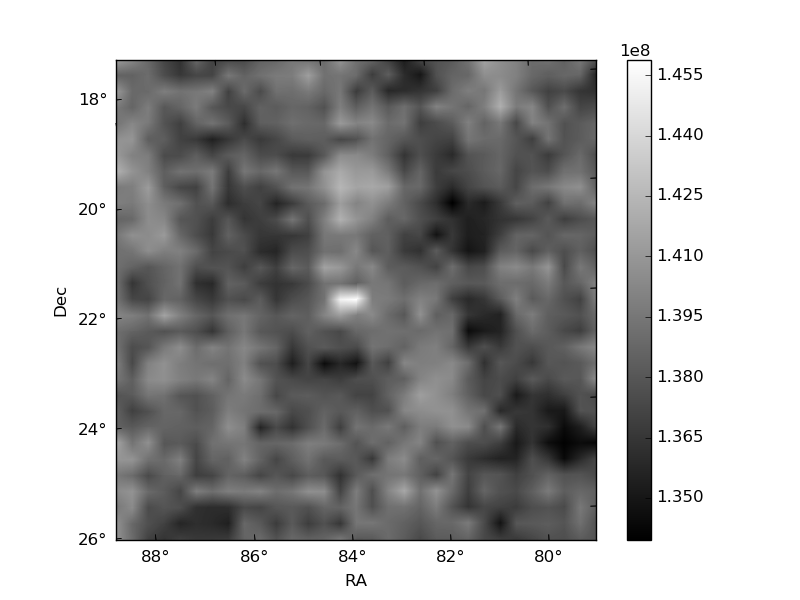
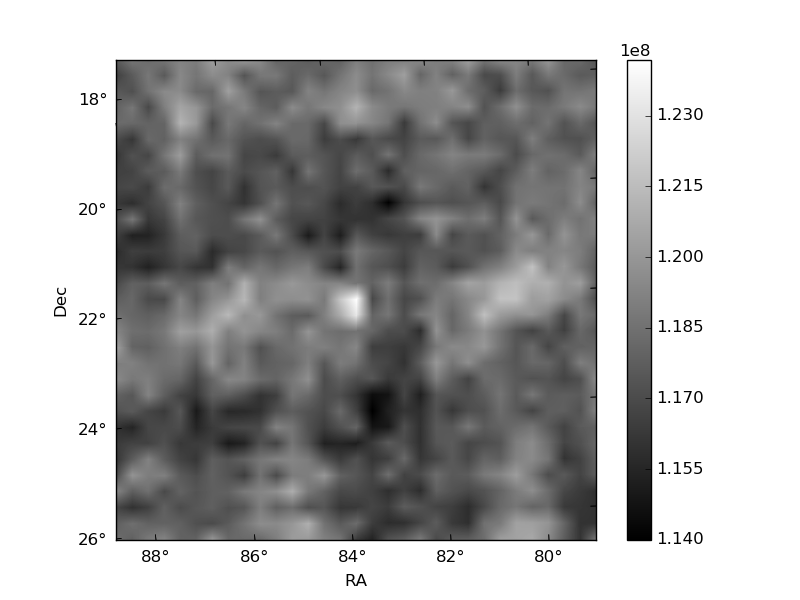
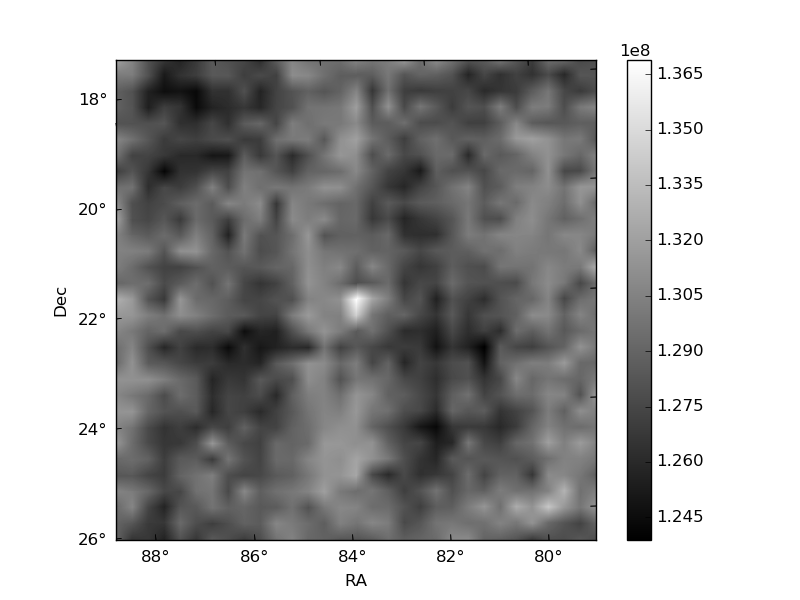
Histogram calculated using DETX and DETY for each event in the final _common_clean file
| Quadrant A | 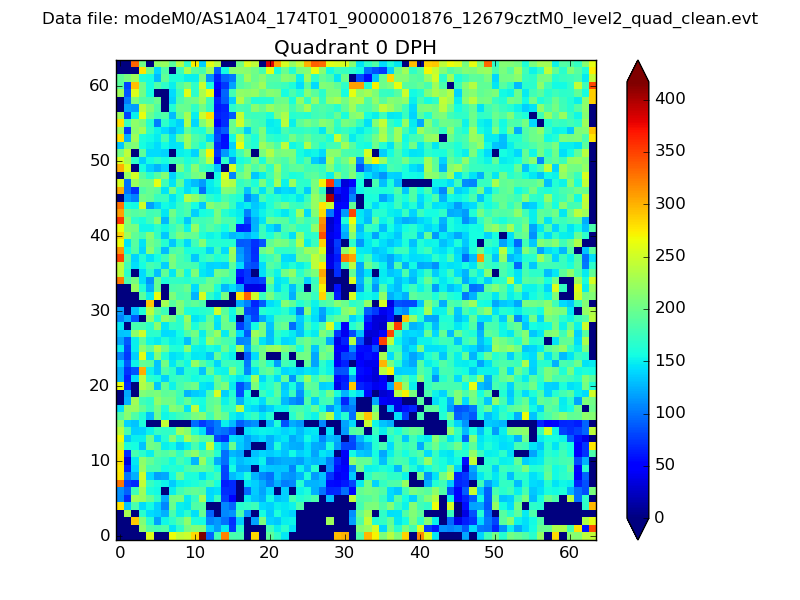 |
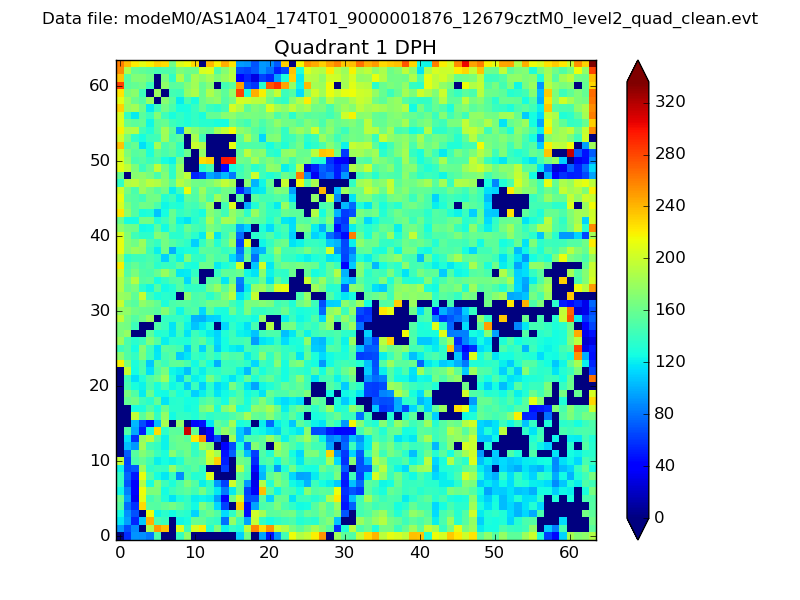 |
Quadrant B |
|---|---|---|---|
| Quadrant D | 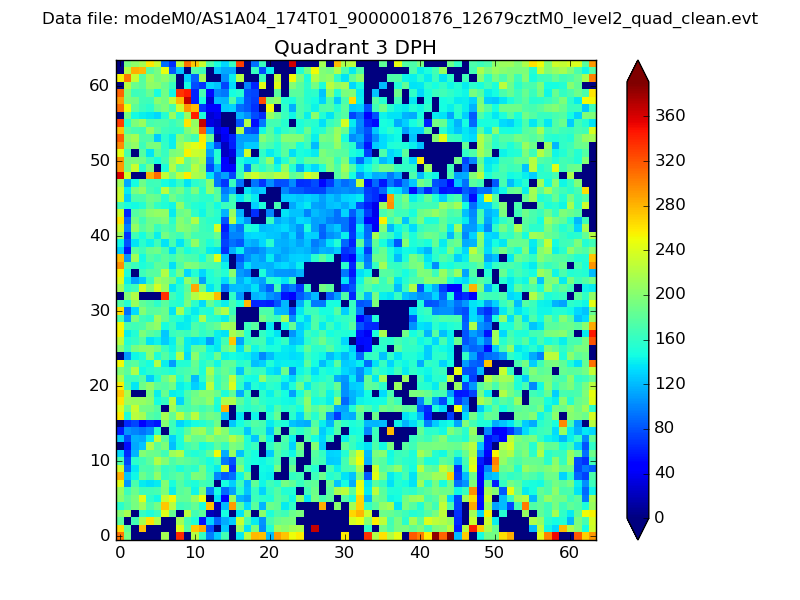 |
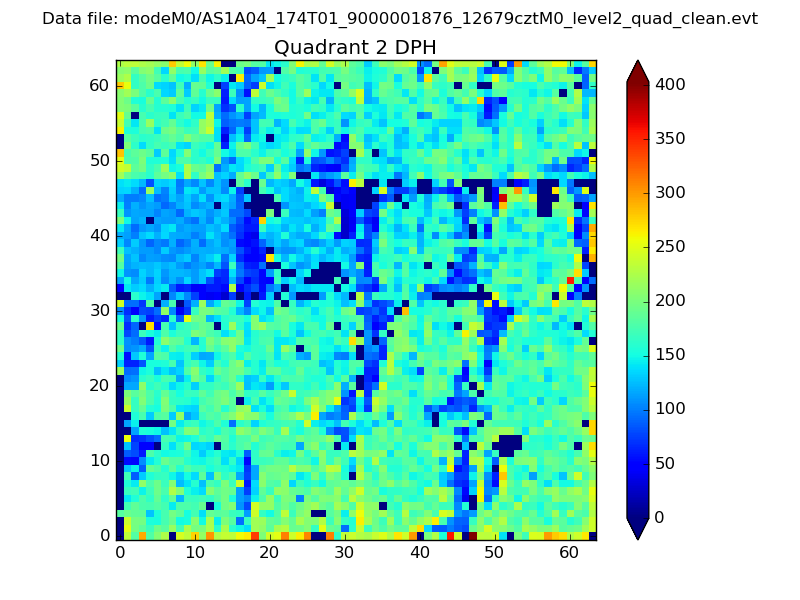 |
Quadrant C |
| Plot type | Count rate plots | Images |
|---|---|---|
| Comparison with Poisson distribution Blue bars denote a histogram of data divided into 1 sec bins. Red curve is a Poisson curve with rate = median count rate of data. |
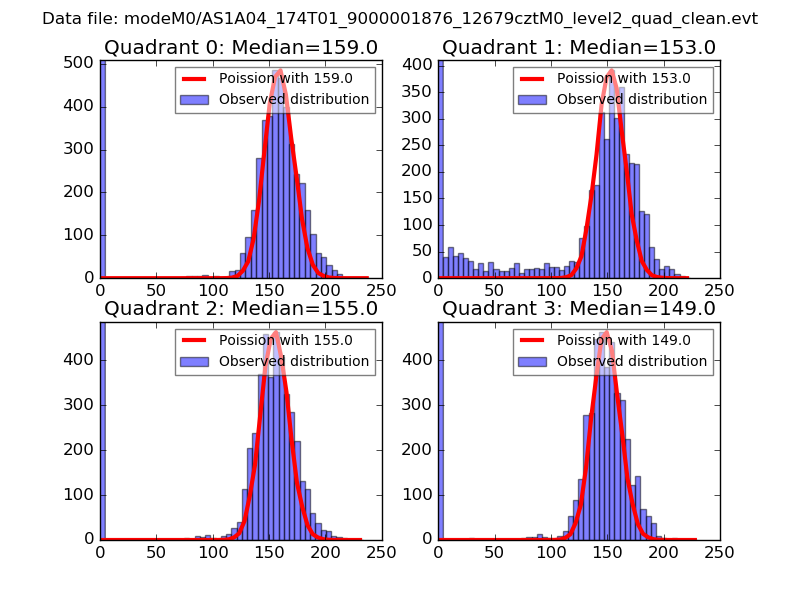 |
 |
| Quadrant-wise count rates Data is divided into 100 sec bins |
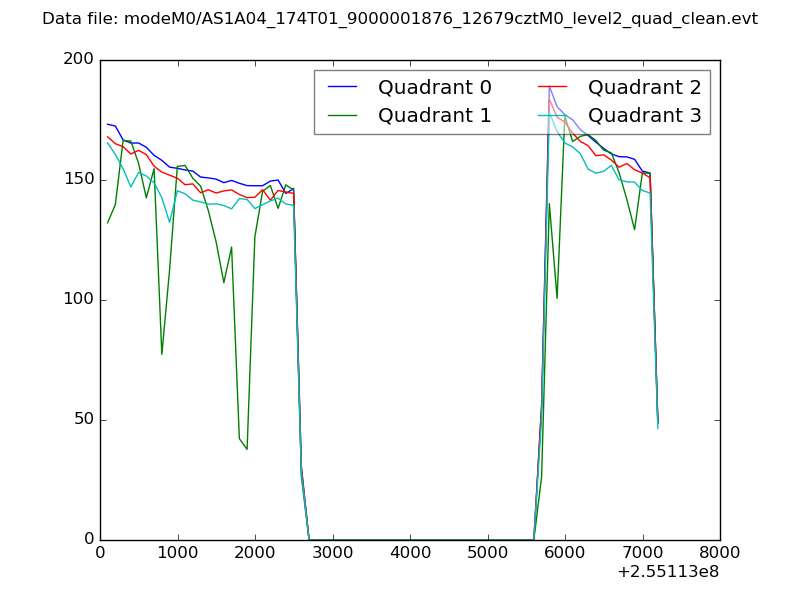 |
|
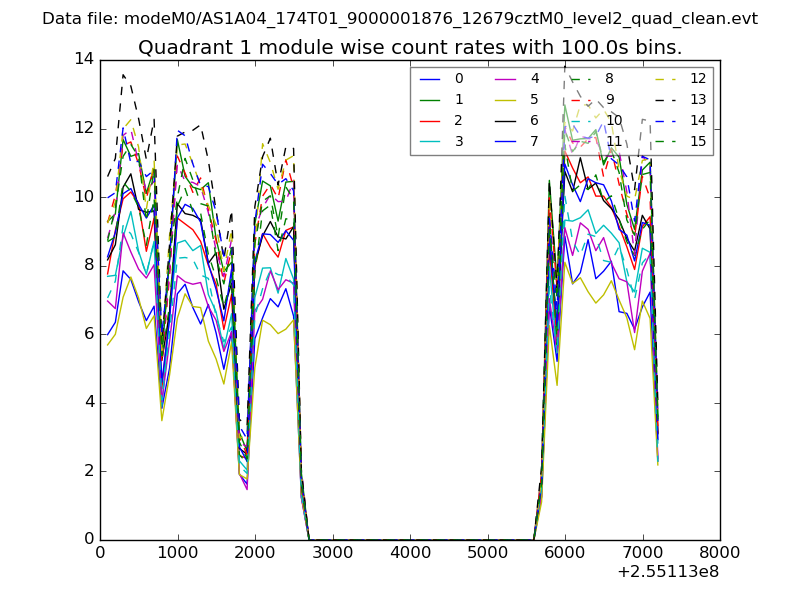
| Module-wise count rates for Quadrant A Data is divided into 100 sec bins |
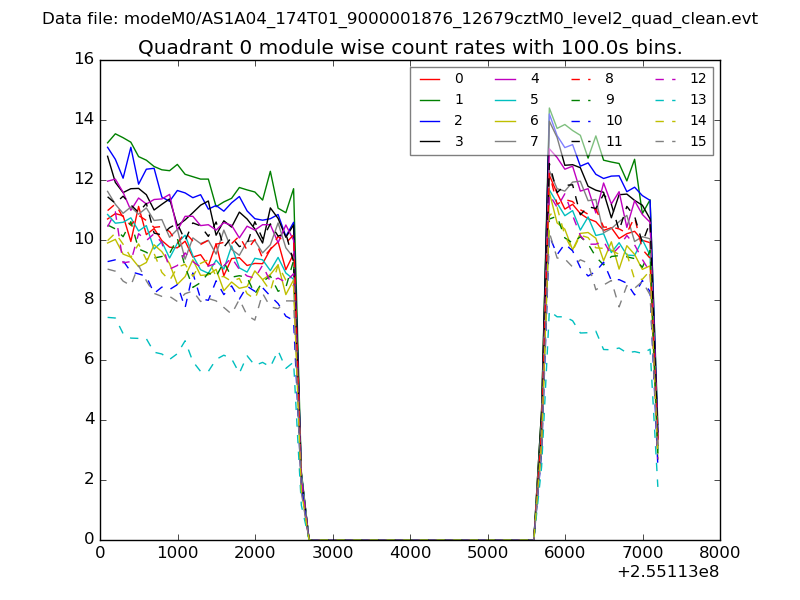 |
 |
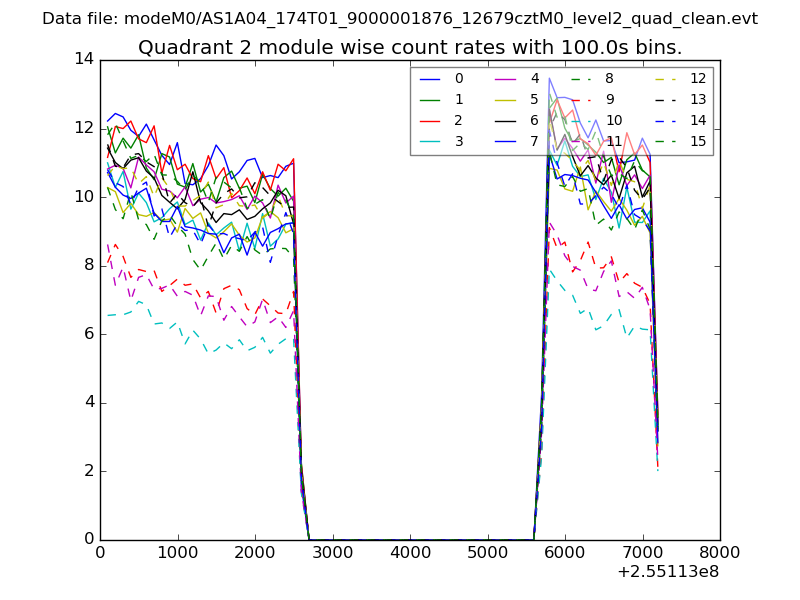
| Module-wise count rates for Quadrant B Data is divided into 100 sec bins |
 |
 |
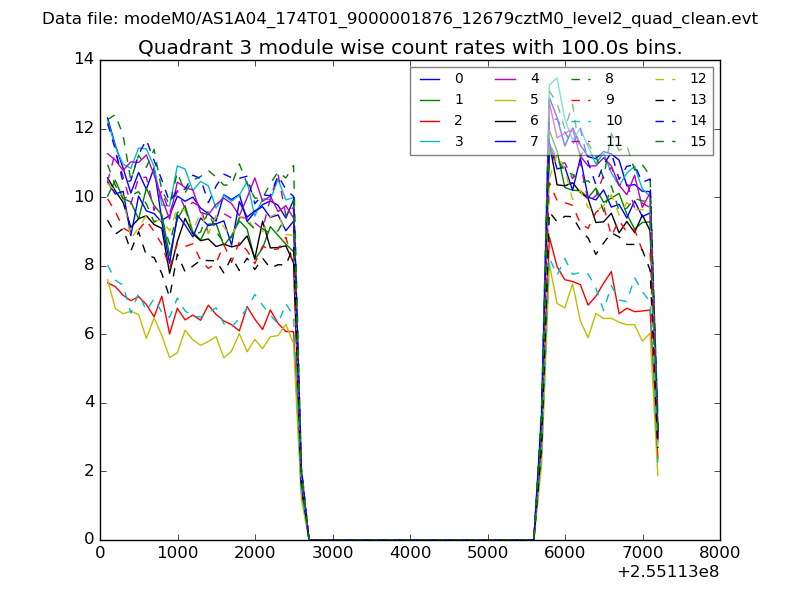
| Module-wise count rates for Quadrant C Data is divided into 100 sec bins |
 |
 |
| Module-wise count rates for Quadrant D Data is divided into 100 sec bins |
 |
 |
| Parameter | Plot |
|---|---|
| CZT HV Monitor |  |
| D_VDD | 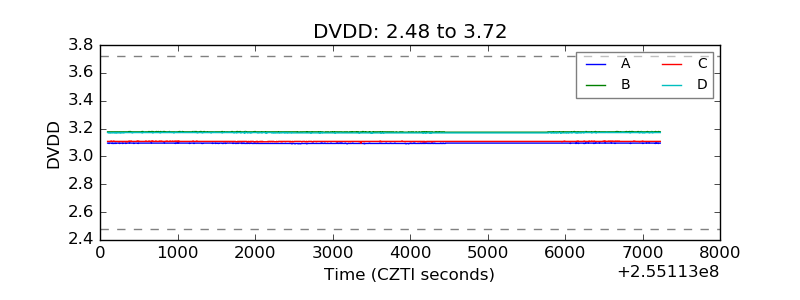 |
| Temperature 1 | 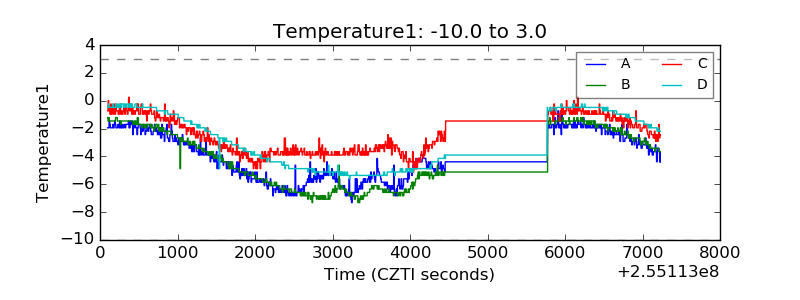 |
| Veto HV Monitor | 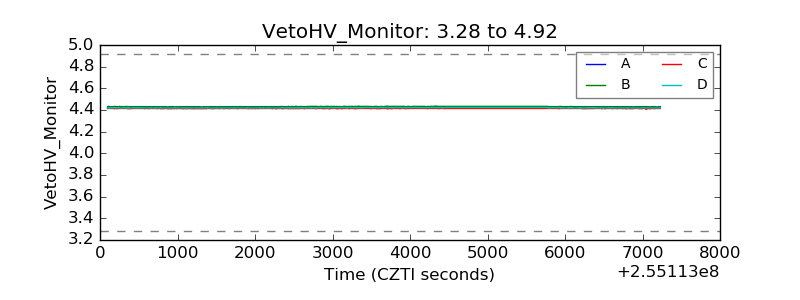 |
| Veto LLD | 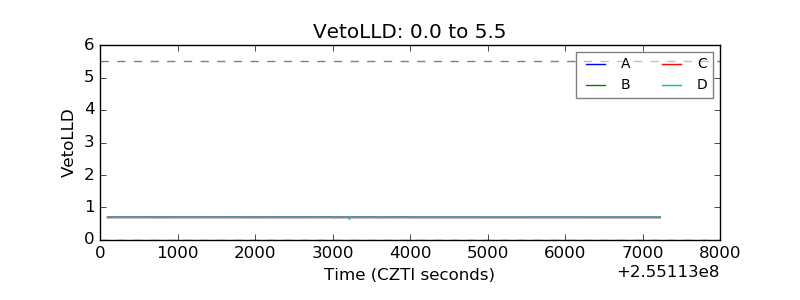 |
| Alpha Counter | 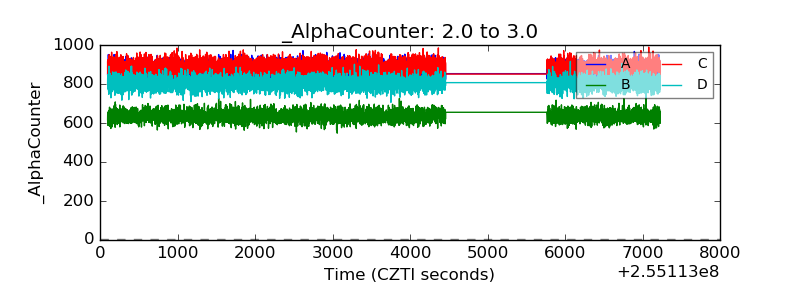 |
| _CPM_Rate | 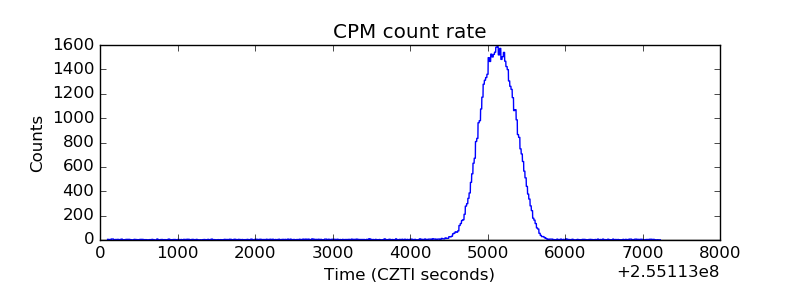 |
| CZT Counter | 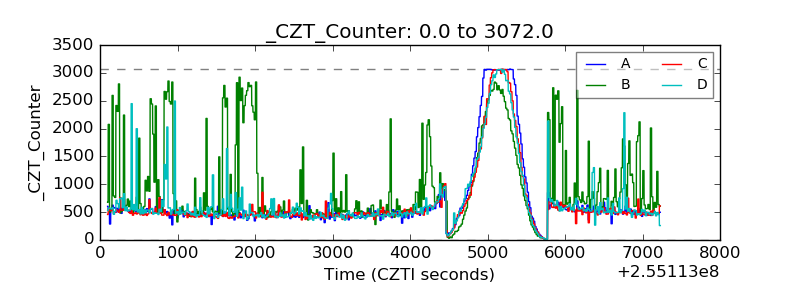 |
| +2.5 Volts monitor |  |
| +5 Volts monitor | 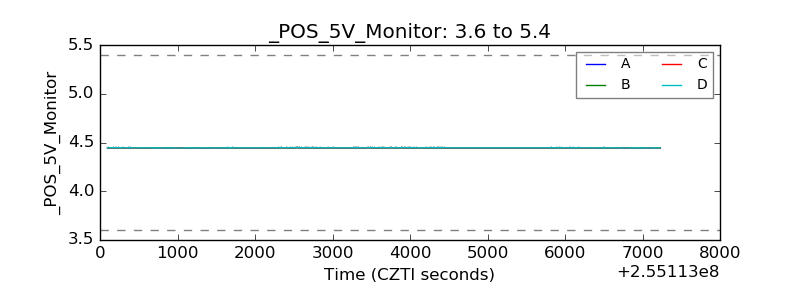 |
| _ROLL_ROT | 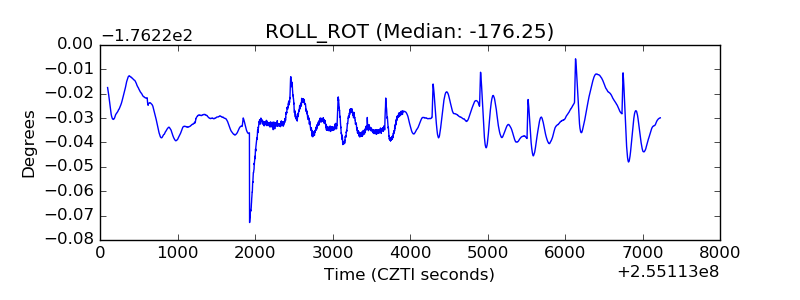 |
| _Roll_DEC | 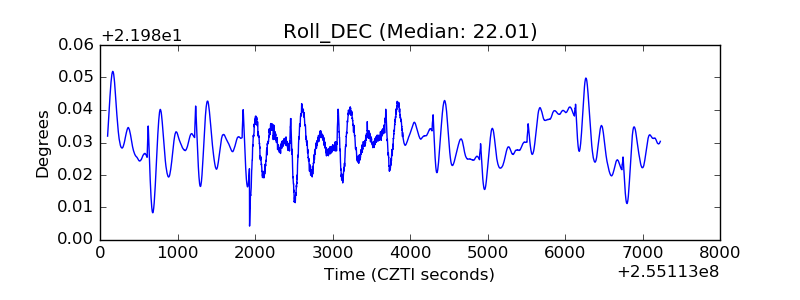 |
| _Roll_RA | 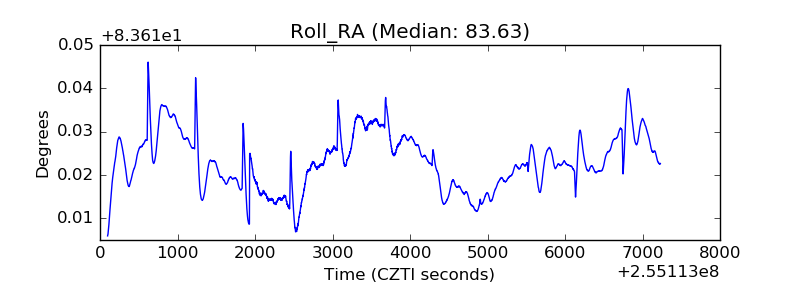 |
| Veto Counter | 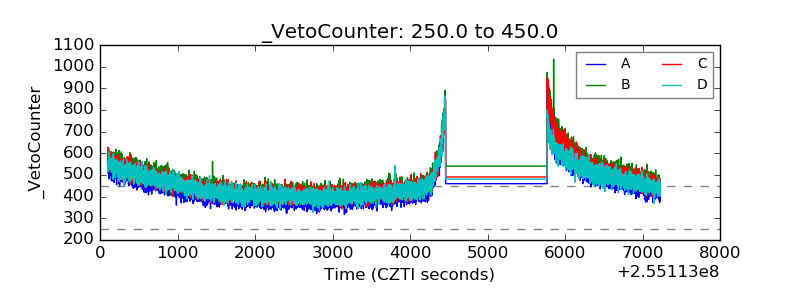 |