| Param | Original file | Final file |
|---|---|---|
| Filename | modeM0/AS1A04_174T01_9000001876_12681cztM0_level2.evt | modeM0/AS1A04_174T01_9000001876_12681cztM0_level2_quad_clean.evt |
| Size (bytes) | 474,246,720 | 92,056,320 |
| Size | 452.3 MB | 87.8 MB |
| Events in quadrant A | 3,074,139 | 601,296 |
| Events in quadrant B | 4,285,458 | 588,546 |
| Events in quadrant C | 3,067,779 | 594,621 |
| Events in quadrant D | 3,507,792 | 564,117 |
| Mode M9 | |||
|---|---|---|---|
| Quadrant | BADHDUFLAG | Total packets | Discarded packets |
| A | 0 | 11 | 0 |
| B | 0 | 11 | 0 |
| C | 0 | 11 | 0 |
| D | 0 | 11 | 0 |
| Mode M0 | |||
|---|---|---|---|
| Quadrant | BADHDUFLAG | Total packets | Discarded packets |
| A | 0 | 13211 | 2 |
| B | 0 | 16896 | 1 |
| C | 0 | 13184 | 1 |
| D | 0 | 14642 | 1 |
| Mode SS | |||
|---|---|---|---|
| Quadrant | BADHDUFLAG | Total packets | Discarded packets |
| A | 0 | 128 | 0 |
| B | 0 | 128 | 0 |
| C | 0 | 128 | 0 |
| D | 0 | 128 | 0 |
| Quadrant | Total seconds | Saturated seconds | Saturation percentage |
|---|---|---|---|
| A | 6293 | 38 | 0.603846% |
| B | 6293 | 321 | 5.100906% |
| C | 6293 | 28 | 0.444939% |
| D | 6293 | 84 | 1.334816% |
Noise dominated data is calculated using 1-second bins in cleaned event files. If a bin has >2000 counts, and if more than 50% of those come from <1% of pixels, then it is considered to be noise-dominated and hence unusable.
| Quadrant | # 1 sec bins | Bins with >0 counts | Bins with >2000 counts | High rate bins dominated by noise | Noise dominated (total time) | Noise dominated (detector-on time) | Marked lightcurve |
|---|---|---|---|---|---|---|---|
| A | 7423 | 6293 | 0 | 0 | 0.00% | 0.00% |  |
| B | 7424 | 6294 | 223 | 223 | 3.00% | 3.54% |  |
| C | 7423 | 6293 | 8 | 8 | 0.11% | 0.13% | 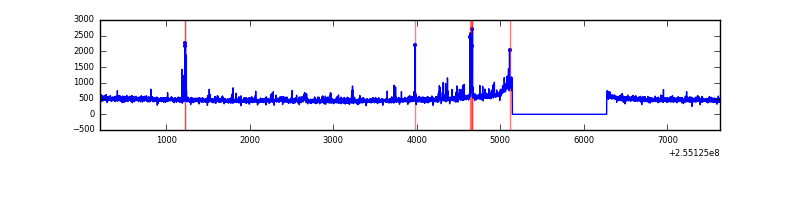 |
| D | 7423 | 6293 | 74 | 74 | 1.00% | 1.18% |  |
Top three noisy pixels from each quadrant. If the there are fewer than three noisy pixels in the level2.evt file, extra rows are filled as -1
| Pixel properties | Quadrant properties | ||||||
|---|---|---|---|---|---|---|---|
| Quadrant | DetID | PixID | Counts | Sigma | Mean | Median | Sigma |
| A | 5 | 98 | 57648 | 358.33 | 777 | 762 | 158.8 |
| A | 12 | 189 | 9479 | 54.91 | 777 | 762 | 158.8 |
| A | 8 | 15 | 8938 | 51.5 | 777 | 762 | 158.8 |
| B | 4 | 239 | 703522 | 4826.76 | 765 | 749 | 145.6 |
| B | 3 | 64 | 387247 | 2654.53 | 765 | 749 | 145.6 |
| B | 3 | 209 | 97759 | 666.28 | 765 | 749 | 145.6 |
| C | 15 | 208 | 111346 | 631.51 | 754 | 760 | 175.1 |
| C | 14 | 234 | 14067 | 75.99 | 754 | 760 | 175.1 |
| C | 13 | 61 | 5617 | 27.74 | 754 | 760 | 175.1 |
| D | 1 | 52 | 547926 | 2933.35 | 745 | 730 | 186.5 |
| D | 13 | 104 | 52189 | 275.86 | 745 | 730 | 186.5 |
| D | 13 | 249 | 31776 | 166.43 | 745 | 730 | 186.5 |
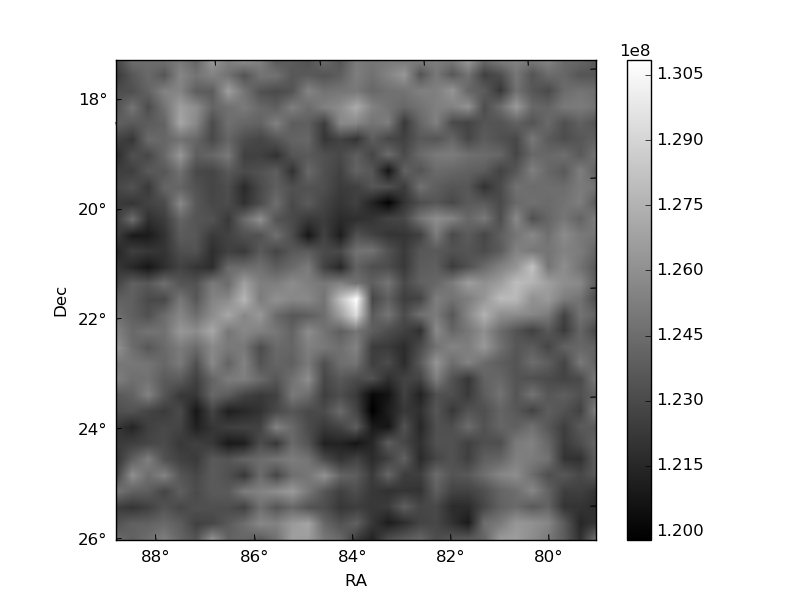
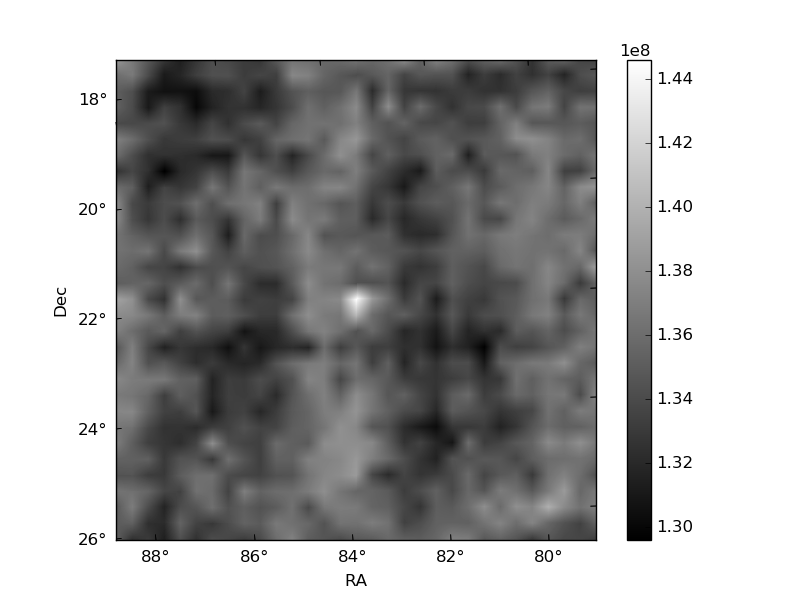
Histogram calculated using DETX and DETY for each event in the final _common_clean file
| Quadrant A | 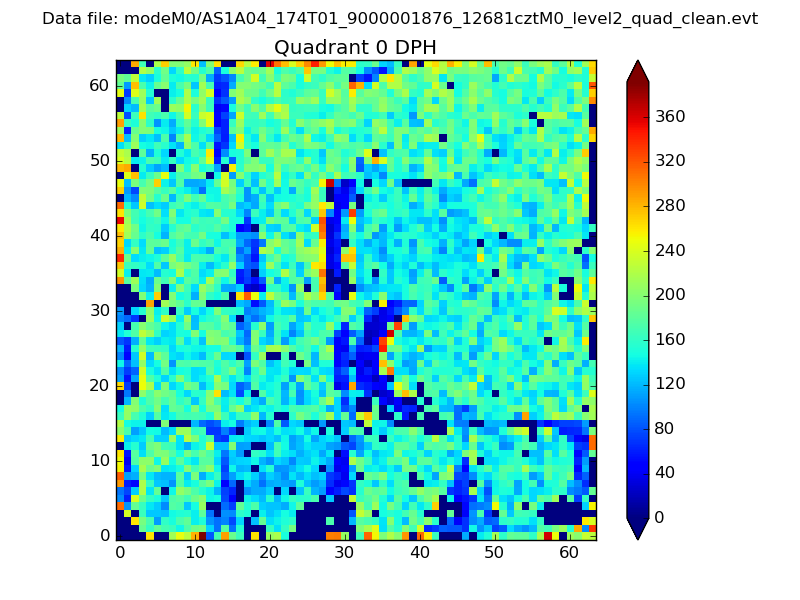 |
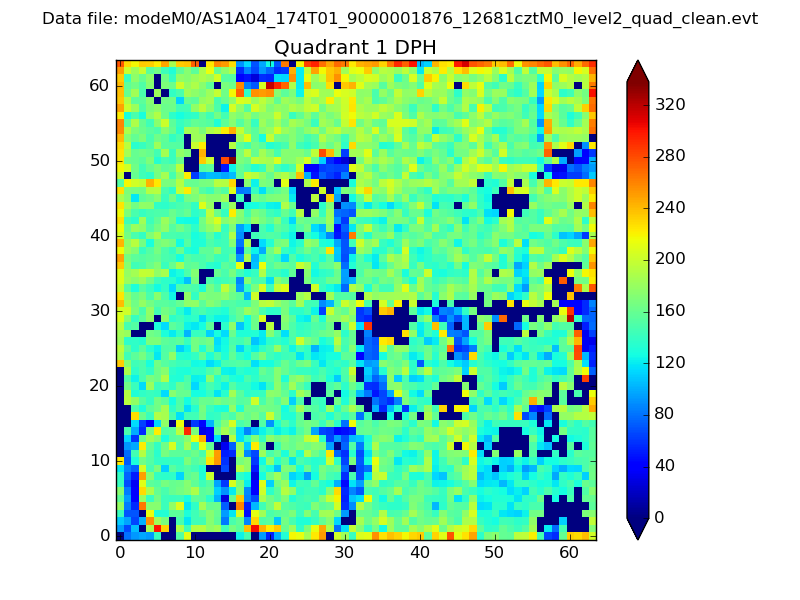 |
Quadrant B |
|---|---|---|---|
| Quadrant D | 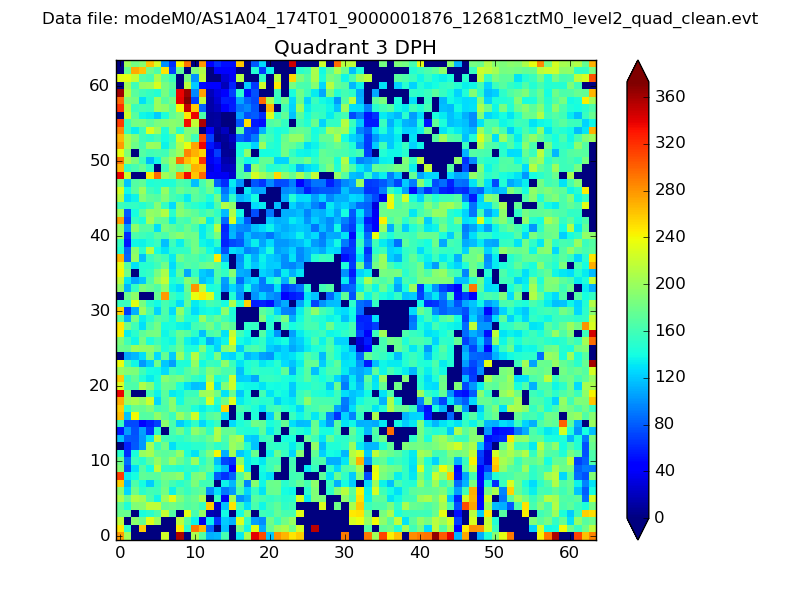 |
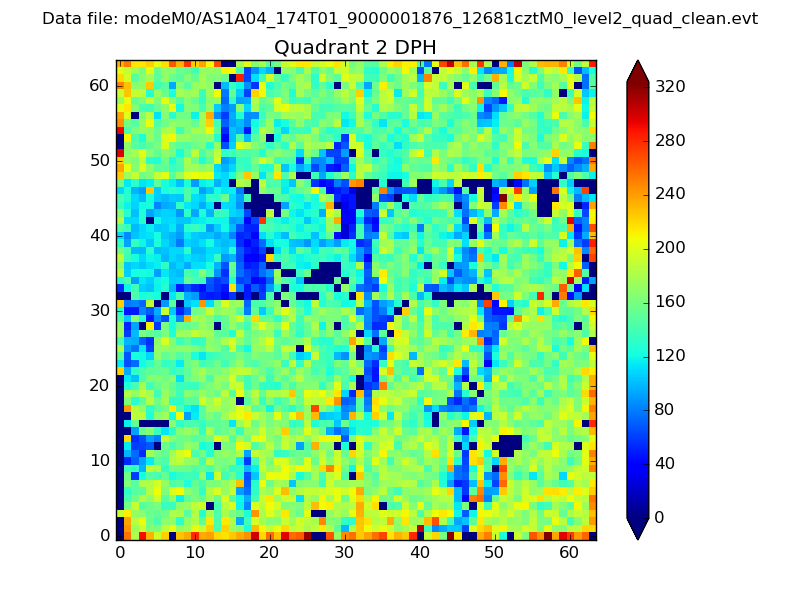 |
Quadrant C |
| Plot type | Count rate plots | Images |
|---|---|---|
| Comparison with Poisson distribution Blue bars denote a histogram of data divided into 1 sec bins. Red curve is a Poisson curve with rate = median count rate of data. |
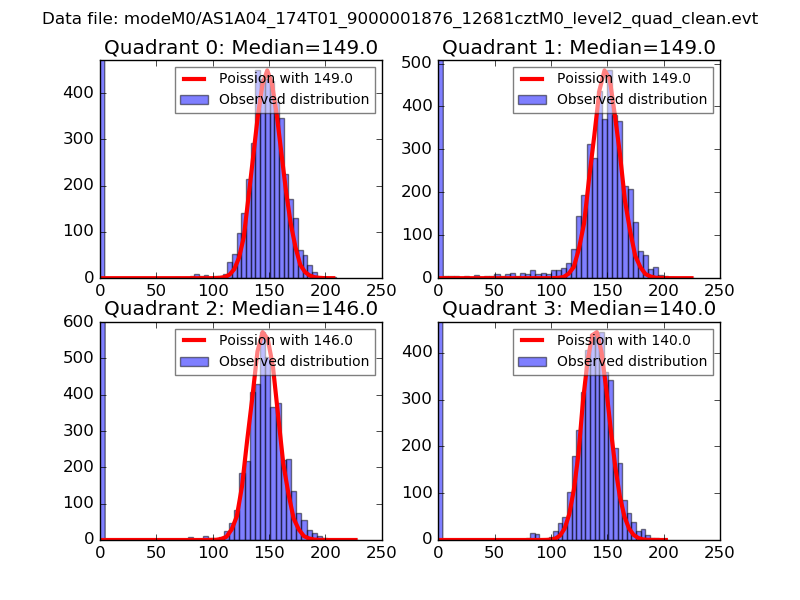 |
 |
| Quadrant-wise count rates Data is divided into 100 sec bins |
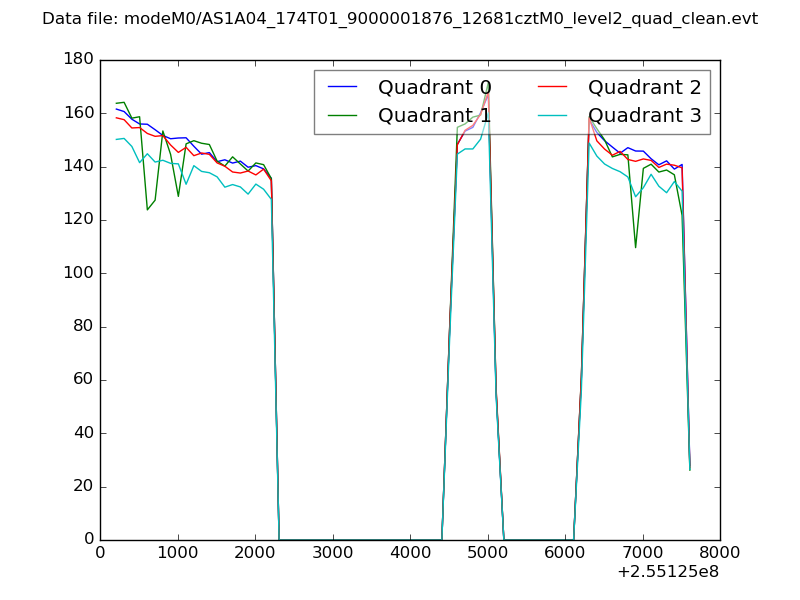 |
|
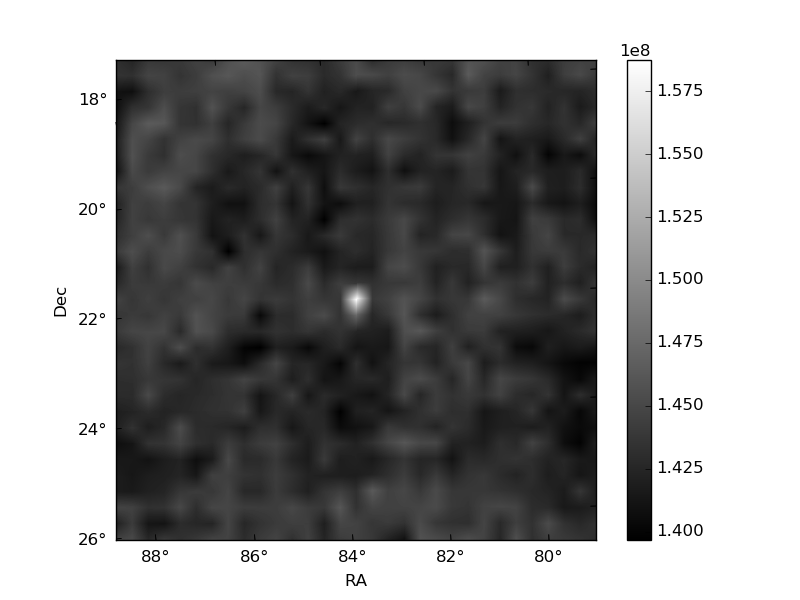
| Module-wise count rates for Quadrant A Data is divided into 100 sec bins |
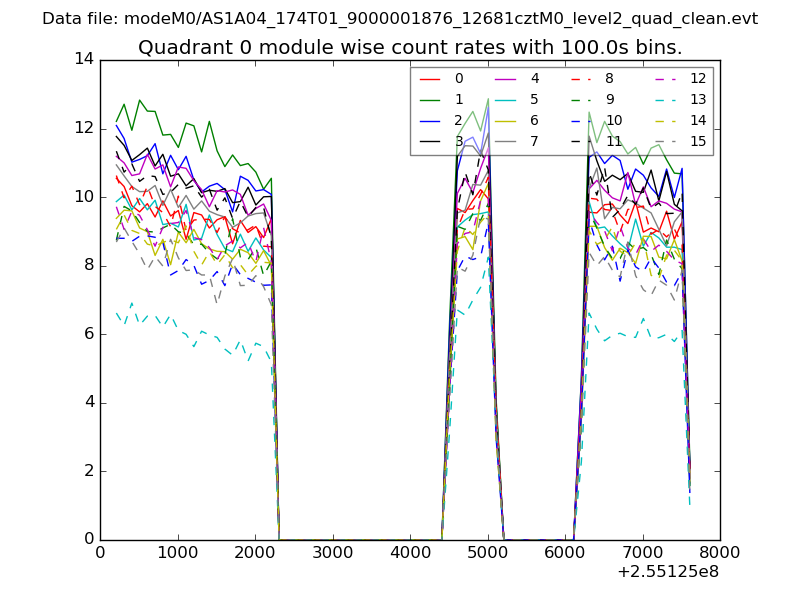 |
 |
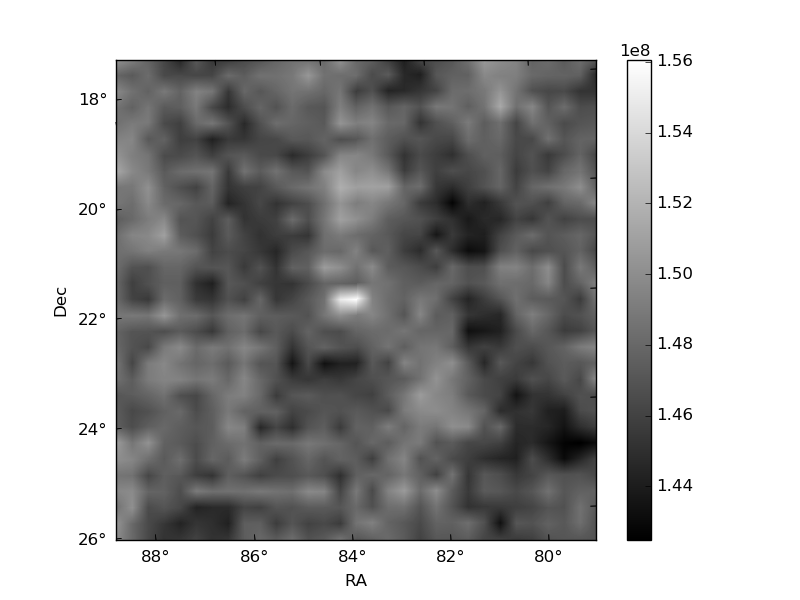
| Module-wise count rates for Quadrant B Data is divided into 100 sec bins |
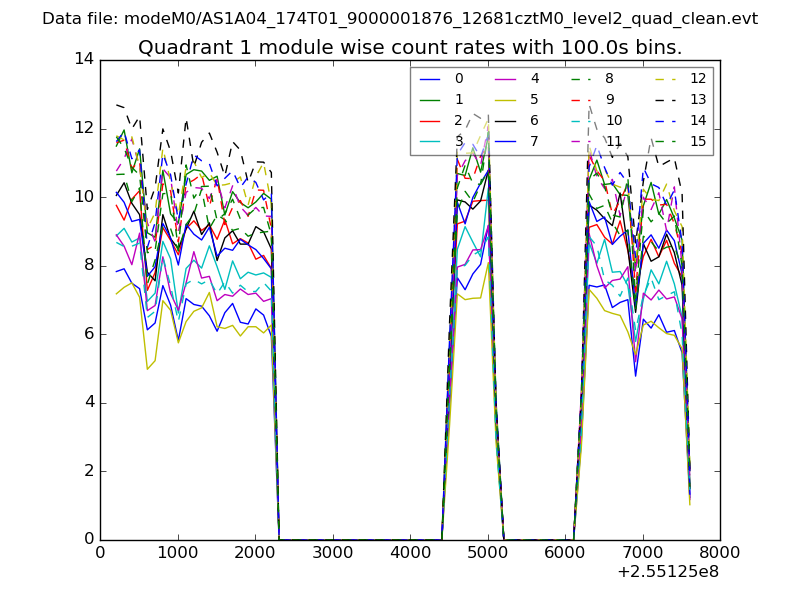 |
 |
| Module-wise count rates for Quadrant C Data is divided into 100 sec bins |
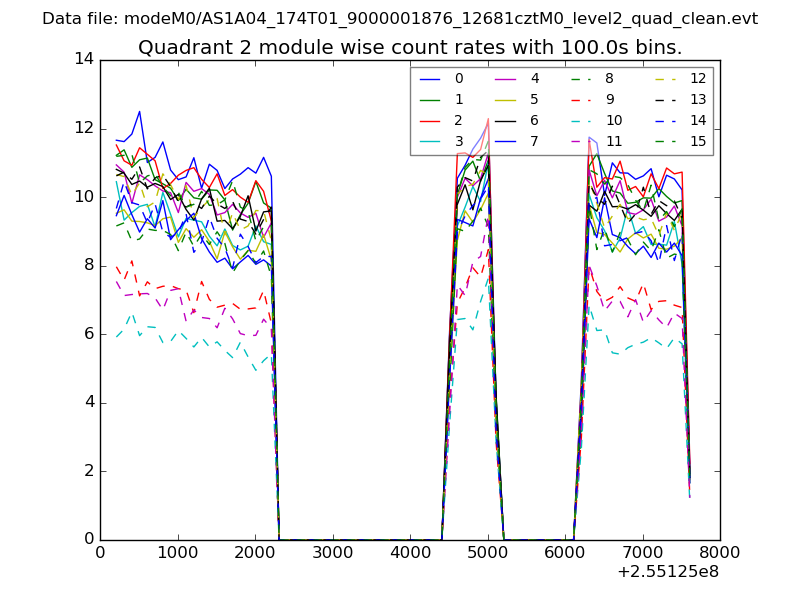 |
 |
| Module-wise count rates for Quadrant D Data is divided into 100 sec bins |
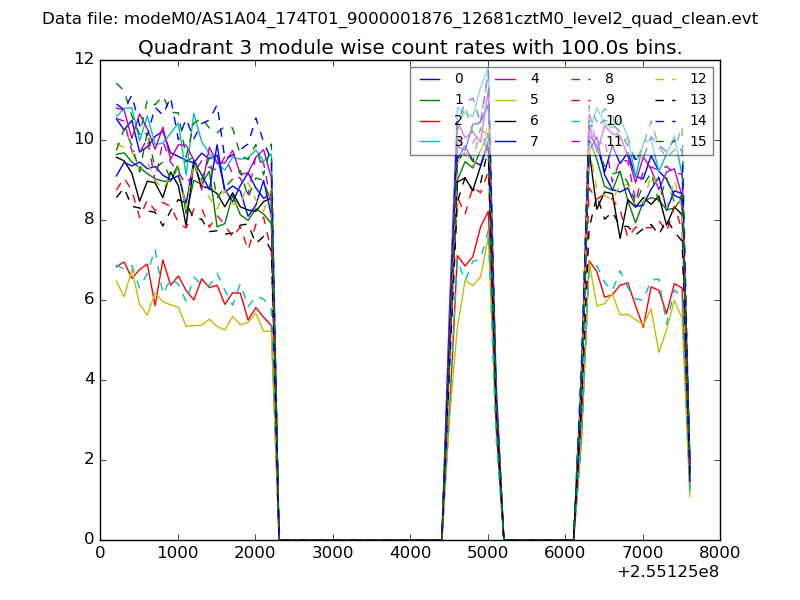 |
 |
| Parameter | Plot |
|---|---|
| CZT HV Monitor |  |
| D_VDD | 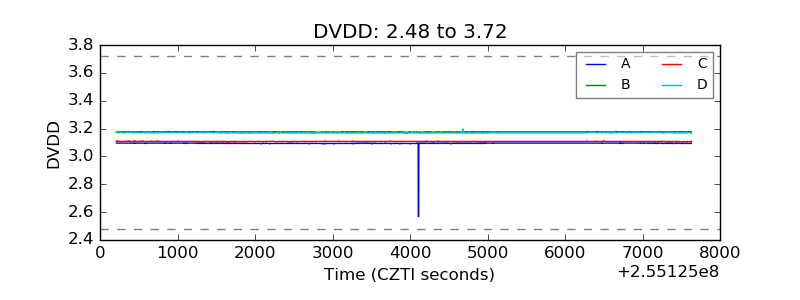 |
| Temperature 1 | 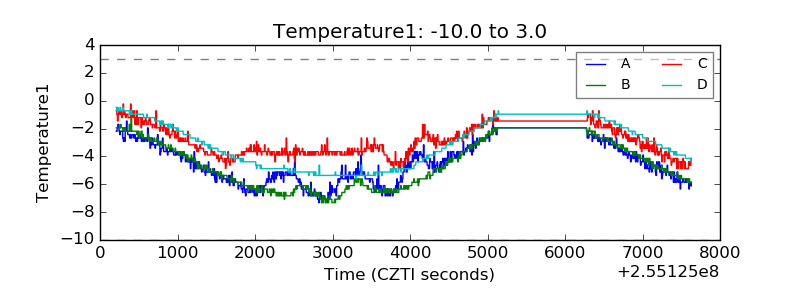 |
| Veto HV Monitor | 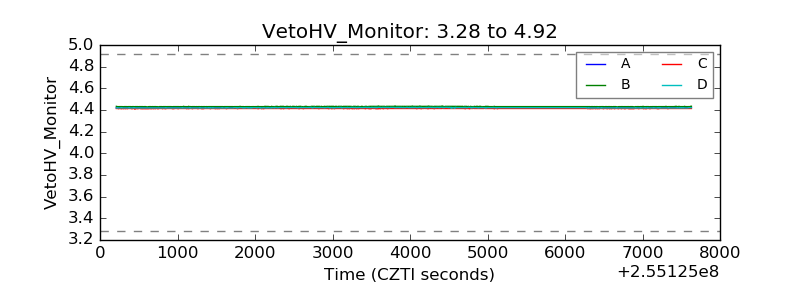 |
| Veto LLD | 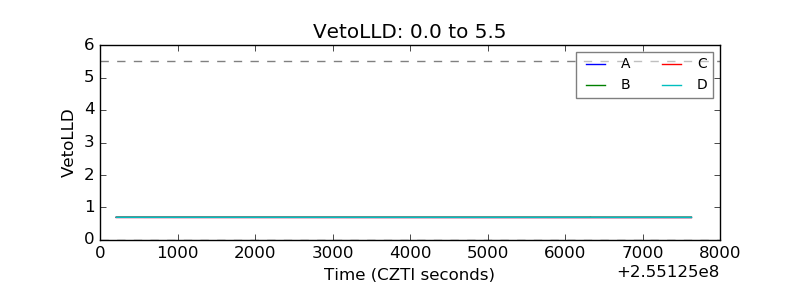 |
| Alpha Counter | 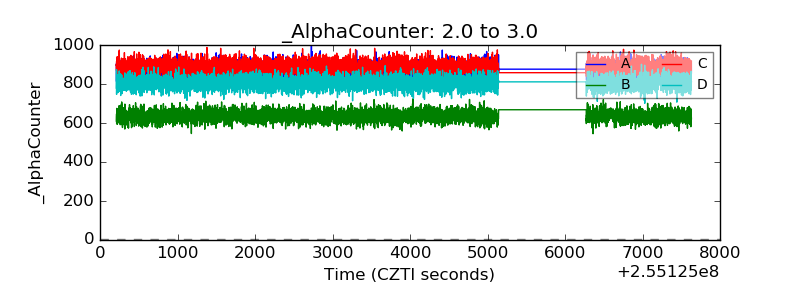 |
| _CPM_Rate | 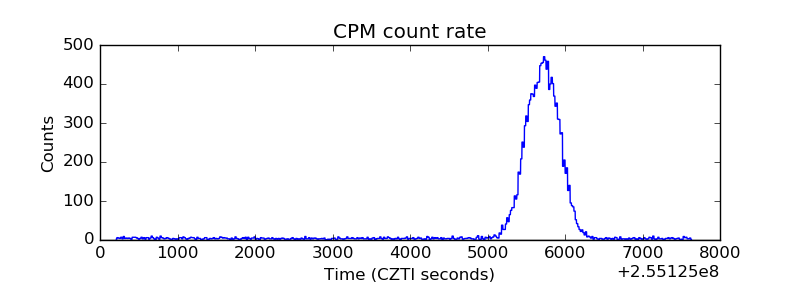 |
| CZT Counter | 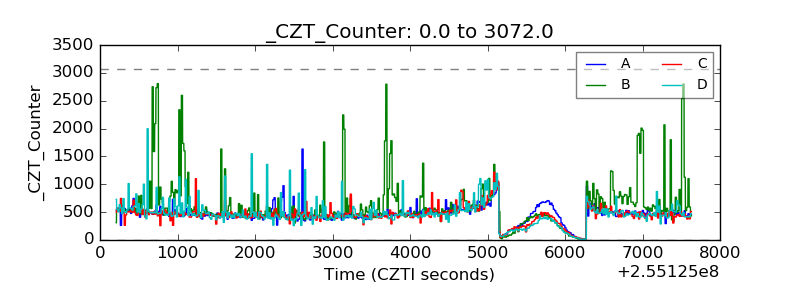 |
| +2.5 Volts monitor |  |
| +5 Volts monitor |  |
| _ROLL_ROT | 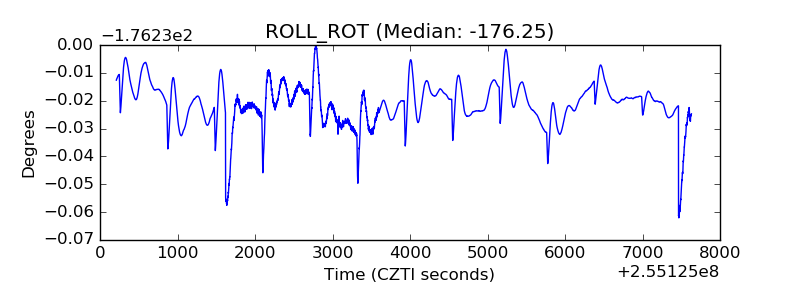 |
| _Roll_DEC | 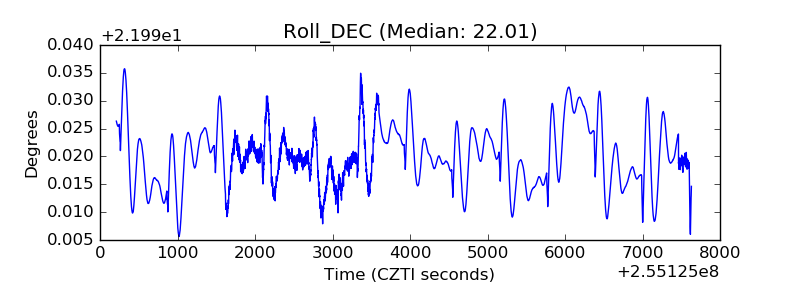 |
| _Roll_RA | 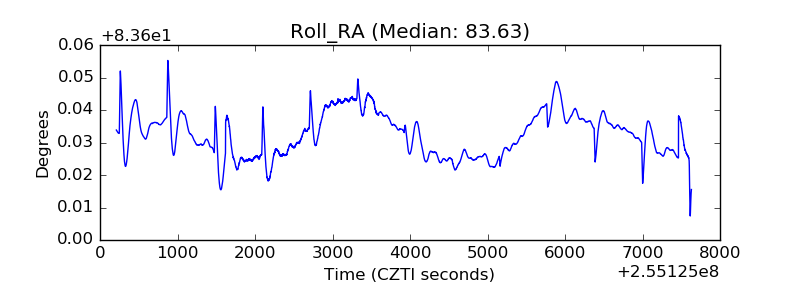 |
| Veto Counter |  |