| Param | Original file | Final file |
|---|---|---|
| Filename | modeM0/AS1A04_174T01_9000001876_12682cztM0_level2.evt | modeM0/AS1A04_174T01_9000001876_12682cztM0_level2_quad_clean.evt |
| Size (bytes) | 517,426,560 | 94,498,560 |
| Size | 493.5 MB | 90.1 MB |
| Events in quadrant A | 3,153,274 | 631,141 |
| Events in quadrant B | 5,118,878 | 562,858 |
| Events in quadrant C | 3,163,160 | 623,822 |
| Events in quadrant D | 3,786,149 | 582,684 |
| Mode M9 | |||
|---|---|---|---|
| Quadrant | BADHDUFLAG | Total packets | Discarded packets |
| A | 0 | 9 | 0 |
| B | 0 | 9 | 0 |
| C | 0 | 9 | 0 |
| D | 0 | 9 | 0 |
| Mode M0 | |||
|---|---|---|---|
| Quadrant | BADHDUFLAG | Total packets | Discarded packets |
| A | 0 | 13704 | 2 |
| B | 0 | 19600 | 1 |
| C | 0 | 13828 | 1 |
| D | 0 | 15895 | 1 |
| Mode SS | |||
|---|---|---|---|
| Quadrant | BADHDUFLAG | Total packets | Discarded packets |
| A | 0 | 134 | 0 |
| B | 0 | 134 | 0 |
| C | 0 | 134 | 0 |
| D | 0 | 134 | 0 |
| Quadrant | Total seconds | Saturated seconds | Saturation percentage |
|---|---|---|---|
| A | 6612 | 29 | 0.438596% |
| B | 6612 | 761 | 11.509377% |
| C | 6612 | 13 | 0.196612% |
| D | 6612 | 197 | 2.979431% |
Noise dominated data is calculated using 1-second bins in cleaned event files. If a bin has >2000 counts, and if more than 50% of those come from <1% of pixels, then it is considered to be noise-dominated and hence unusable.
| Quadrant | # 1 sec bins | Bins with >0 counts | Bins with >2000 counts | High rate bins dominated by noise | Noise dominated (total time) | Noise dominated (detector-on time) | Marked lightcurve |
|---|---|---|---|---|---|---|---|
| A | 7437 | 6612 | 1 | 1 | 0.01% | 0.02% | 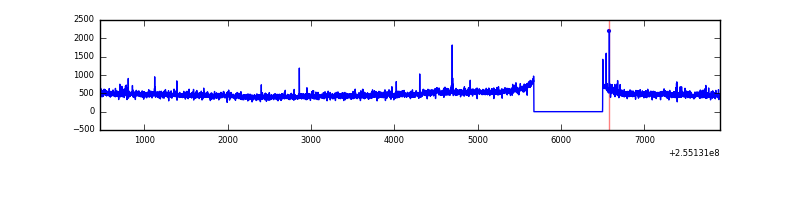 |
| B | 7437 | 6612 | 629 | 629 | 8.46% | 9.51% | 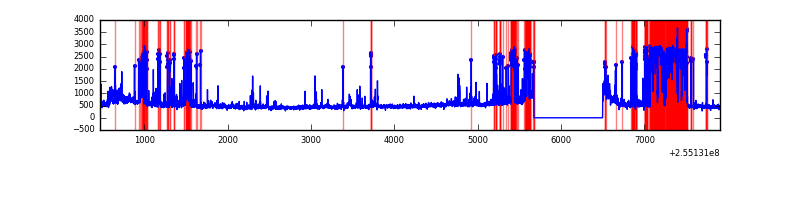 |
| C | 7437 | 6612 | 13 | 13 | 0.17% | 0.20% | 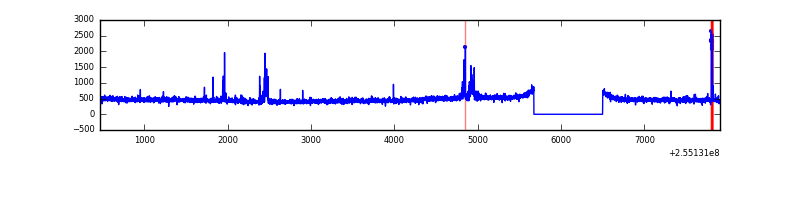 |
| D | 7437 | 6612 | 175 | 175 | 2.35% | 2.65% | 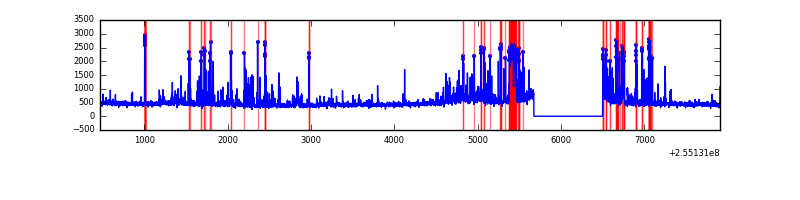 |
Top three noisy pixels from each quadrant. If the there are fewer than three noisy pixels in the level2.evt file, extra rows are filled as -1
| Pixel properties | Quadrant properties | ||||||
|---|---|---|---|---|---|---|---|
| Quadrant | DetID | PixID | Counts | Sigma | Mean | Median | Sigma |
| A | 12 | 189 | 54715 | 331.97 | 796 | 781 | 162.5 |
| A | 9 | 143 | 22691 | 134.86 | 796 | 781 | 162.5 |
| A | 8 | 15 | 10406 | 59.24 | 796 | 781 | 162.5 |
| B | 4 | 239 | 1920270 | 13624.95 | 747 | 733 | 140.9 |
| B | 3 | 209 | 107659 | 758.97 | 747 | 733 | 140.9 |
| B | 11 | 51 | 38825 | 270.38 | 747 | 733 | 140.9 |
| C | 15 | 208 | 140429 | 779.22 | 774 | 782 | 179.2 |
| C | 13 | 61 | 5635 | 27.08 | 774 | 782 | 179.2 |
| C | 8 | 222 | 3072 | 12.78 | 774 | 782 | 179.2 |
| D | 1 | 52 | 742031 | 3937.42 | 753 | 738 | 188.3 |
| D | 10 | 199 | 77760 | 409.11 | 753 | 738 | 188.3 |
| D | 8 | 195 | 43171 | 225.39 | 753 | 738 | 188.3 |
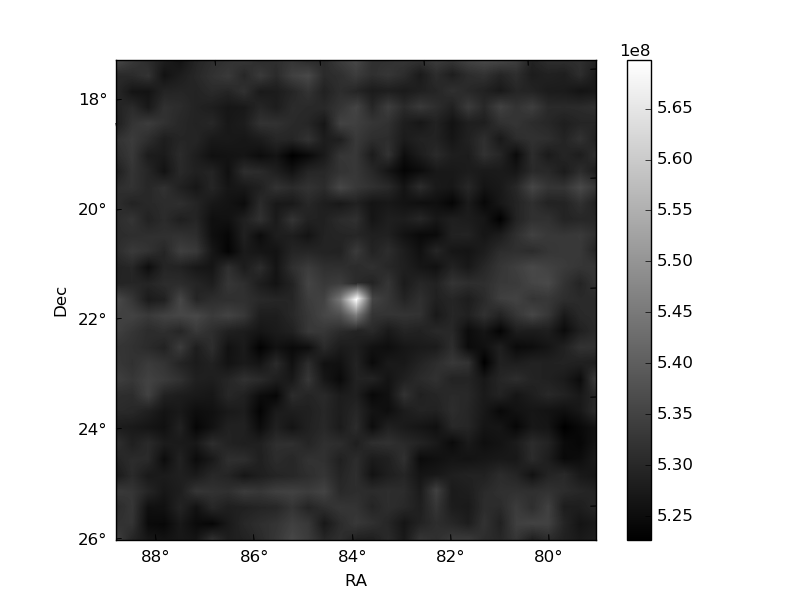
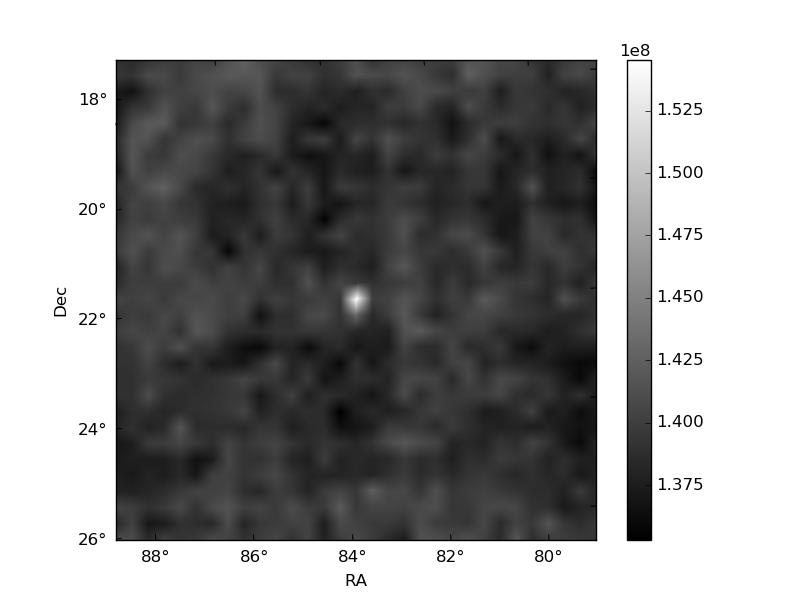
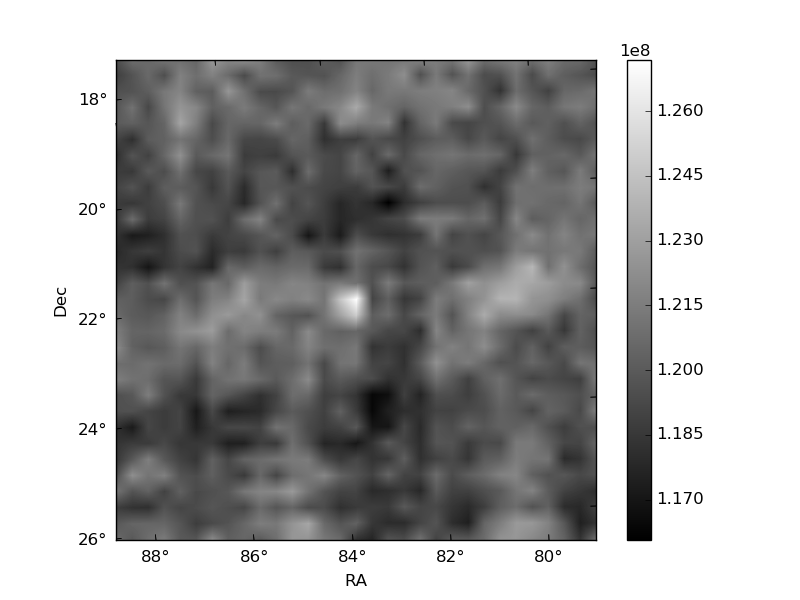
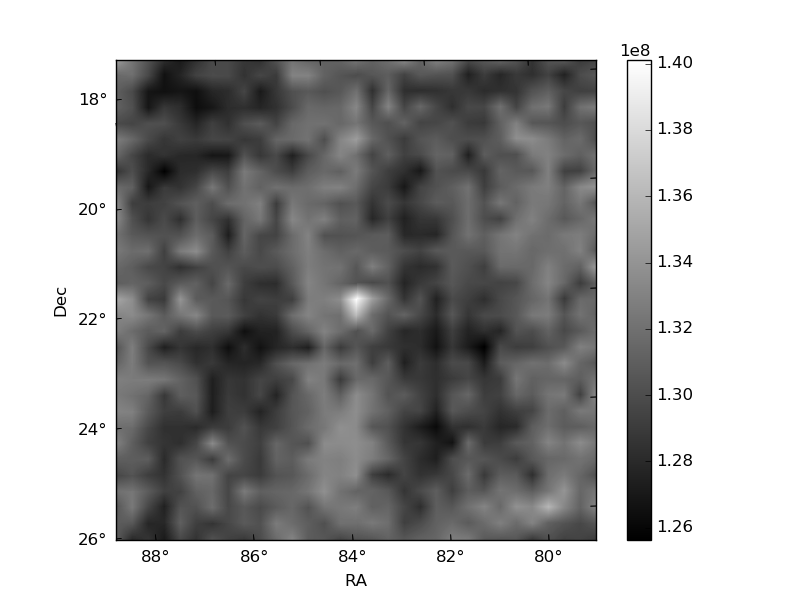
Histogram calculated using DETX and DETY for each event in the final _common_clean file
| Quadrant A | 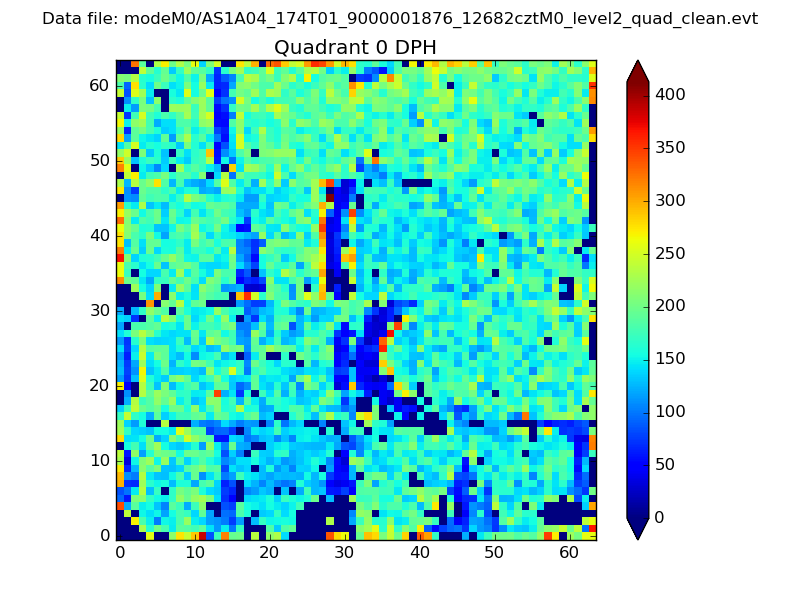 |
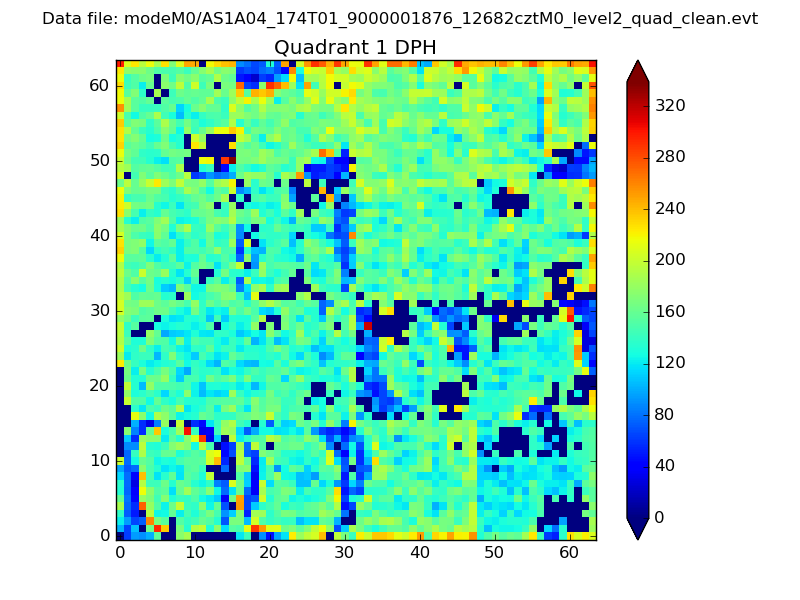 |
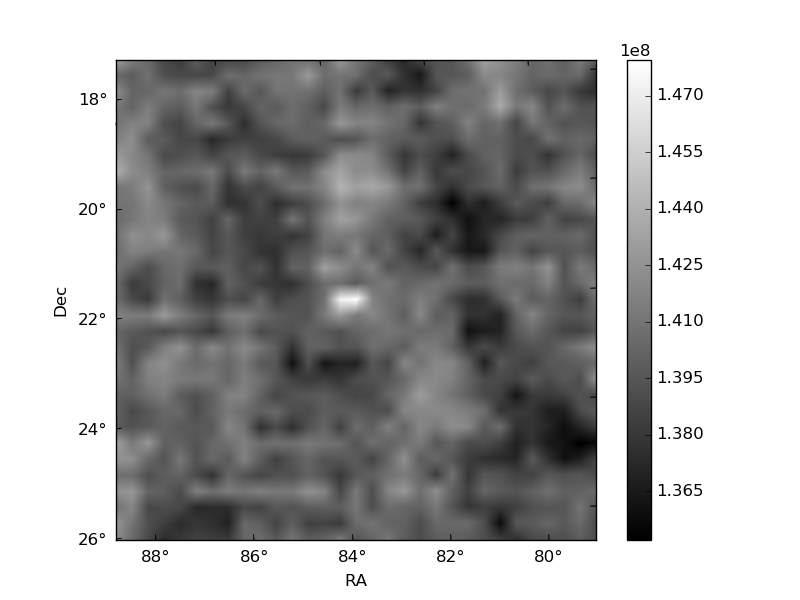
Quadrant B |
|---|---|---|---|
| Quadrant D | 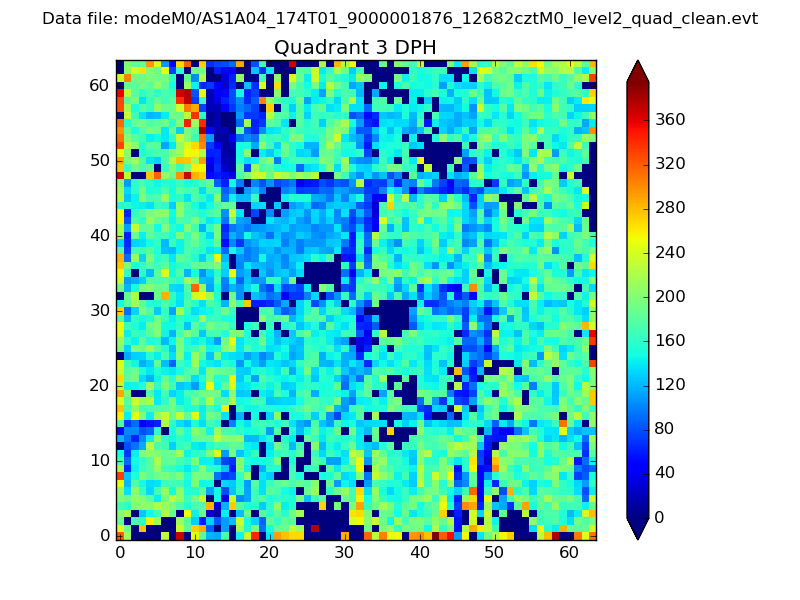 |
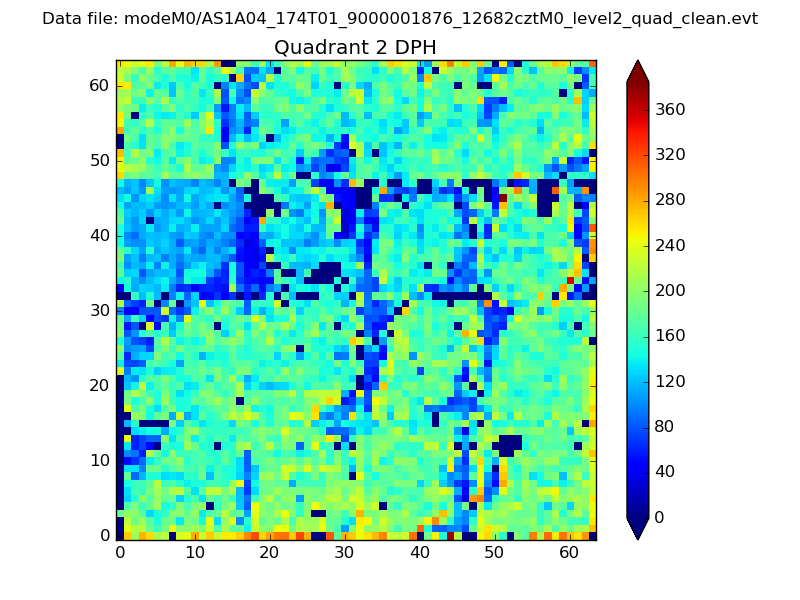 |
Quadrant C |
| Plot type | Count rate plots | Images |
|---|---|---|
| Comparison with Poisson distribution Blue bars denote a histogram of data divided into 1 sec bins. Red curve is a Poisson curve with rate = median count rate of data. |
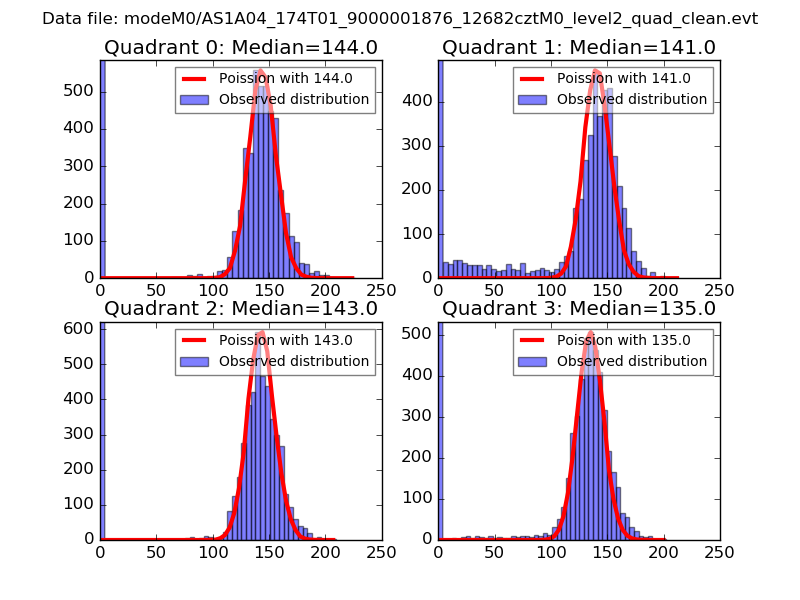 |
 |
| Quadrant-wise count rates Data is divided into 100 sec bins |
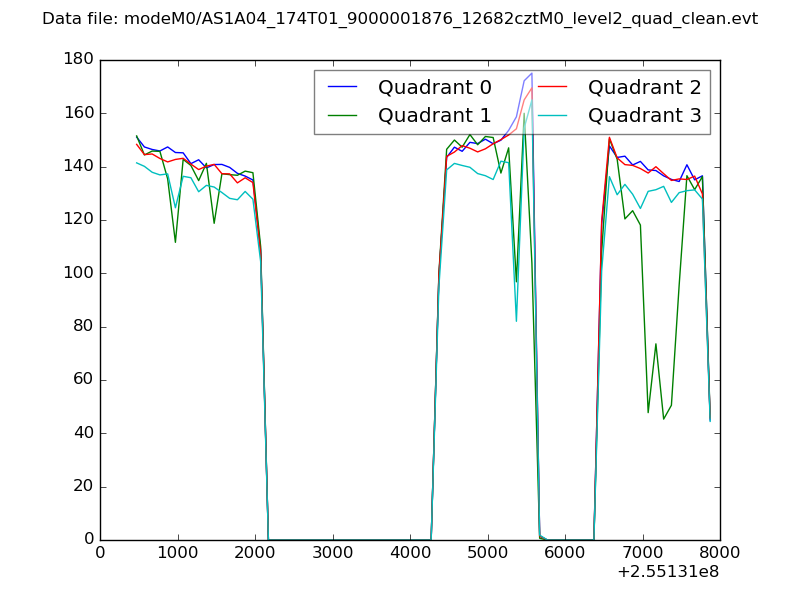 |
|
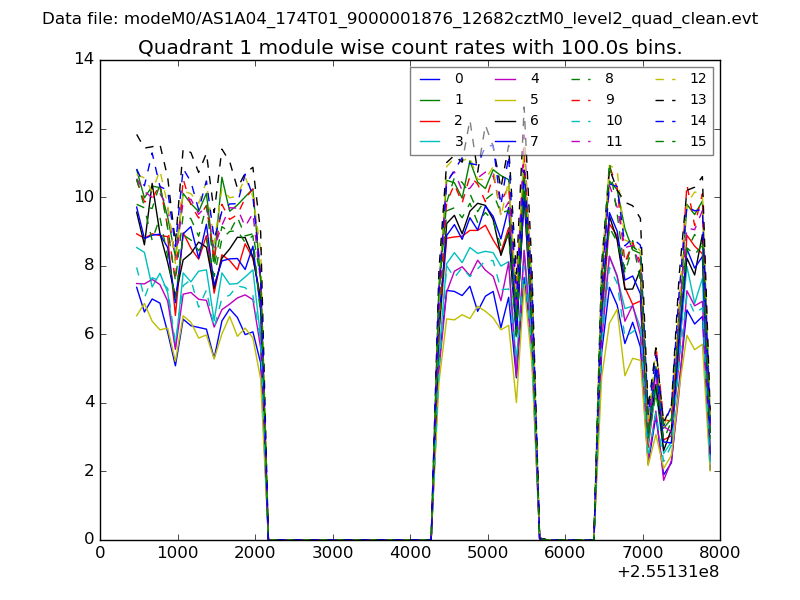
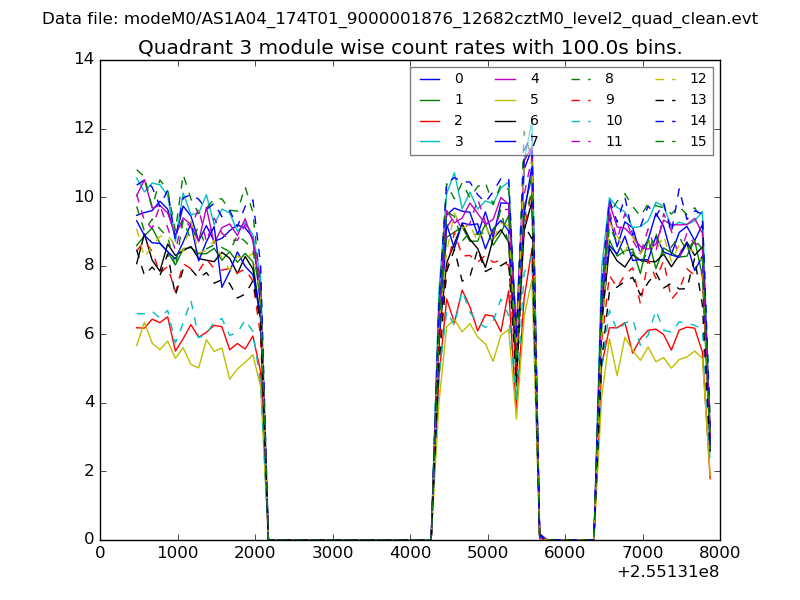
| Module-wise count rates for Quadrant A Data is divided into 100 sec bins |
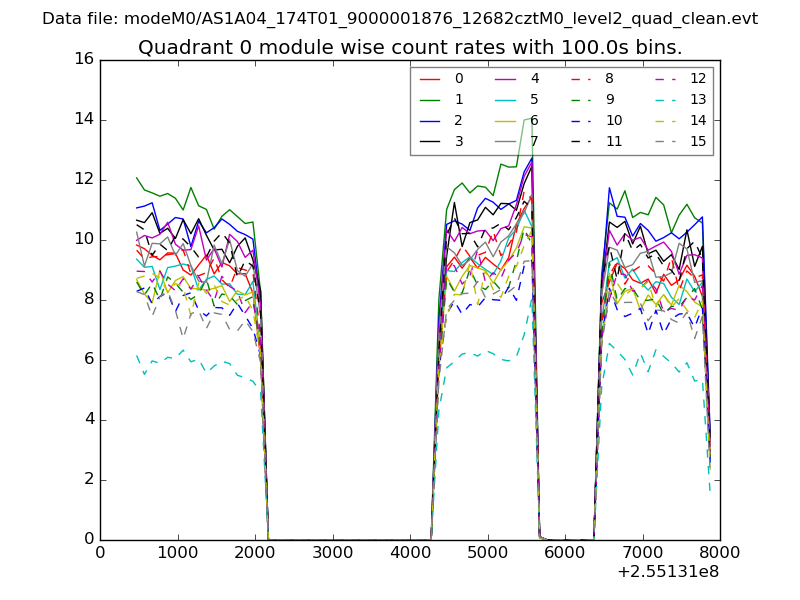 |
 |
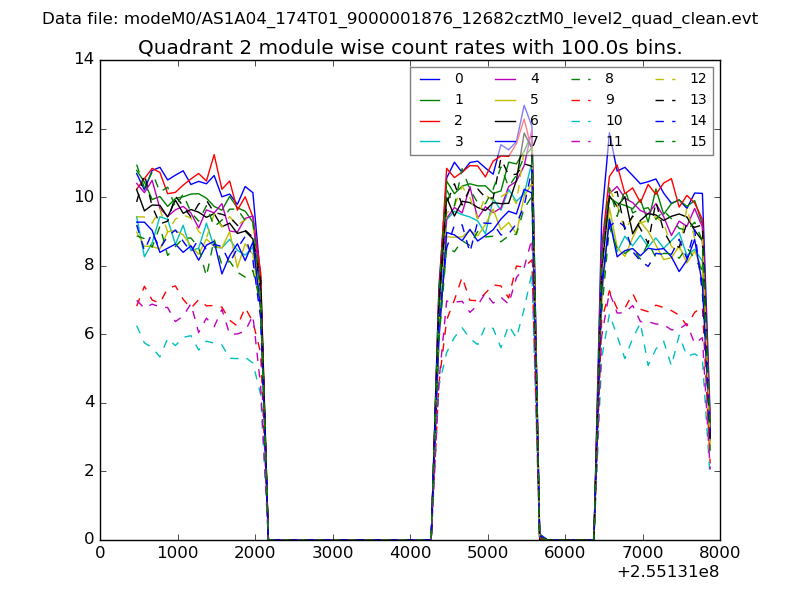
| Module-wise count rates for Quadrant B Data is divided into 100 sec bins |
 |
 |
| Module-wise count rates for Quadrant C Data is divided into 100 sec bins |
 |
 |
| Module-wise count rates for Quadrant D Data is divided into 100 sec bins |
 |
 |
| Parameter | Plot |
|---|---|
| CZT HV Monitor | 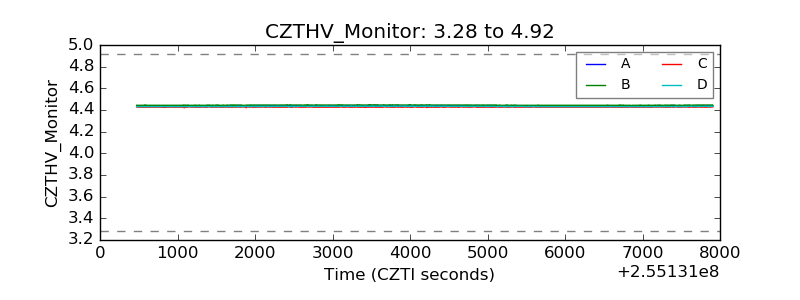 |
| D_VDD | 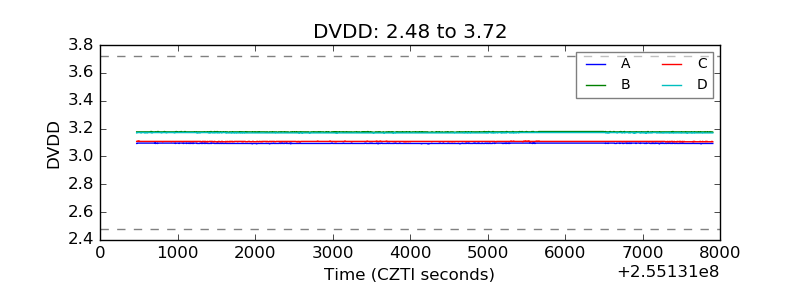 |
| Temperature 1 | 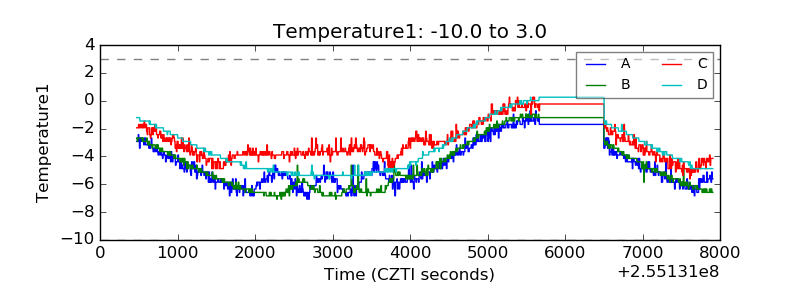 |
| Veto HV Monitor |  |
| Veto LLD | 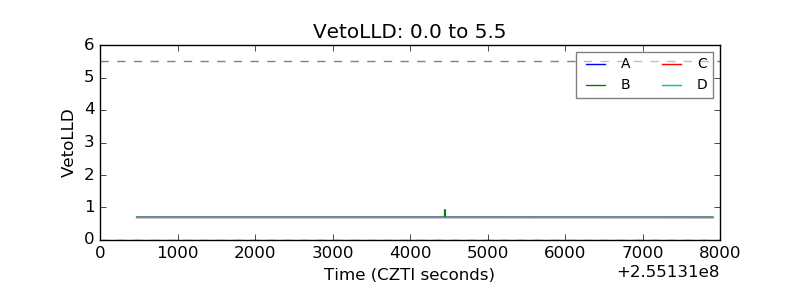 |
| Alpha Counter |  |
| _CPM_Rate | 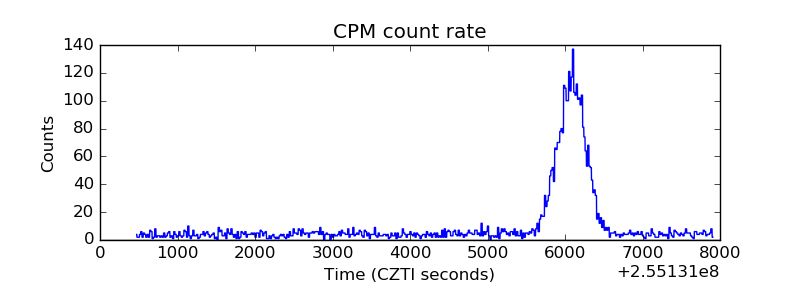 |
| CZT Counter | 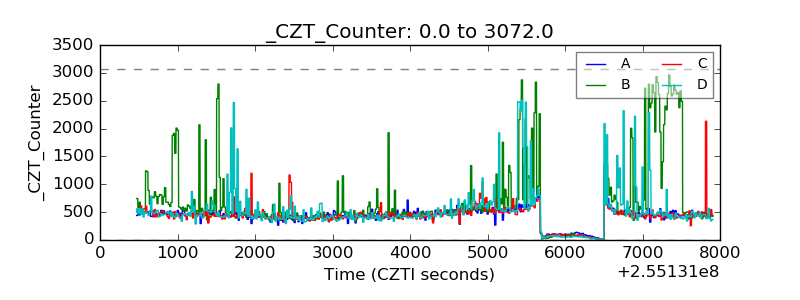 |
| +2.5 Volts monitor |  |
| +5 Volts monitor |  |
| _ROLL_ROT | 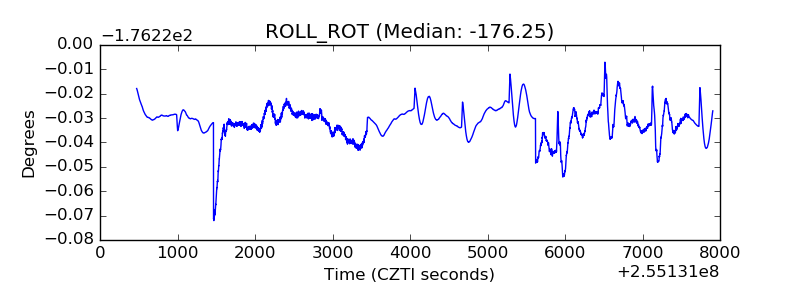 |
| _Roll_DEC | 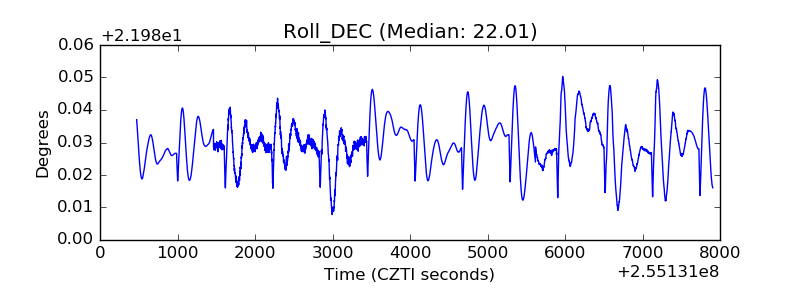 |
| _Roll_RA | 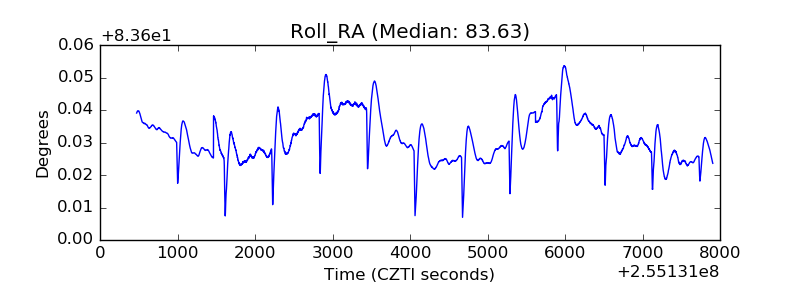 |
| Veto Counter | 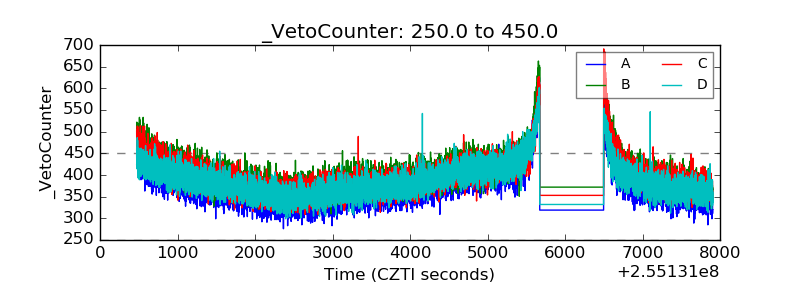 |