| Param | Original file | Final file |
|---|---|---|
| Filename | modeM0/AS1A04_174T01_9000001876_12683cztM0_level2.evt | modeM0/AS1A04_174T01_9000001876_12683cztM0_level2_quad_clean.evt |
| Size (bytes) | 566,015,040 | 99,999,360 |
| Size | 539.8 MB | 95.4 MB |
| Events in quadrant A | 3,487,800 | 661,754 |
| Events in quadrant B | 5,766,752 | 581,485 |
| Events in quadrant C | 3,412,602 | 660,374 |
| Events in quadrant D | 3,985,824 | 622,814 |
| Mode M9 | |||
|---|---|---|---|
| Quadrant | BADHDUFLAG | Total packets | Discarded packets |
| A | 0 | 4 | 0 |
| B | 0 | 4 | 0 |
| C | 0 | 4 | 0 |
| D | 0 | 5 | 0 |
| Mode M0 | |||
|---|---|---|---|
| Quadrant | BADHDUFLAG | Total packets | Discarded packets |
| A | 0 | 15150 | 3 |
| B | 0 | 21968 | 2 |
| C | 0 | 14958 | 2 |
| D | 0 | 16941 | 2 |
| Mode SS | |||
|---|---|---|---|
| Quadrant | BADHDUFLAG | Total packets | Discarded packets |
| A | 0 | 146 | 0 |
| B | 0 | 146 | 0 |
| C | 0 | 146 | 0 |
| D | 0 | 146 | 0 |
| Quadrant | Total seconds | Saturated seconds | Saturation percentage |
|---|---|---|---|
| A | 7203 | 39 | 0.541441% |
| B | 7203 | 973 | 13.508260% |
| C | 7203 | 15 | 0.208247% |
| D | 7203 | 197 | 2.734972% |
Noise dominated data is calculated using 1-second bins in cleaned event files. If a bin has >2000 counts, and if more than 50% of those come from <1% of pixels, then it is considered to be noise-dominated and hence unusable.
| Quadrant | # 1 sec bins | Bins with >0 counts | Bins with >2000 counts | High rate bins dominated by noise | Noise dominated (total time) | Noise dominated (detector-on time) | Marked lightcurve |
|---|---|---|---|---|---|---|---|
| A | 7644 | 7204 | 3 | 3 | 0.04% | 0.04% | 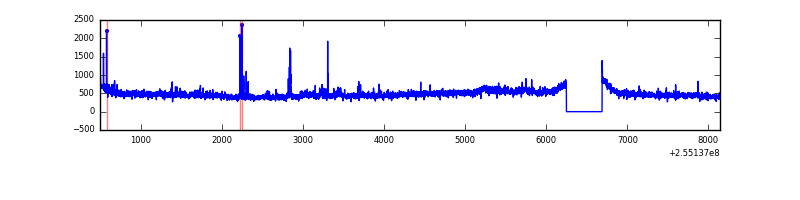 |
| B | 7644 | 7204 | 811 | 811 | 10.61% | 11.26% | 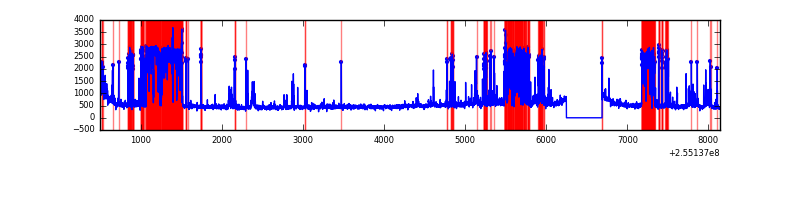 |
| C | 7644 | 7204 | 12 | 12 | 0.16% | 0.17% |  |
| D | 7644 | 7204 | 169 | 169 | 2.21% | 2.35% | 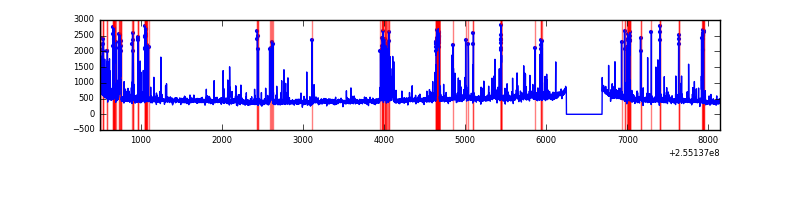 |
Top three noisy pixels from each quadrant. If the there are fewer than three noisy pixels in the level2.evt file, extra rows are filled as -1
| Pixel properties | Quadrant properties | ||||||
|---|---|---|---|---|---|---|---|
| Quadrant | DetID | PixID | Counts | Sigma | Mean | Median | Sigma |
| A | 12 | 189 | 95336 | 527.47 | 868 | 849 | 179.1 |
| A | 9 | 143 | 49047 | 269.07 | 868 | 849 | 179.1 |
| A | 0 | 226 | 7698 | 38.23 | 868 | 849 | 179.1 |
| B | 4 | 239 | 2375928 | 15389.99 | 806 | 787 | 154.3 |
| B | 3 | 64 | 81007 | 519.79 | 806 | 787 | 154.3 |
| B | 11 | 51 | 43055 | 273.88 | 806 | 787 | 154.3 |
| C | 15 | 208 | 107999 | 543.0 | 846 | 853 | 197.3 |
| C | 13 | 61 | 6082 | 26.5 | 846 | 853 | 197.3 |
| C | 14 | 234 | 5243 | 22.25 | 846 | 853 | 197.3 |
| D | 1 | 52 | 483652 | 2405.61 | 827 | 810 | 200.7 |
| D | 13 | 104 | 244851 | 1215.86 | 827 | 810 | 200.7 |
| D | 8 | 195 | 39685 | 193.68 | 827 | 810 | 200.7 |
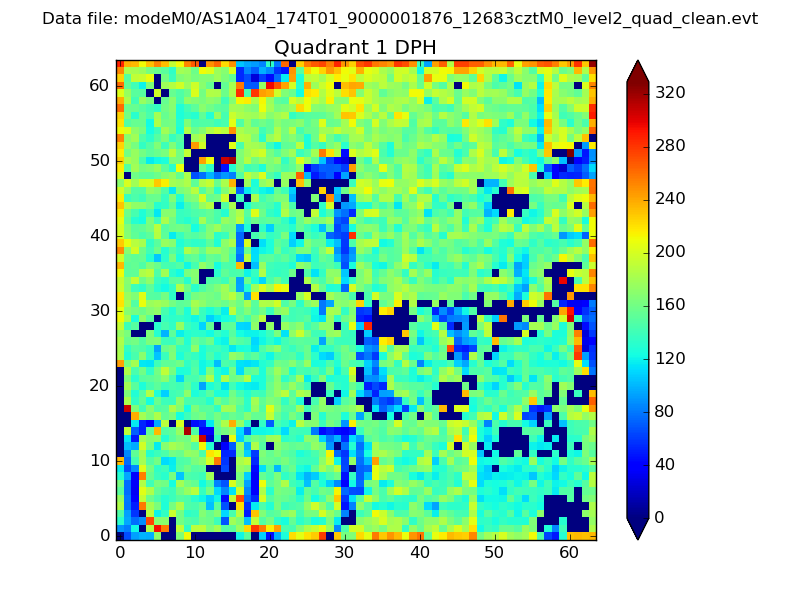
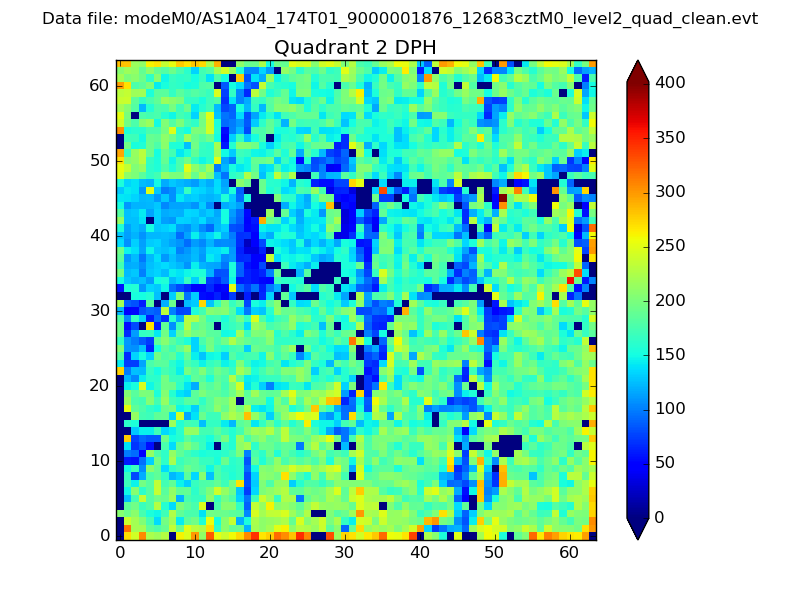
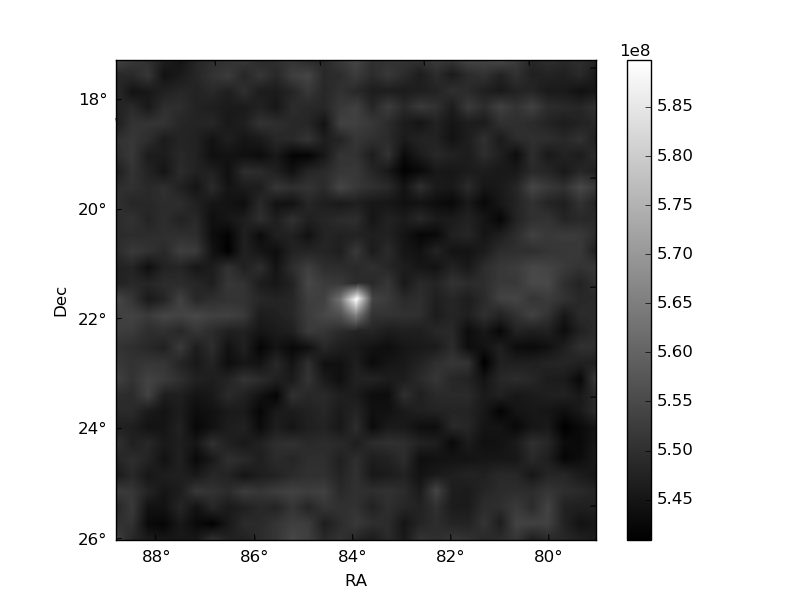
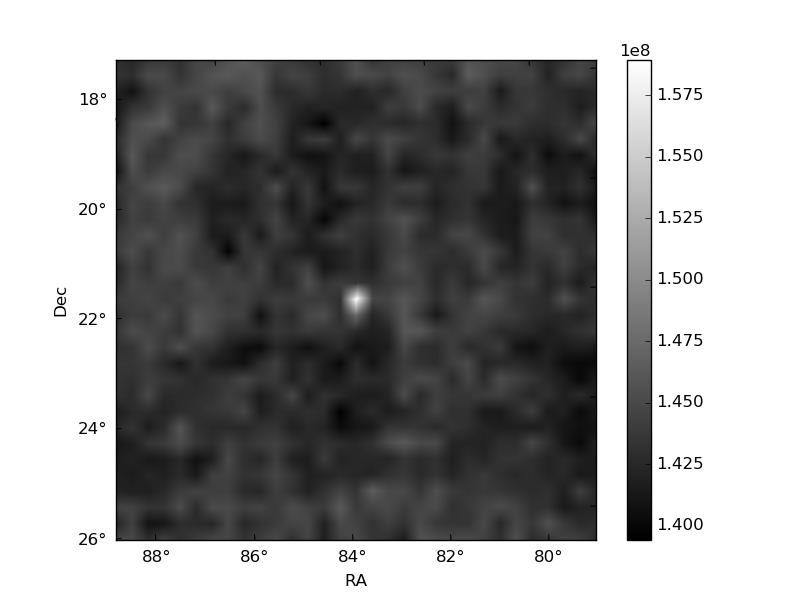
Histogram calculated using DETX and DETY for each event in the final _common_clean file
| Quadrant A | 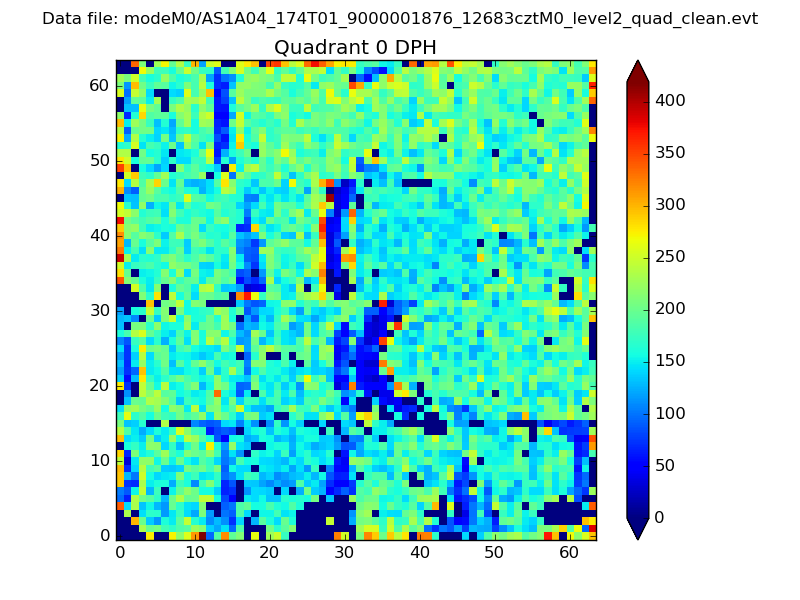 |
 |
Quadrant B |
|---|---|---|---|
| Quadrant D | 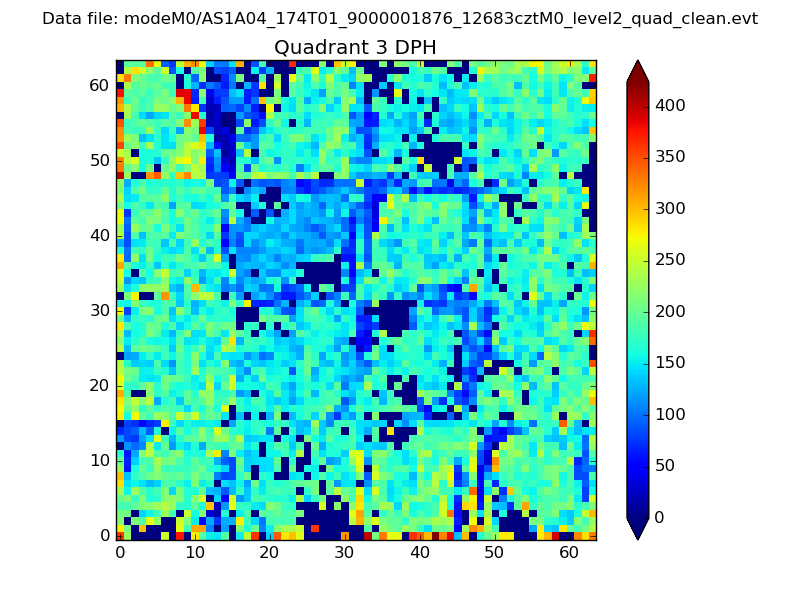 |
 |
Quadrant C |
| Plot type | Count rate plots | Images |
|---|---|---|
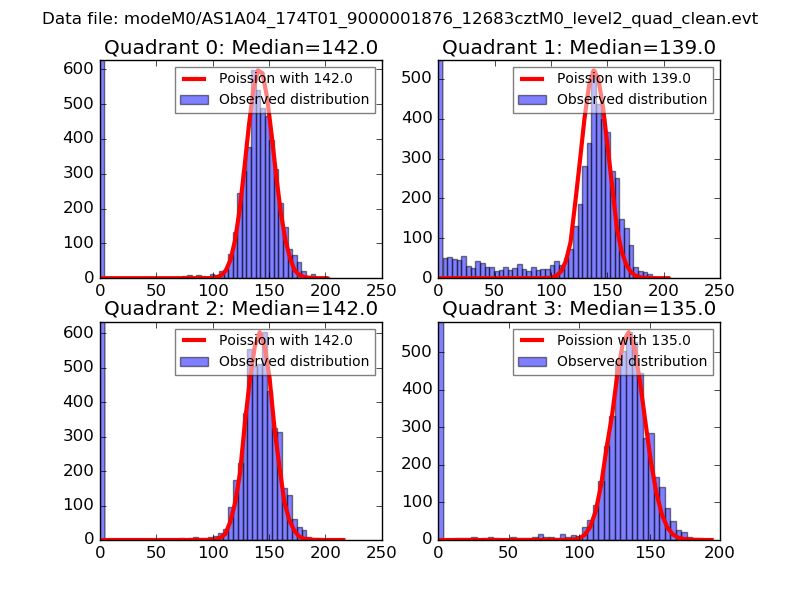
| Comparison with Poisson distribution Blue bars denote a histogram of data divided into 1 sec bins. Red curve is a Poisson curve with rate = median count rate of data. |
 |
 |
| Quadrant-wise count rates Data is divided into 100 sec bins |
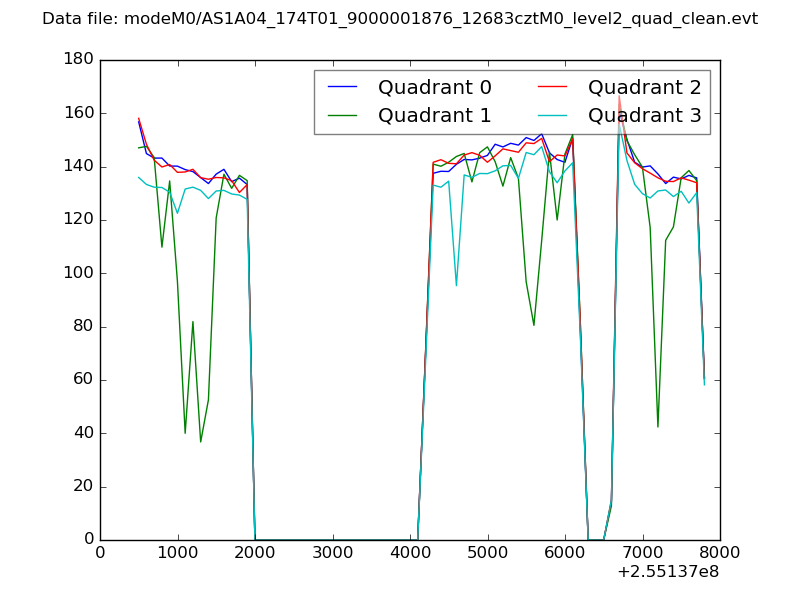 |
|
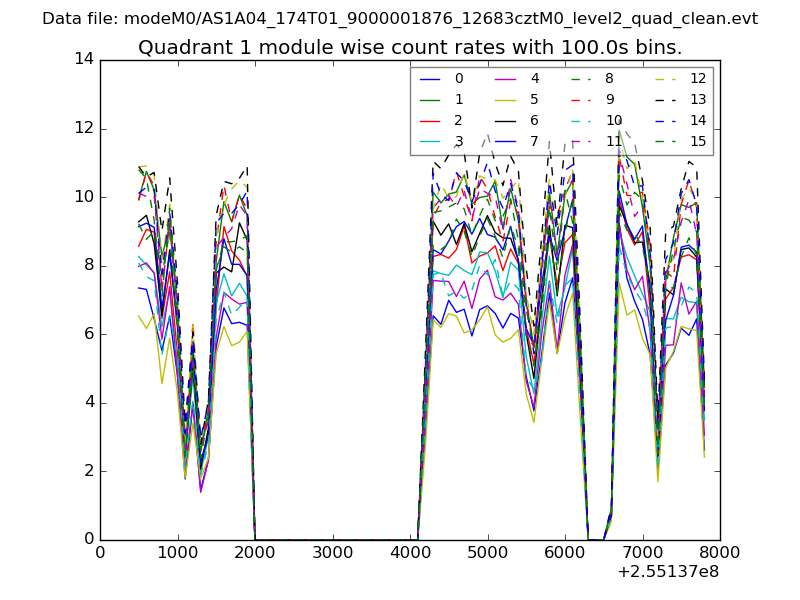
| Module-wise count rates for Quadrant A Data is divided into 100 sec bins |
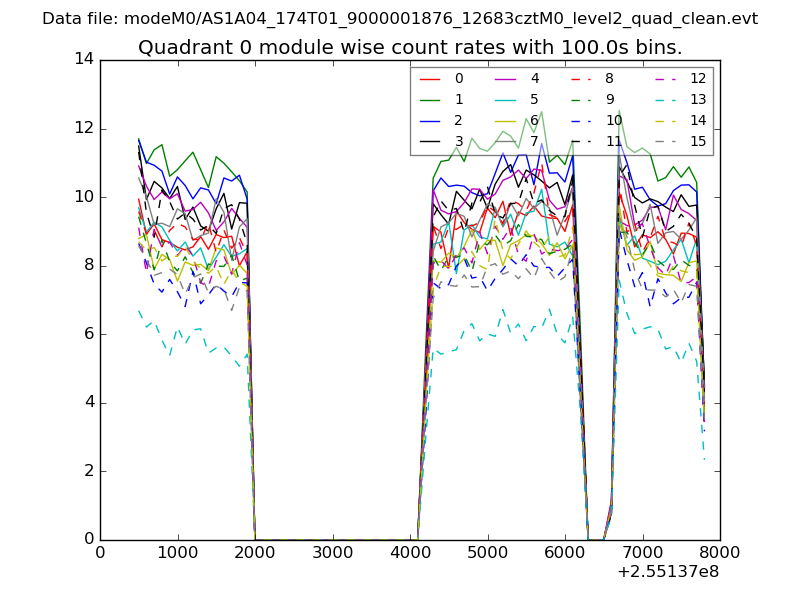 |
 |
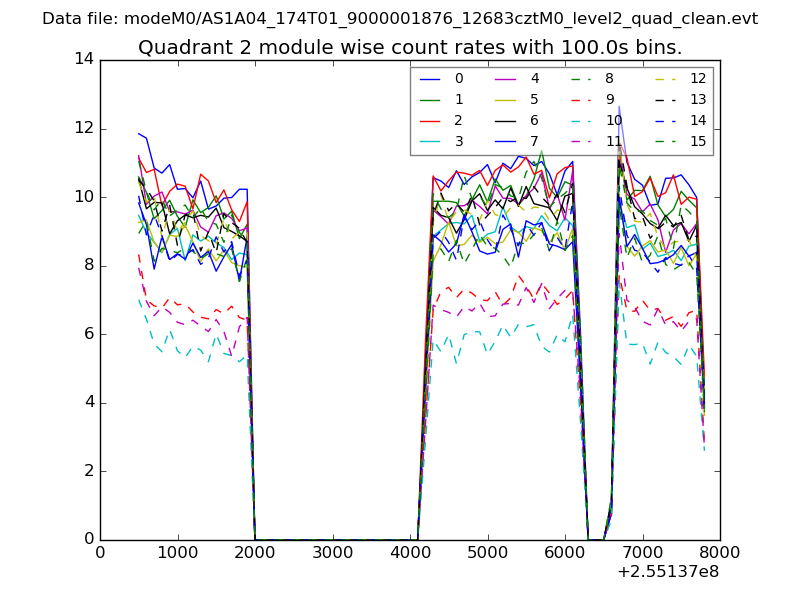
| Module-wise count rates for Quadrant B Data is divided into 100 sec bins |
 |
 |
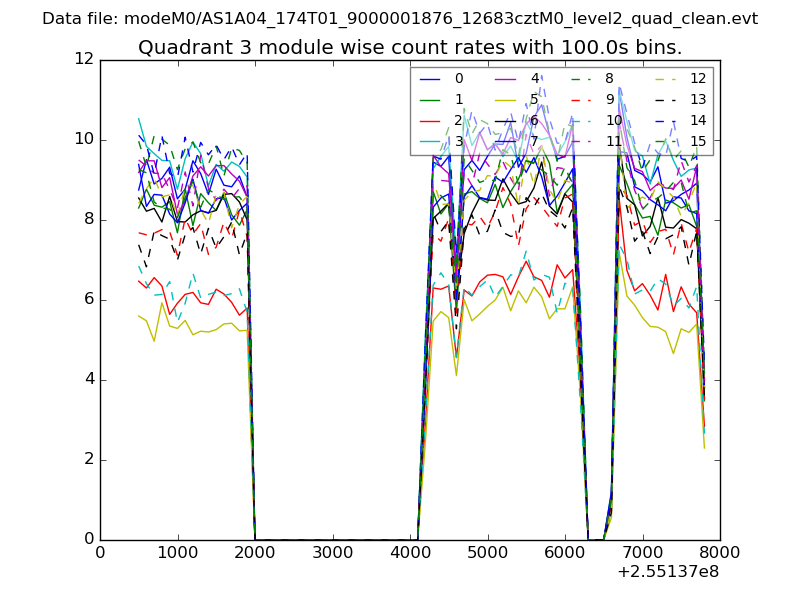
| Module-wise count rates for Quadrant C Data is divided into 100 sec bins |
 |
 |
| Module-wise count rates for Quadrant D Data is divided into 100 sec bins |
 |
 |
| Parameter | Plot |
|---|---|
| CZT HV Monitor | 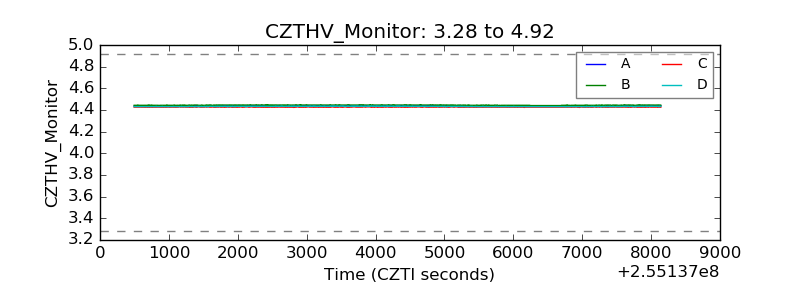 |
| D_VDD | 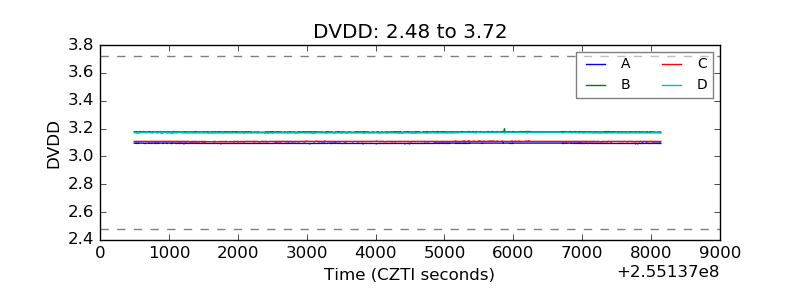 |
| Temperature 1 | 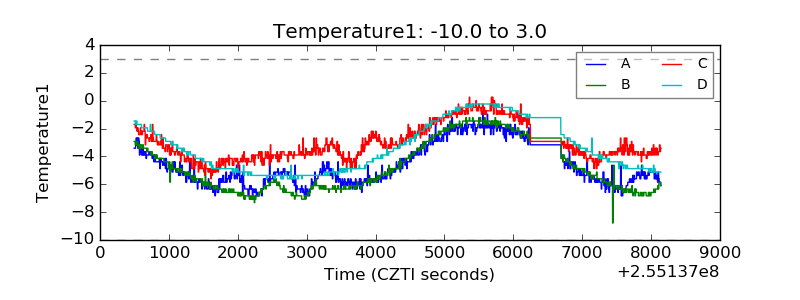 |
| Veto HV Monitor | 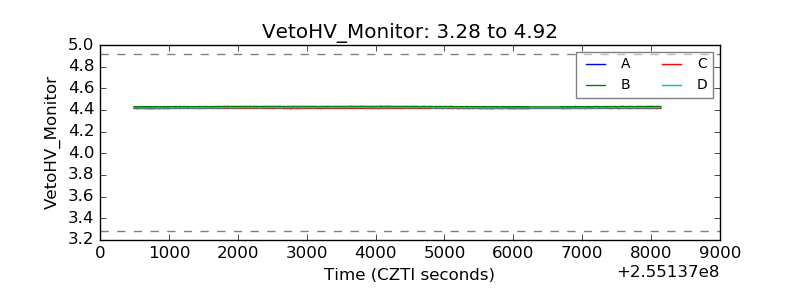 |
| Veto LLD | 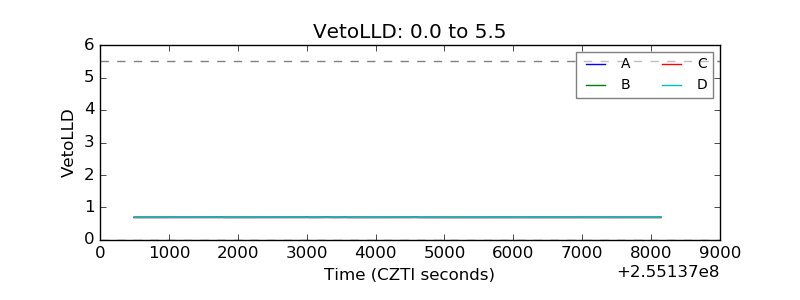 |
| Alpha Counter | 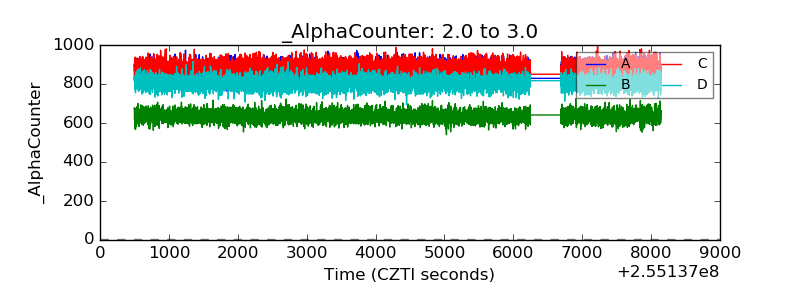 |
| _CPM_Rate | 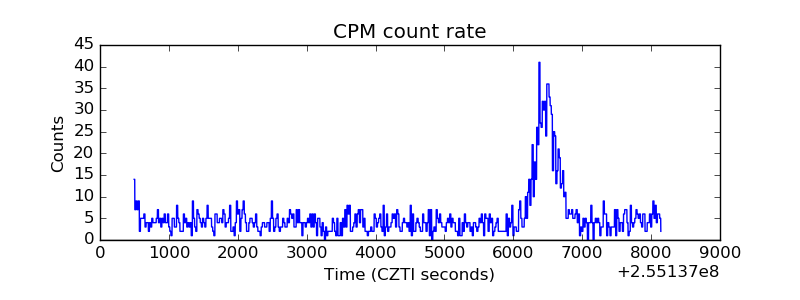 |
| CZT Counter |  |
| +2.5 Volts monitor | 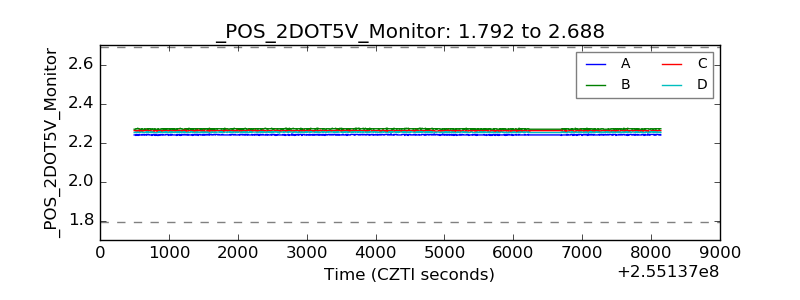 |
| +5 Volts monitor |  |
| _ROLL_ROT | 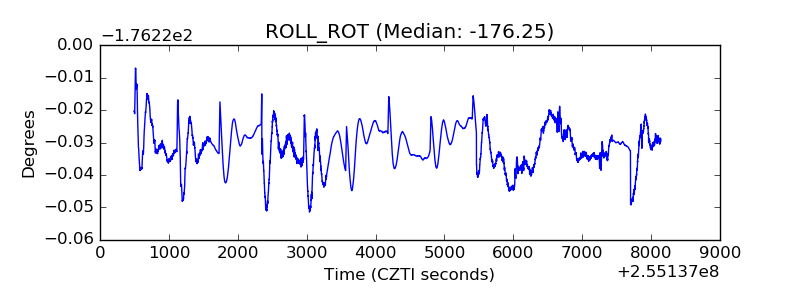 |
| _Roll_DEC | 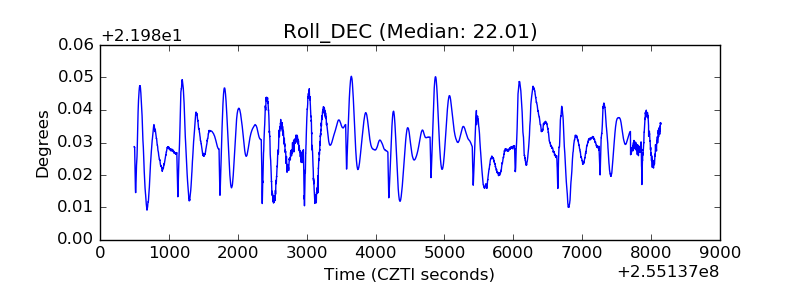 |
| _Roll_RA | 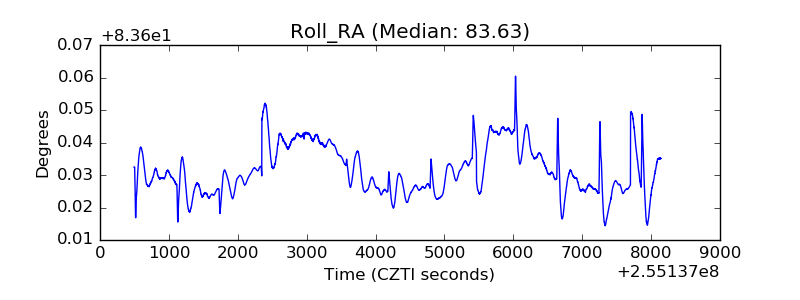 |
| Veto Counter | 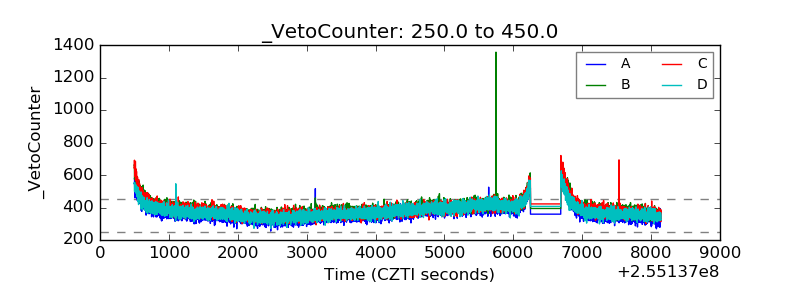 |