| Param | Original file | Final file |
|---|---|---|
| Filename | modeM0/AS1A04_174T01_9000001876_12684cztM0_level2.evt | modeM0/AS1A04_174T01_9000001876_12684cztM0_level2_quad_clean.evt |
| Size (bytes) | 507,542,400 | 85,507,200 |
| Size | 484.0 MB | 81.5 MB |
| Events in quadrant A | 3,189,597 | 545,973 |
| Events in quadrant B | 4,967,576 | 503,735 |
| Events in quadrant C | 3,188,462 | 545,389 |
| Events in quadrant D | 3,560,785 | 517,461 |
| Mode M9 | |||
|---|---|---|---|
| Quadrant | BADHDUFLAG | Total packets | Discarded packets |
| A | 0 | 3 | 0 |
| B | 0 | 3 | 0 |
| C | 0 | 3 | 0 |
| D | 0 | 3 | 0 |
| Mode M0 | |||
|---|---|---|---|
| Quadrant | BADHDUFLAG | Total packets | Discarded packets |
| A | 0 | 14053 | 2 |
| B | 0 | 19205 | 1 |
| C | 0 | 14104 | 1 |
| D | 0 | 15431 | 1 |
| Mode SS | |||
|---|---|---|---|
| Quadrant | BADHDUFLAG | Total packets | Discarded packets |
| A | 0 | 140 | 0 |
| B | 0 | 140 | 0 |
| C | 0 | 140 | 0 |
| D | 0 | 140 | 0 |
| Quadrant | Total seconds | Saturated seconds | Saturation percentage |
|---|---|---|---|
| A | 6834 | 44 | 0.643840% |
| B | 6834 | 625 | 9.145449% |
| C | 6834 | 23 | 0.336553% |
| D | 6834 | 152 | 2.224173% |
Noise dominated data is calculated using 1-second bins in cleaned event files. If a bin has >2000 counts, and if more than 50% of those come from <1% of pixels, then it is considered to be noise-dominated and hence unusable.
| Quadrant | # 1 sec bins | Bins with >0 counts | Bins with >2000 counts | High rate bins dominated by noise | Noise dominated (total time) | Noise dominated (detector-on time) | Marked lightcurve |
|---|---|---|---|---|---|---|---|
| A | 7144 | 6834 | 0 | 0 | 0.00% | 0.00% | 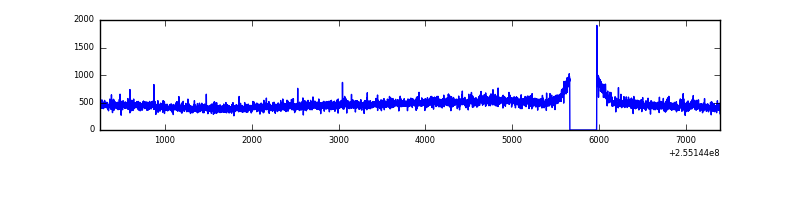 |
| B | 7145 | 6835 | 463 | 463 | 6.48% | 6.77% | 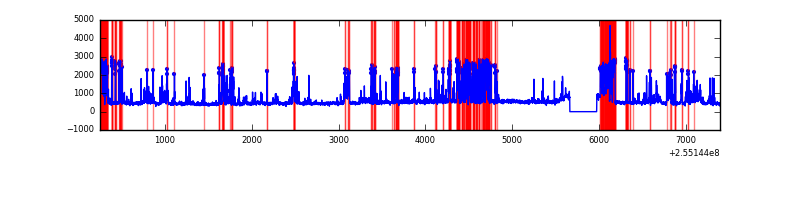 |
| C | 7144 | 6834 | 4 | 4 | 0.06% | 0.06% | 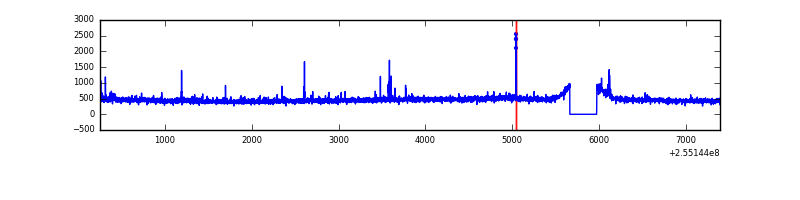 |
| D | 7145 | 6835 | 137 | 137 | 1.92% | 2.00% | 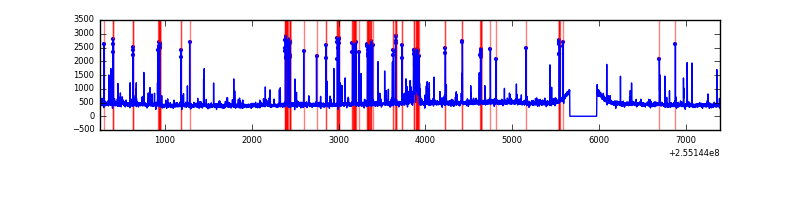 |
Top three noisy pixels from each quadrant. If the there are fewer than three noisy pixels in the level2.evt file, extra rows are filled as -1
| Pixel properties | Quadrant properties | ||||||
|---|---|---|---|---|---|---|---|
| Quadrant | DetID | PixID | Counts | Sigma | Mean | Median | Sigma |
| A | 12 | 189 | 36626 | 212.21 | 816 | 800 | 168.8 |
| A | 8 | 15 | 13954 | 77.91 | 816 | 800 | 168.8 |
| A | 0 | 226 | 7231 | 38.09 | 816 | 800 | 168.8 |
| B | 4 | 239 | 1720288 | 11493.81 | 779 | 762 | 149.6 |
| B | 3 | 64 | 43054 | 282.69 | 779 | 762 | 149.6 |
| B | 0 | 214 | 36715 | 240.32 | 779 | 762 | 149.6 |
| C | 15 | 208 | 68389 | 364.04 | 796 | 802 | 185.7 |
| C | 14 | 234 | 10813 | 53.92 | 796 | 802 | 185.7 |
| C | 13 | 61 | 5867 | 27.28 | 796 | 802 | 185.7 |
| D | 1 | 52 | 445084 | 2379.47 | 778 | 760 | 186.7 |
| D | 10 | 199 | 106760 | 567.65 | 778 | 760 | 186.7 |
| D | 2 | 234 | 26367 | 137.13 | 778 | 760 | 186.7 |
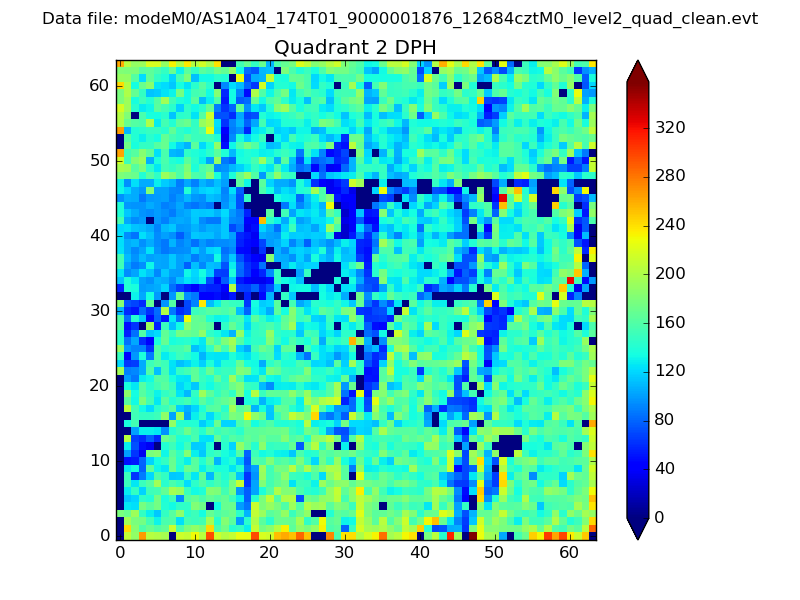
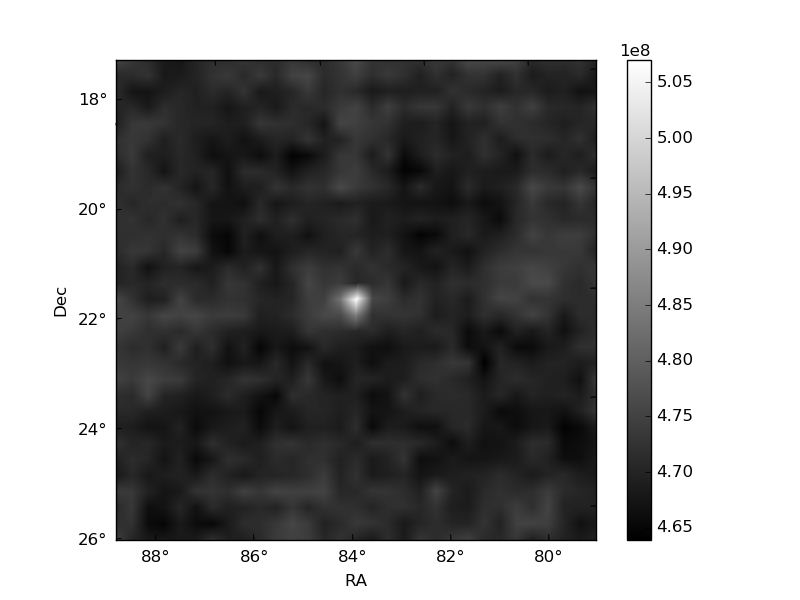
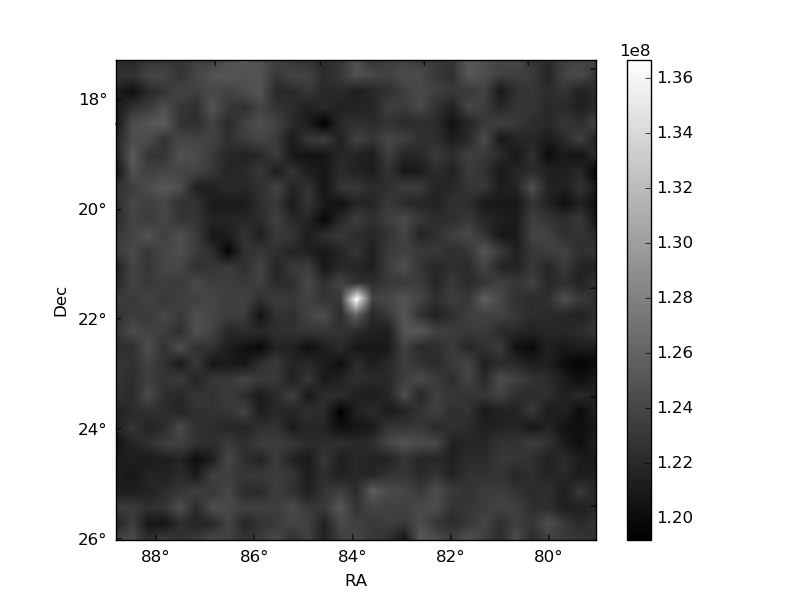
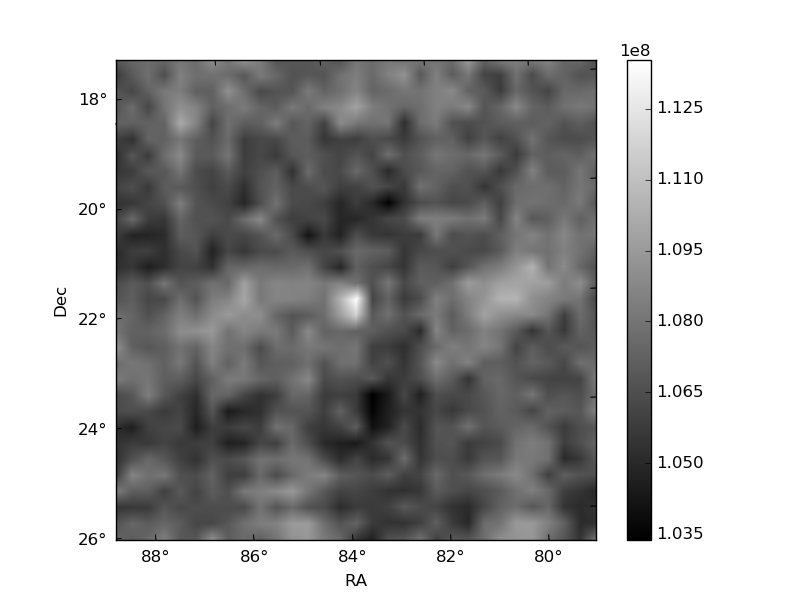
Histogram calculated using DETX and DETY for each event in the final _common_clean file
| Quadrant A | 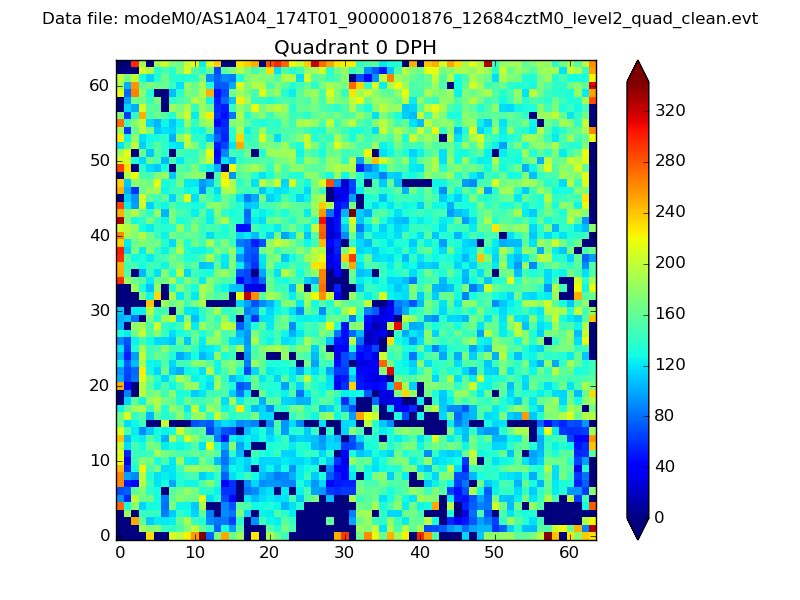 |
 |
Quadrant B |
|---|---|---|---|
| Quadrant D | 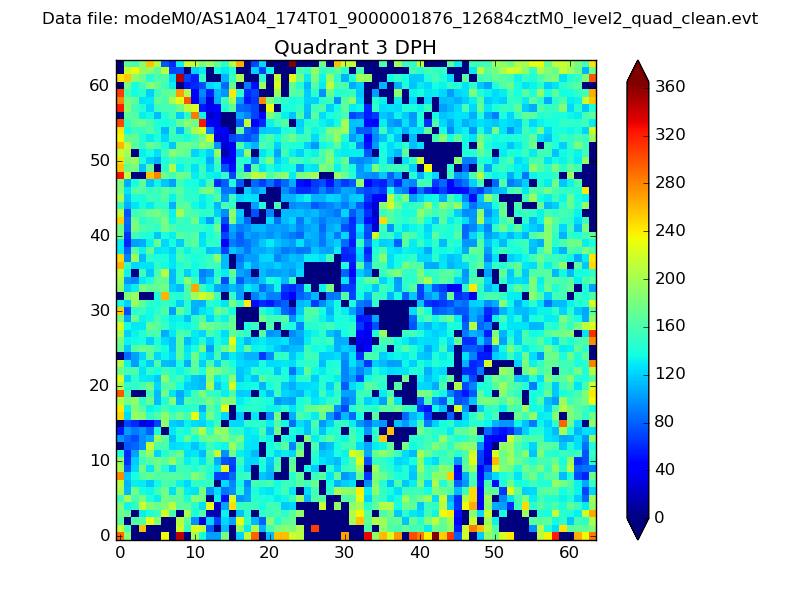 |
 |
Quadrant C |
| Plot type | Count rate plots | Images |
|---|---|---|
| Comparison with Poisson distribution Blue bars denote a histogram of data divided into 1 sec bins. Red curve is a Poisson curve with rate = median count rate of data. |
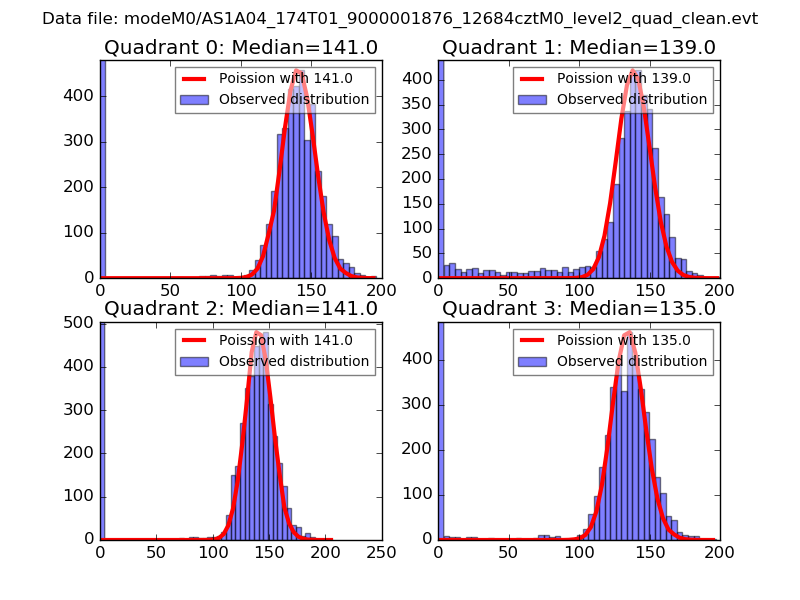 |
 |
| Quadrant-wise count rates Data is divided into 100 sec bins |
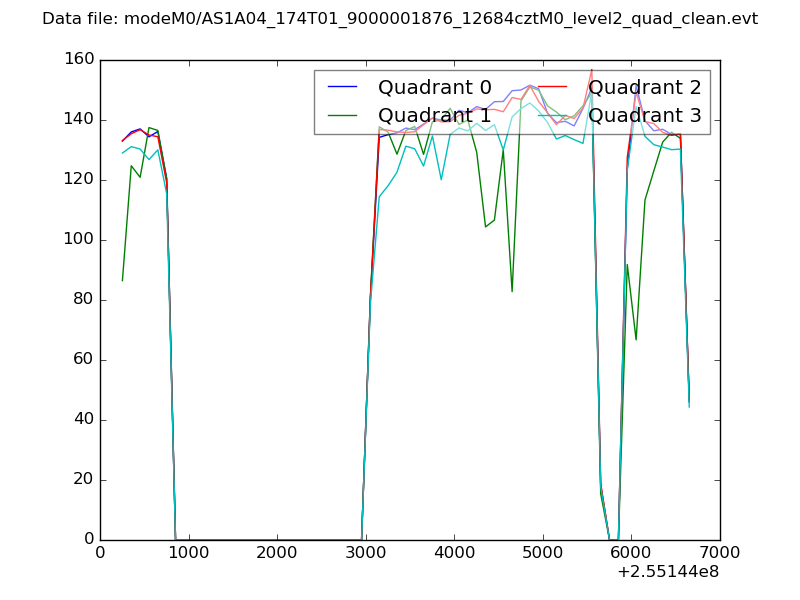 |
|
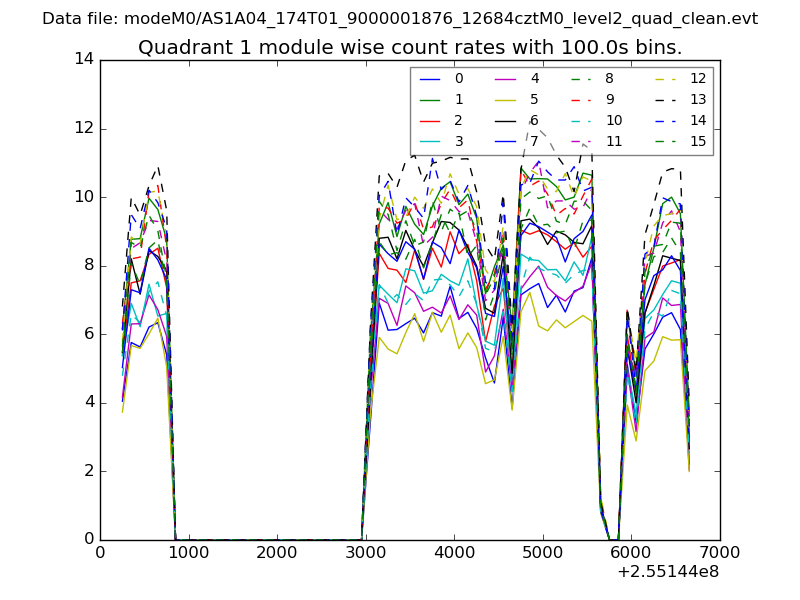
| Module-wise count rates for Quadrant A Data is divided into 100 sec bins |
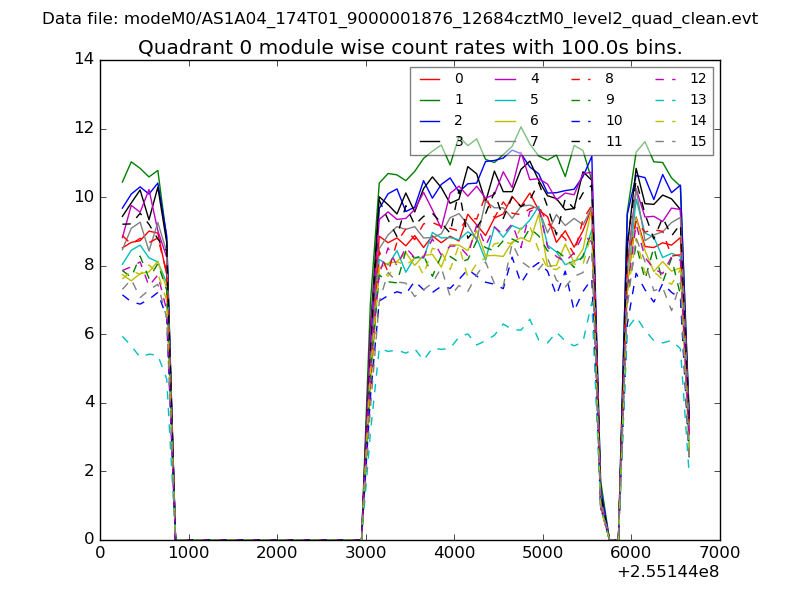 |
 |
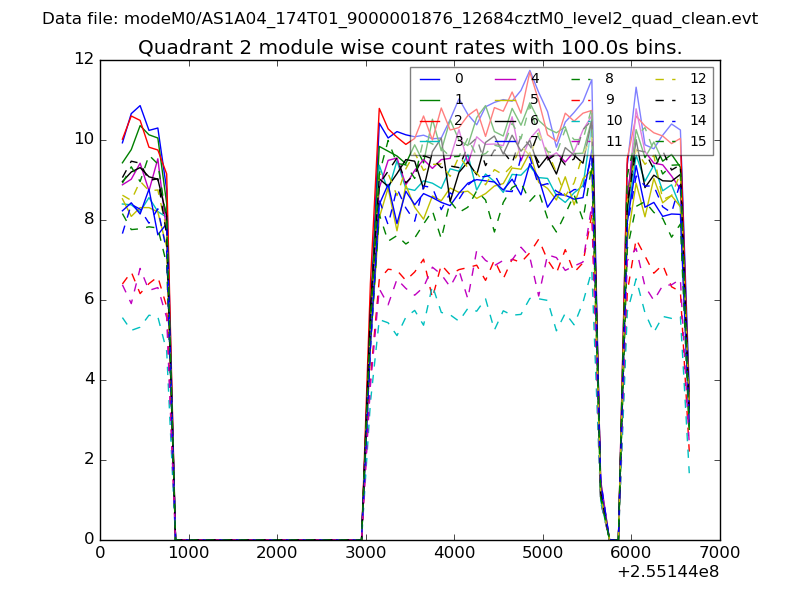
| Module-wise count rates for Quadrant B Data is divided into 100 sec bins |
 |
 |
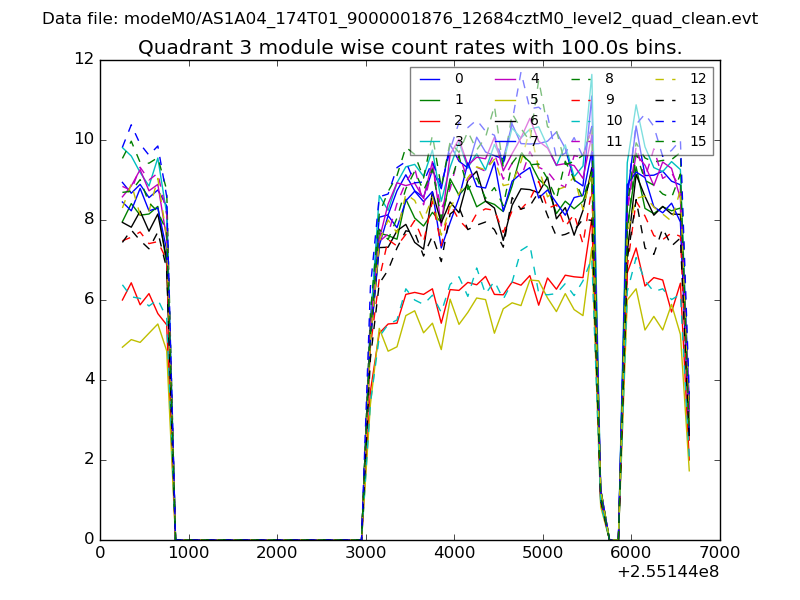
| Module-wise count rates for Quadrant C Data is divided into 100 sec bins |
 |
 |
| Module-wise count rates for Quadrant D Data is divided into 100 sec bins |
 |
 |
| Parameter | Plot |
|---|---|
| CZT HV Monitor | 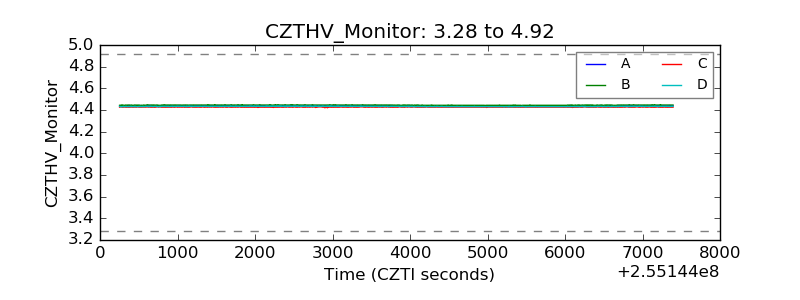 |
| D_VDD | 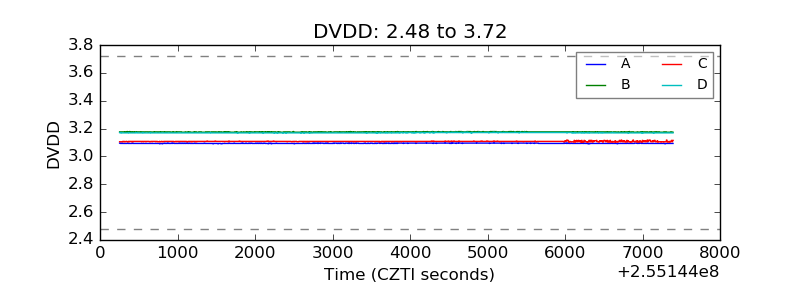 |
| Temperature 1 | 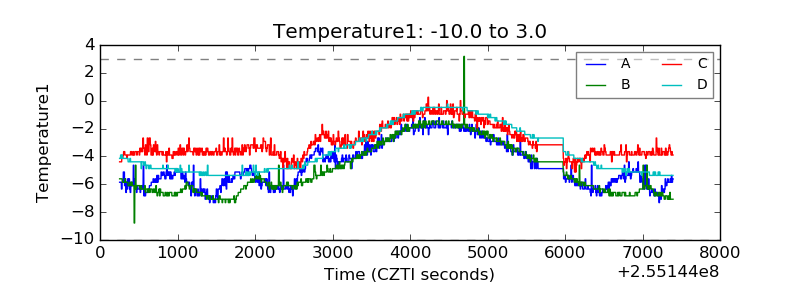 |
| Veto HV Monitor | 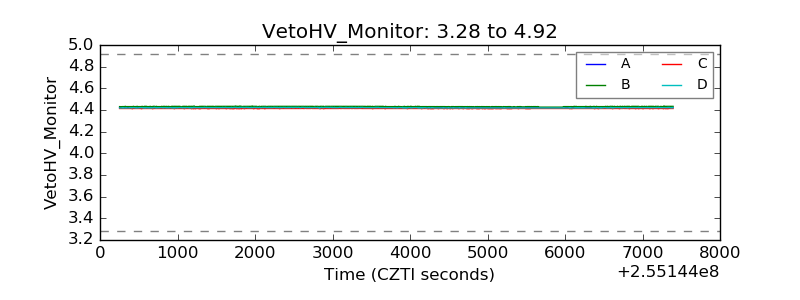 |
| Veto LLD | 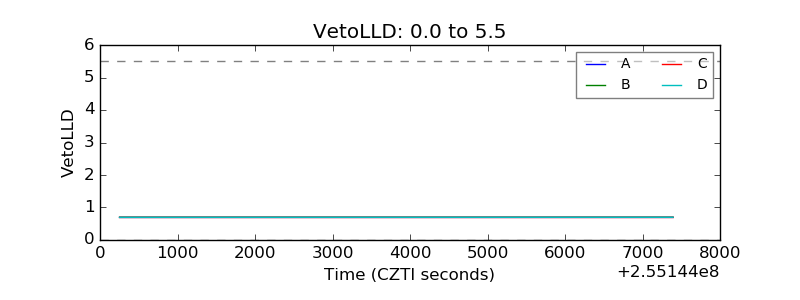 |
| Alpha Counter | 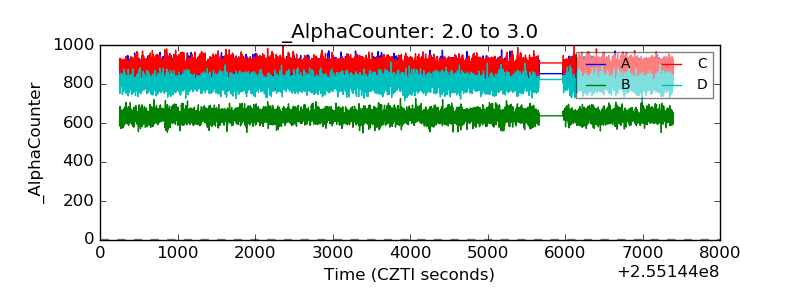 |
| _CPM_Rate | 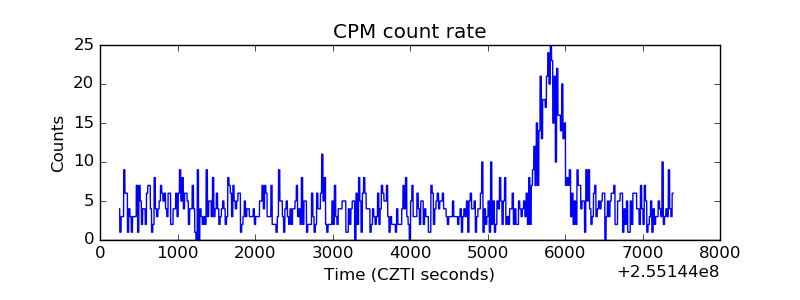 |
| CZT Counter | 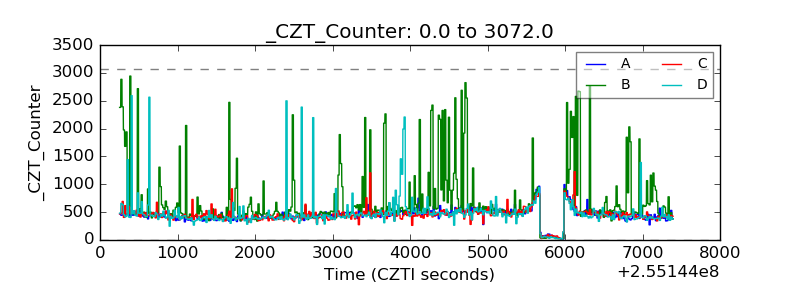 |
| +2.5 Volts monitor | 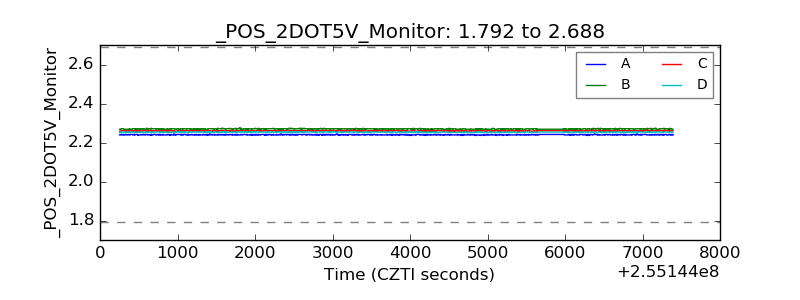 |
| +5 Volts monitor |  |
| _ROLL_ROT | 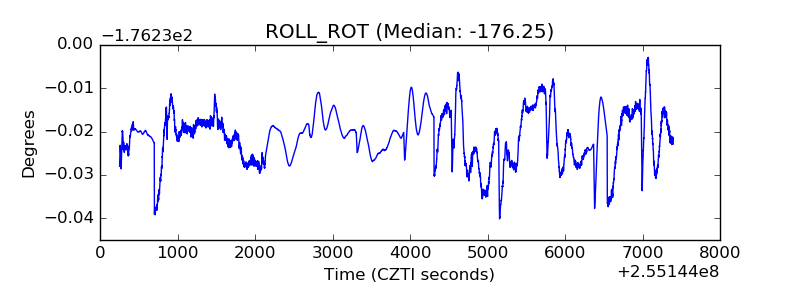 |
| _Roll_DEC | 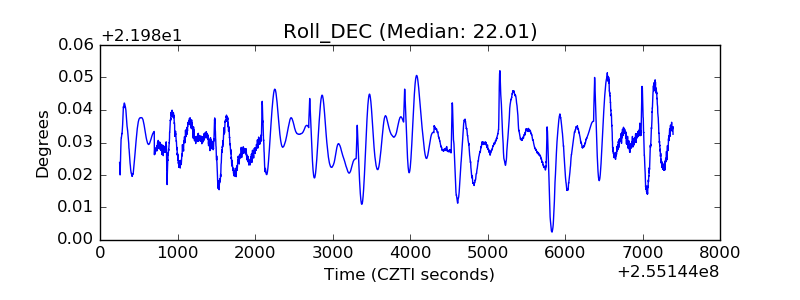 |
| _Roll_RA |  |
| Veto Counter | 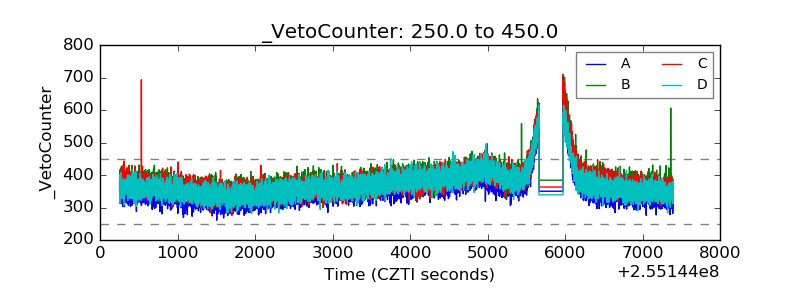 |