| Param | Original file | Final file |
|---|---|---|
| Filename | modeM0/AS1A04_174T01_9000001876_12687cztM0_level2.evt | modeM0/AS1A04_174T01_9000001876_12687cztM0_level2_quad_clean.evt |
| Size (bytes) | 1,006,292,160 | 153,840,960 |
| Size | 959.7 MB | 146.7 MB |
| Events in quadrant A | 6,151,674 | 982,139 |
| Events in quadrant B | 9,899,047 | 866,944 |
| Events in quadrant C | 6,142,638 | 985,619 |
| Events in quadrant D | 7,405,202 | 927,863 |
| Mode M9 | |||
|---|---|---|---|
| Quadrant | BADHDUFLAG | Total packets | Discarded packets |
| A | 0 | 16 | 0 |
| B | 0 | 16 | 0 |
| C | 0 | 16 | 0 |
| D | 0 | 17 | 0 |
| Mode M0 | |||
|---|---|---|---|
| Quadrant | BADHDUFLAG | Total packets | Discarded packets |
| A | 0 | 26613 | 4 |
| B | 0 | 37666 | 3 |
| C | 0 | 26886 | 3 |
| D | 0 | 30884 | 3 |
| Mode SS | |||
|---|---|---|---|
| Quadrant | BADHDUFLAG | Total packets | Discarded packets |
| A | 0 | 262 | 0 |
| B | 0 | 262 | 0 |
| C | 0 | 262 | 0 |
| D | 0 | 262 | 0 |
| Quadrant | Total seconds | Saturated seconds | Saturation percentage |
|---|---|---|---|
| A | 12969 | 150 | 1.156604% |
| B | 12969 | 1527 | 11.774231% |
| C | 12969 | 119 | 0.917573% |
| D | 12969 | 423 | 3.261624% |
Noise dominated data is calculated using 1-second bins in cleaned event files. If a bin has >2000 counts, and if more than 50% of those come from <1% of pixels, then it is considered to be noise-dominated and hence unusable.
| Quadrant | # 1 sec bins | Bins with >0 counts | Bins with >2000 counts | High rate bins dominated by noise | Noise dominated (total time) | Noise dominated (detector-on time) | Marked lightcurve |
|---|---|---|---|---|---|---|---|
| A | 14198 | 12969 | 1 | 1 | 0.01% | 0.01% | 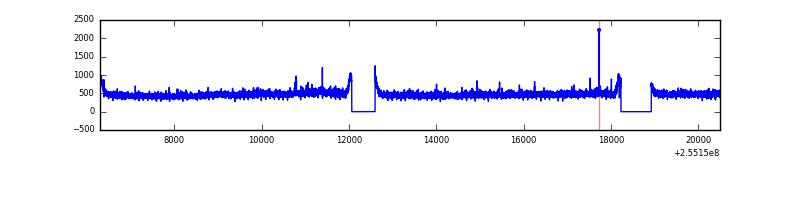 |
| B | 14199 | 12969 | 1150 | 1150 | 8.10% | 8.87% | 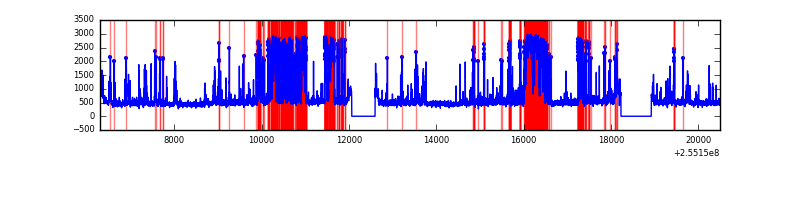 |
| C | 14198 | 12968 | 14 | 14 | 0.10% | 0.11% |  |
| D | 14198 | 12968 | 305 | 305 | 2.15% | 2.35% | 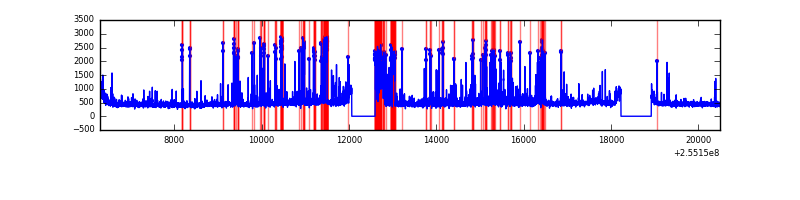 |
Top three noisy pixels from each quadrant. If the there are fewer than three noisy pixels in the level2.evt file, extra rows are filled as -1
| Pixel properties | Quadrant properties | ||||||
|---|---|---|---|---|---|---|---|
| Quadrant | DetID | PixID | Counts | Sigma | Mean | Median | Sigma |
| A | 12 | 189 | 90807 | 280.39 | 1569 | 1535 | 318.4 |
| A | 8 | 15 | 16525 | 47.08 | 1569 | 1535 | 318.4 |
| A | 0 | 226 | 13996 | 39.14 | 1569 | 1535 | 318.4 |
| B | 4 | 239 | 3788031 | 13355.76 | 1479 | 1444 | 283.5 |
| B | 11 | 51 | 159878 | 558.82 | 1479 | 1444 | 283.5 |
| B | 0 | 214 | 38002 | 128.94 | 1479 | 1444 | 283.5 |
| C | 15 | 208 | 157131 | 438.73 | 1530 | 1545 | 354.6 |
| C | 14 | 234 | 18956 | 49.1 | 1530 | 1545 | 354.6 |
| C | 13 | 61 | 11248 | 27.36 | 1530 | 1545 | 354.6 |
| D | 1 | 52 | 1434203 | 4035.28 | 1493 | 1462 | 355.1 |
| D | 10 | 199 | 124313 | 346.01 | 1493 | 1462 | 355.1 |
| D | 10 | 157 | 54430 | 149.18 | 1493 | 1462 | 355.1 |
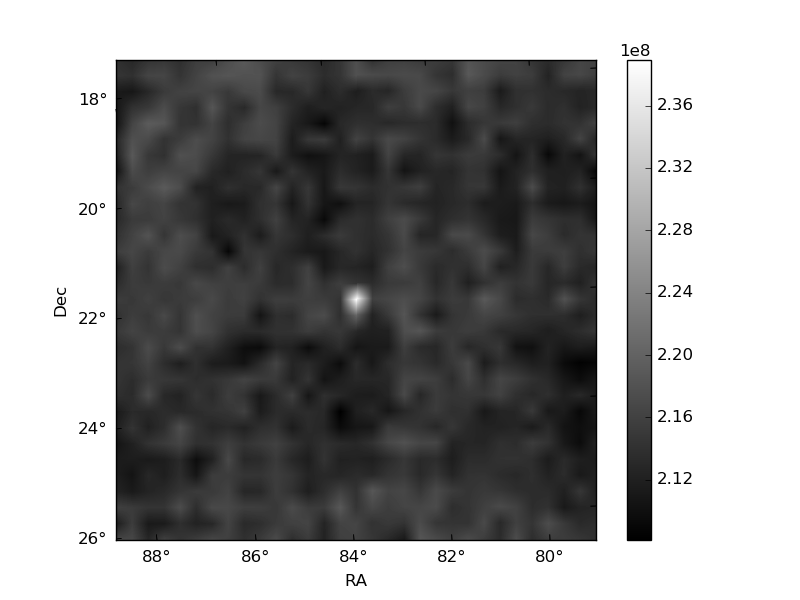
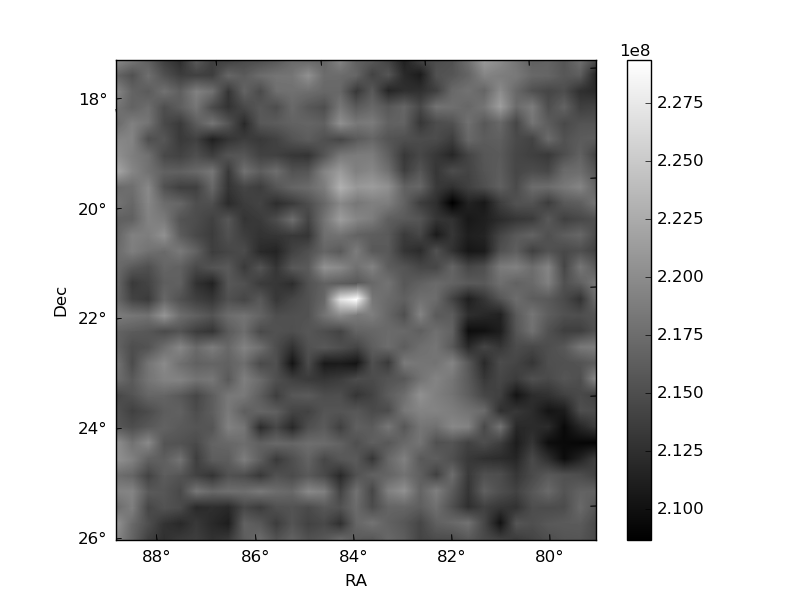
Histogram calculated using DETX and DETY for each event in the final _common_clean file
| Quadrant A | 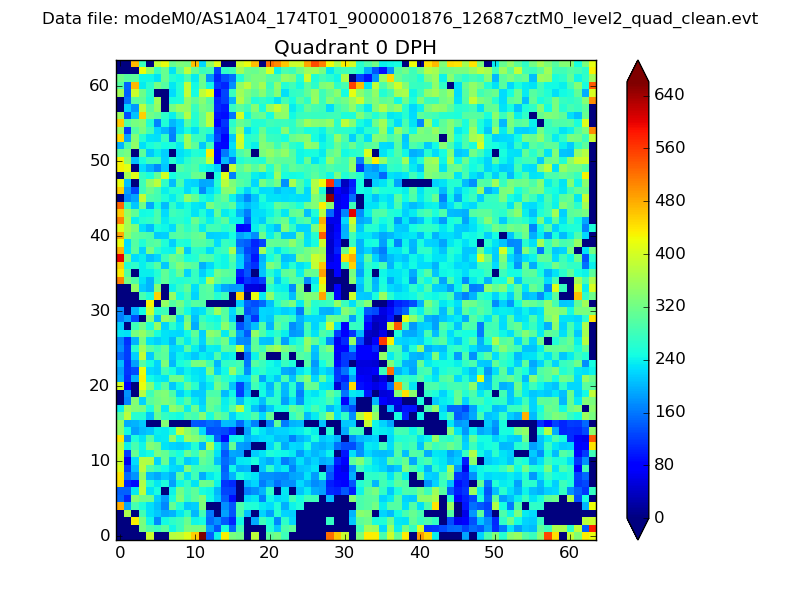 |
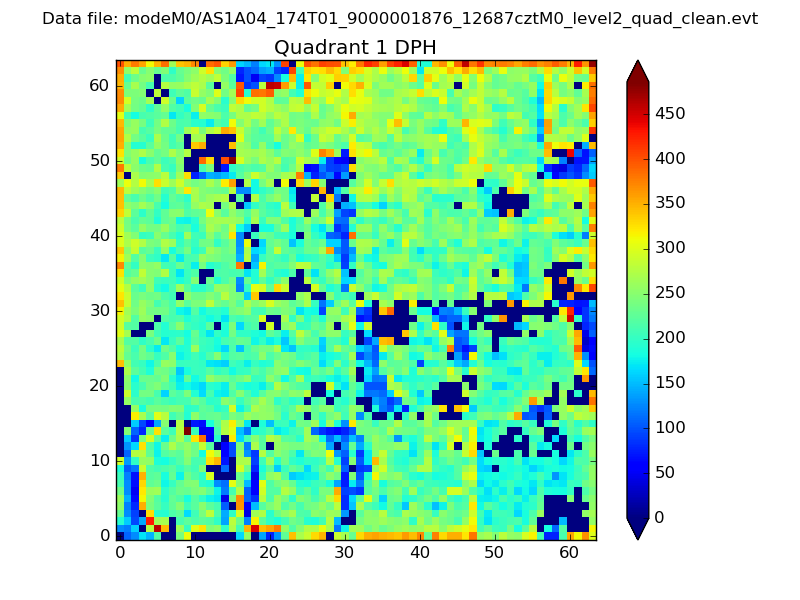 |
Quadrant B |
|---|---|---|---|
| Quadrant D |  |
 |
Quadrant C |
| Plot type | Count rate plots | Images |
|---|---|---|
| Comparison with Poisson distribution Blue bars denote a histogram of data divided into 1 sec bins. Red curve is a Poisson curve with rate = median count rate of data. |
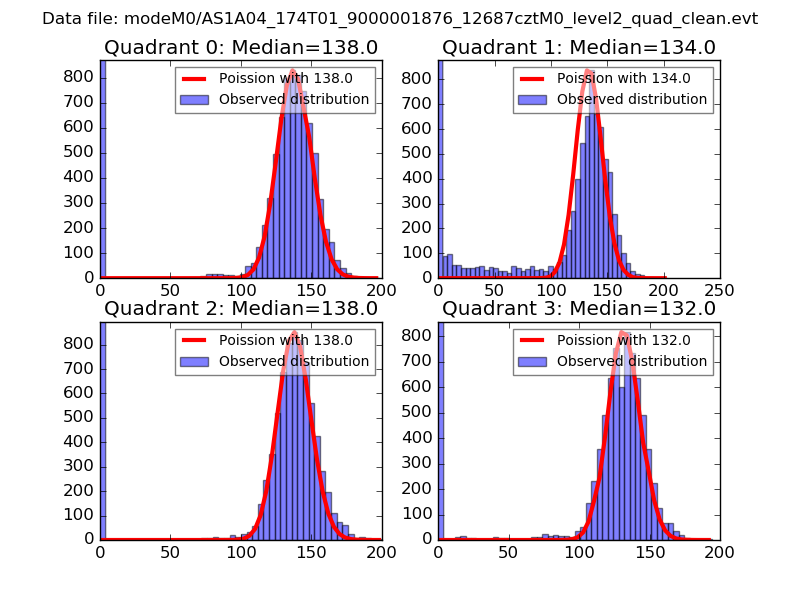 |
 |
| Quadrant-wise count rates Data is divided into 100 sec bins |
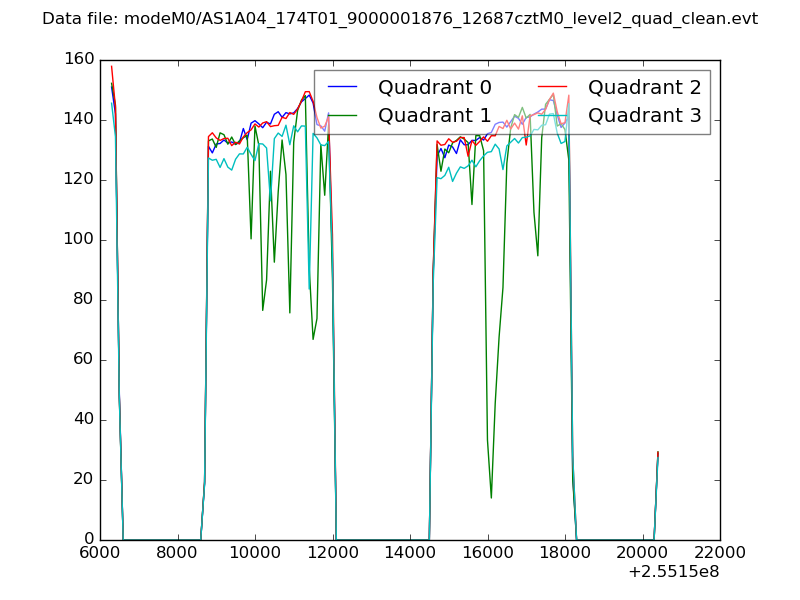 |
|
| Module-wise count rates for Quadrant A Data is divided into 100 sec bins |
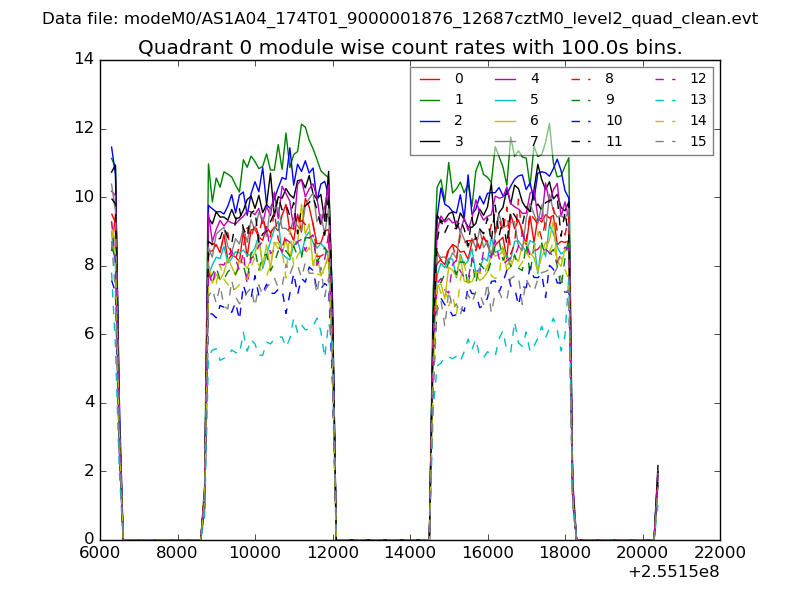 |
 |
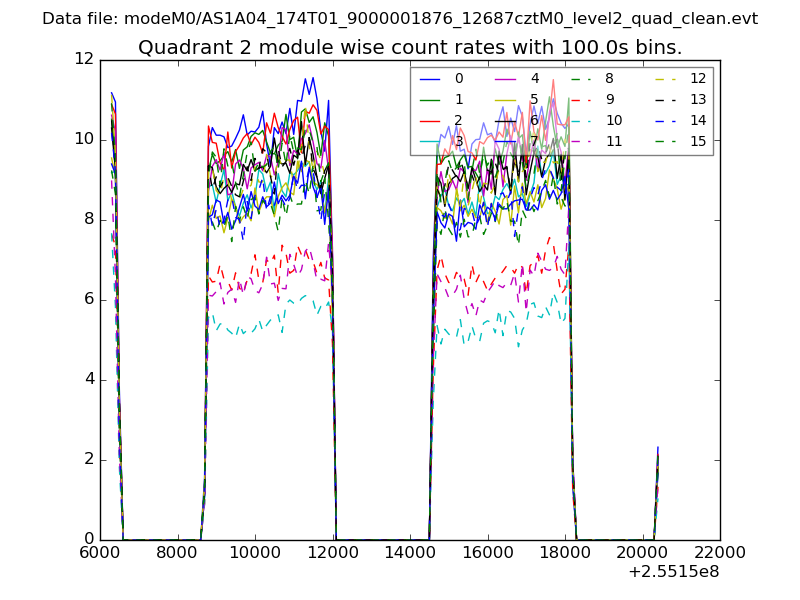
| Module-wise count rates for Quadrant B Data is divided into 100 sec bins |
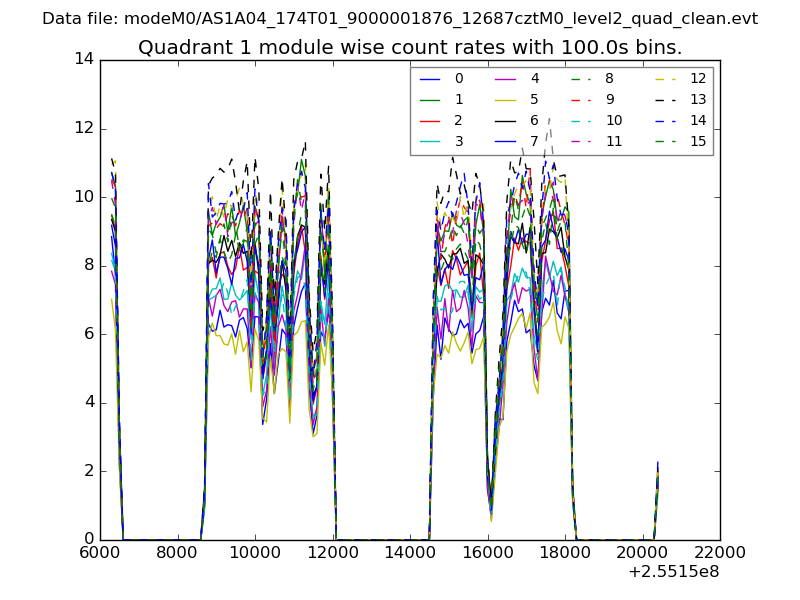 |
 |
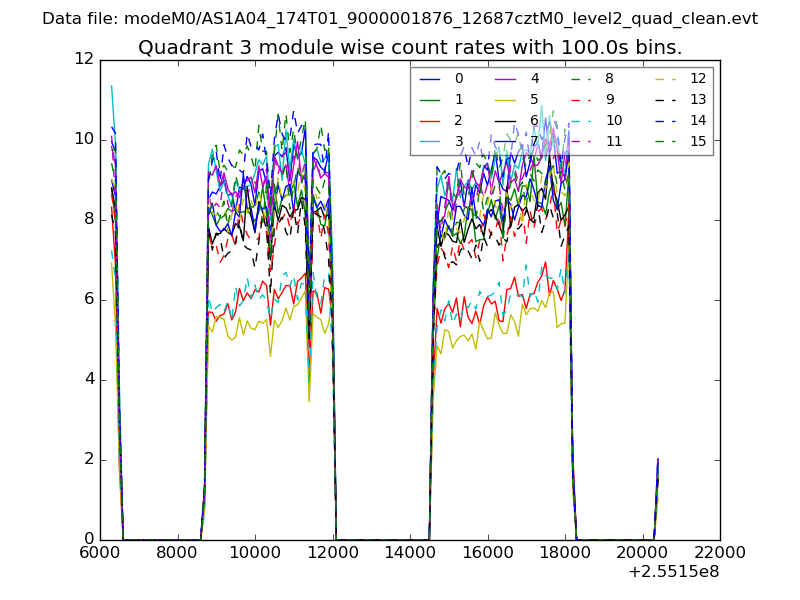
| Module-wise count rates for Quadrant C Data is divided into 100 sec bins |
 |
 |
| Module-wise count rates for Quadrant D Data is divided into 100 sec bins |
 |
 |
| Parameter | Plot |
|---|---|
| CZT HV Monitor | 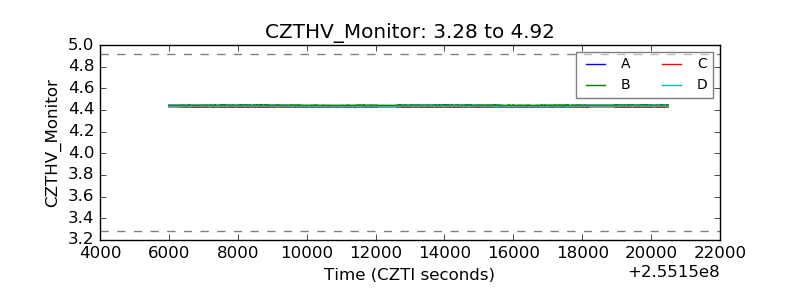 |
| D_VDD | 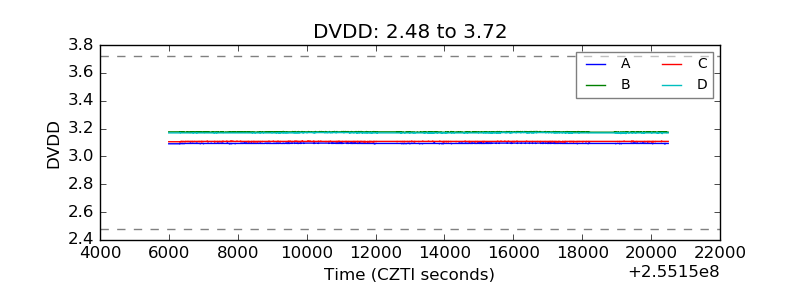 |
| Temperature 1 | 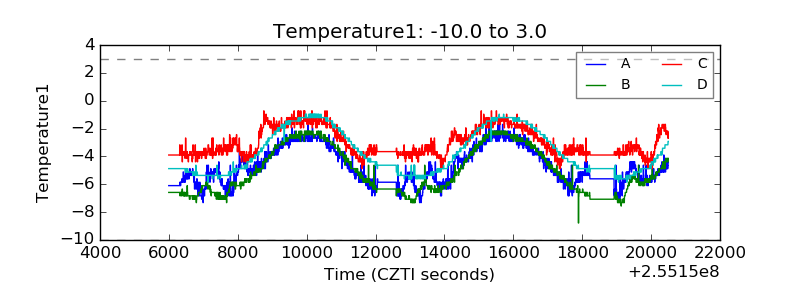 |
| Veto HV Monitor | 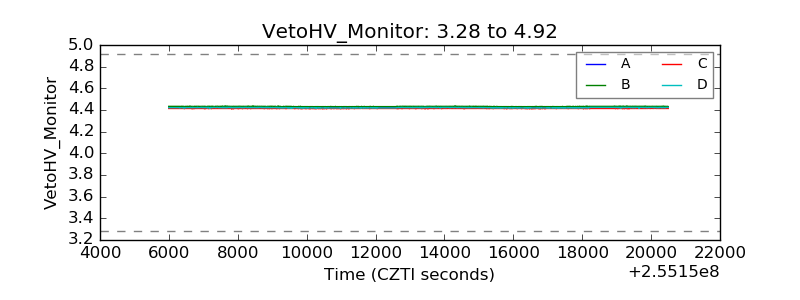 |
| Veto LLD | 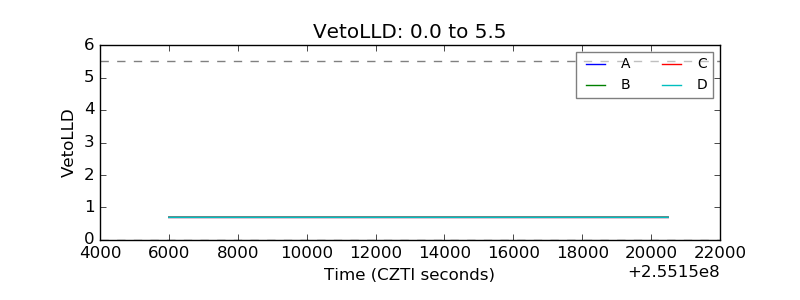 |
| Alpha Counter | 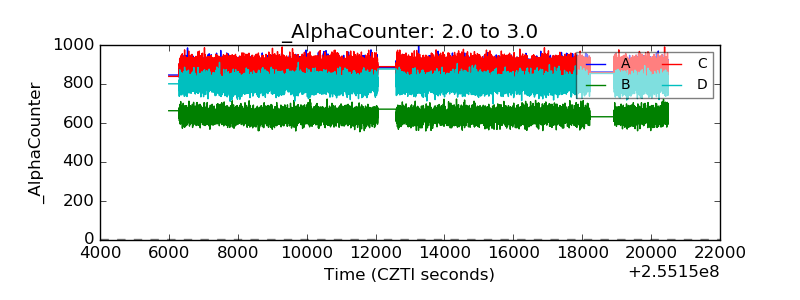 |
| _CPM_Rate | 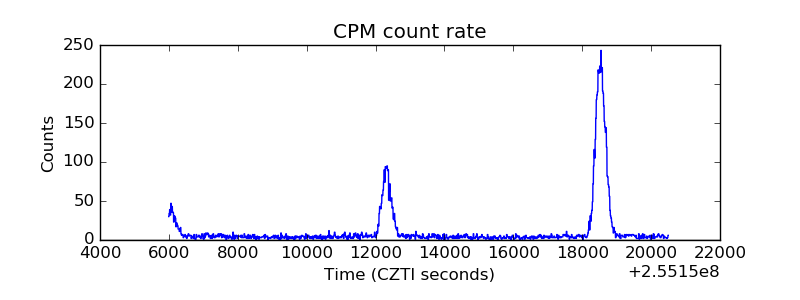 |
| CZT Counter |  |
| +2.5 Volts monitor |  |
| +5 Volts monitor |  |
| _ROLL_ROT | 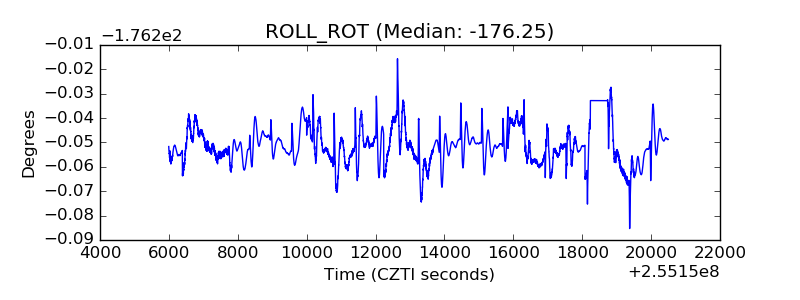 |
| _Roll_DEC | 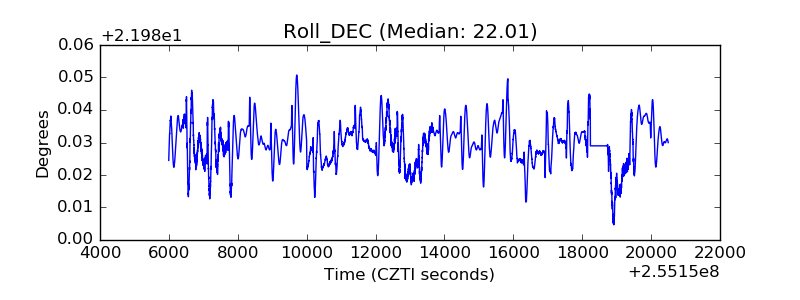 |
| _Roll_RA | 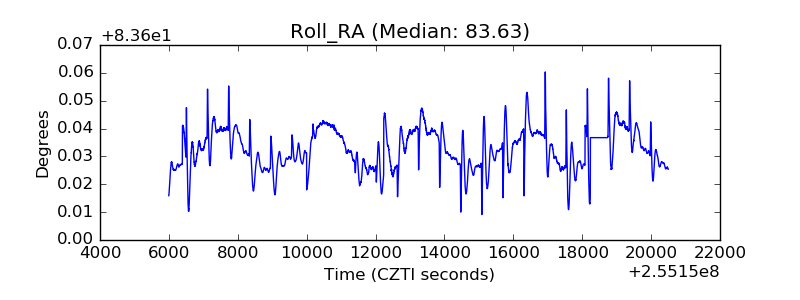 |
| Veto Counter | 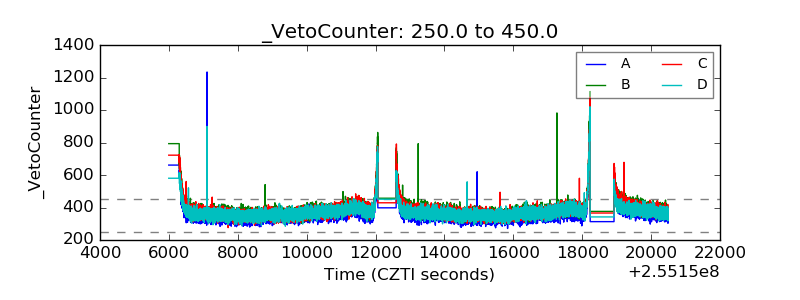 |