| Param | Original file | Final file |
|---|---|---|
| Filename | modeM0/AS1A04_174T01_9000001876_12691cztM0_level2.evt | modeM0/AS1A04_174T01_9000001876_12691cztM0_level2_quad_clean.evt |
| Size (bytes) | 535,688,640 | 102,222,720 |
| Size | 510.9 MB | 97.5 MB |
| Events in quadrant A | 3,345,304 | 694,364 |
| Events in quadrant B | 5,472,966 | 619,165 |
| Events in quadrant C | 3,239,512 | 683,258 |
| Events in quadrant D | 3,725,445 | 646,391 |
| Mode M9 | |||
|---|---|---|---|
| Quadrant | BADHDUFLAG | Total packets | Discarded packets |
| A | 0 | 13 | 0 |
| B | 0 | 13 | 0 |
| C | 0 | 13 | 0 |
| D | 0 | 14 | 0 |
| Mode M0 | |||
|---|---|---|---|
| Quadrant | BADHDUFLAG | Total packets | Discarded packets |
| A | 0 | 14034 | 3 |
| B | 0 | 20547 | 2 |
| C | 0 | 13737 | 2 |
| D | 0 | 15223 | 2 |
| Mode SS | |||
|---|---|---|---|
| Quadrant | BADHDUFLAG | Total packets | Discarded packets |
| A | 0 | 132 | 0 |
| B | 0 | 132 | 0 |
| C | 0 | 132 | 0 |
| D | 0 | 132 | 0 |
| Quadrant | Total seconds | Saturated seconds | Saturation percentage |
|---|---|---|---|
| A | 6485 | 108 | 1.665382% |
| B | 6485 | 865 | 13.338473% |
| C | 6485 | 75 | 1.156515% |
| D | 6485 | 167 | 2.575173% |
Noise dominated data is calculated using 1-second bins in cleaned event files. If a bin has >2000 counts, and if more than 50% of those come from <1% of pixels, then it is considered to be noise-dominated and hence unusable.
| Quadrant | # 1 sec bins | Bins with >0 counts | Bins with >2000 counts | High rate bins dominated by noise | Noise dominated (total time) | Noise dominated (detector-on time) | Marked lightcurve |
|---|---|---|---|---|---|---|---|
| A | 7585 | 6485 | 4 | 4 | 0.05% | 0.06% | 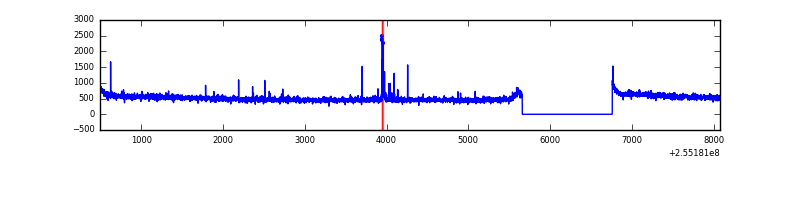 |
| B | 7585 | 6485 | 665 | 665 | 8.77% | 10.25% | 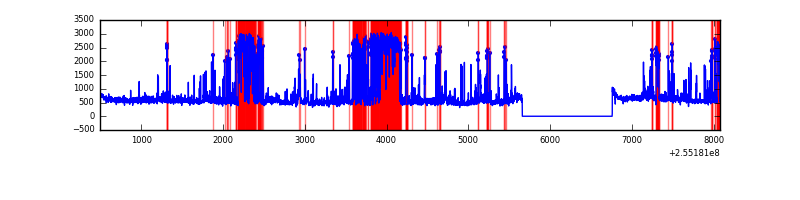 |
| C | 7585 | 6485 | 14 | 14 | 0.18% | 0.22% | 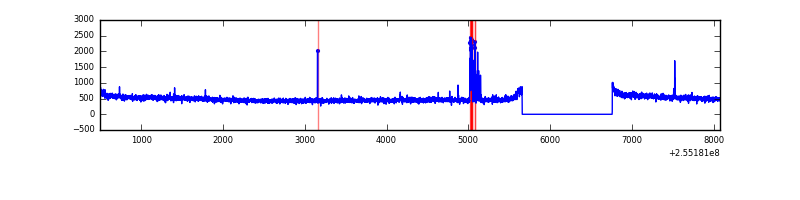 |
| D | 7585 | 6485 | 84 | 84 | 1.11% | 1.30% | 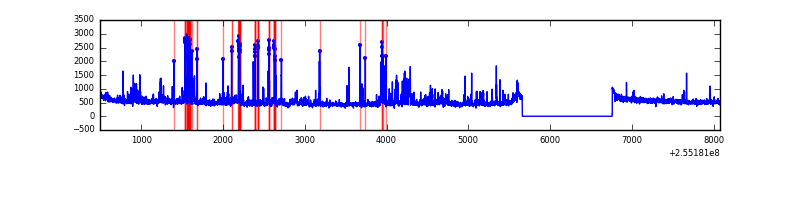 |
Top three noisy pixels from each quadrant. If the there are fewer than three noisy pixels in the level2.evt file, extra rows are filled as -1
| Pixel properties | Quadrant properties | ||||||
|---|---|---|---|---|---|---|---|
| Quadrant | DetID | PixID | Counts | Sigma | Mean | Median | Sigma |
| A | 12 | 189 | 33334 | 186.9 | 847 | 830 | 173.9 |
| A | 7 | 16 | 27822 | 155.2 | 847 | 830 | 173.9 |
| A | 8 | 15 | 20919 | 115.51 | 847 | 830 | 173.9 |
| B | 4 | 239 | 2142700 | 14528.22 | 781 | 766 | 147.4 |
| B | 11 | 51 | 131067 | 883.8 | 781 | 766 | 147.4 |
| B | 3 | 209 | 71144 | 477.36 | 781 | 766 | 147.4 |
| C | 15 | 208 | 80338 | 425.1 | 808 | 816 | 187.1 |
| C | 14 | 234 | 5965 | 27.53 | 808 | 816 | 187.1 |
| C | 13 | 61 | 5862 | 26.97 | 808 | 816 | 187.1 |
| D | 1 | 52 | 478409 | 2429.74 | 811 | 790 | 196.6 |
| D | 10 | 157 | 81936 | 412.8 | 811 | 790 | 196.6 |
| D | 13 | 104 | 39903 | 198.97 | 811 | 790 | 196.6 |
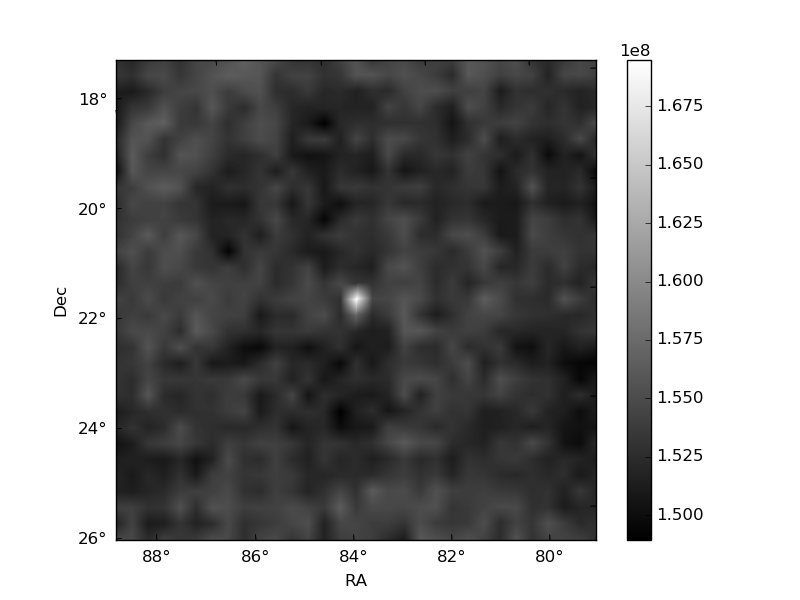
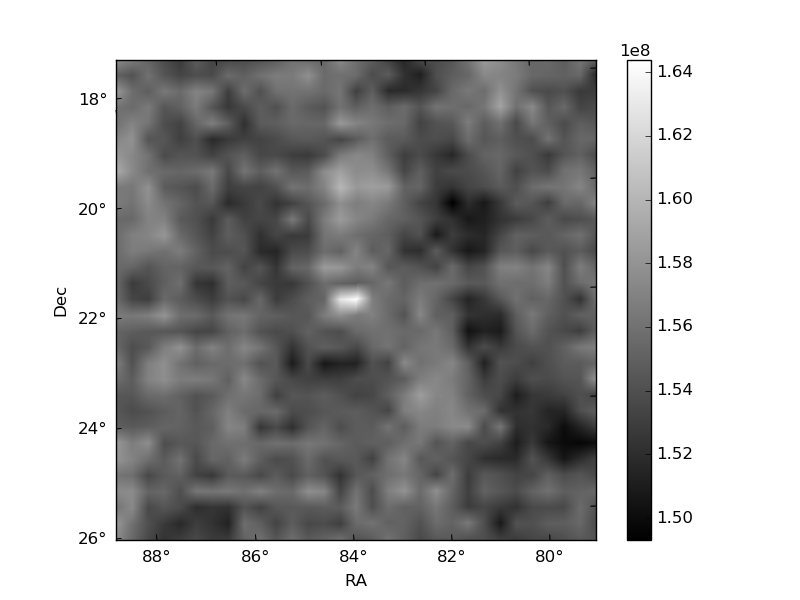
Histogram calculated using DETX and DETY for each event in the final _common_clean file
| Quadrant A | 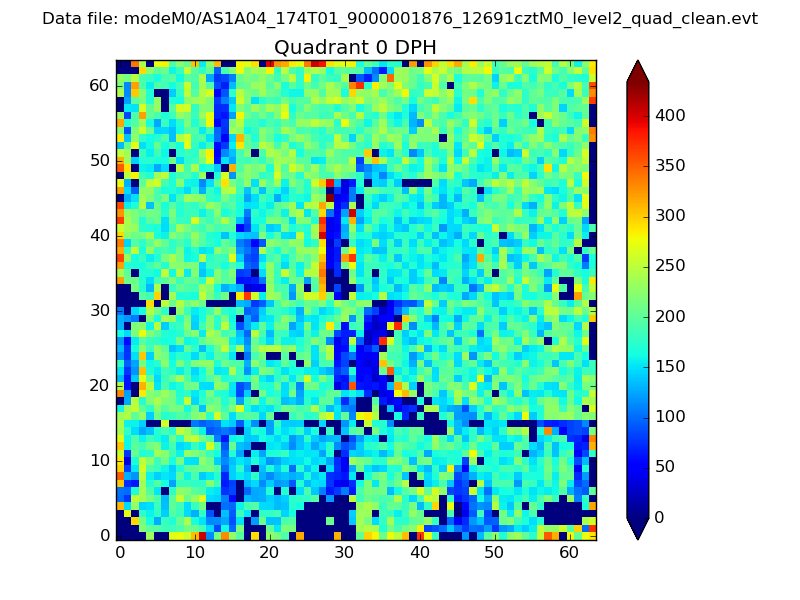 |
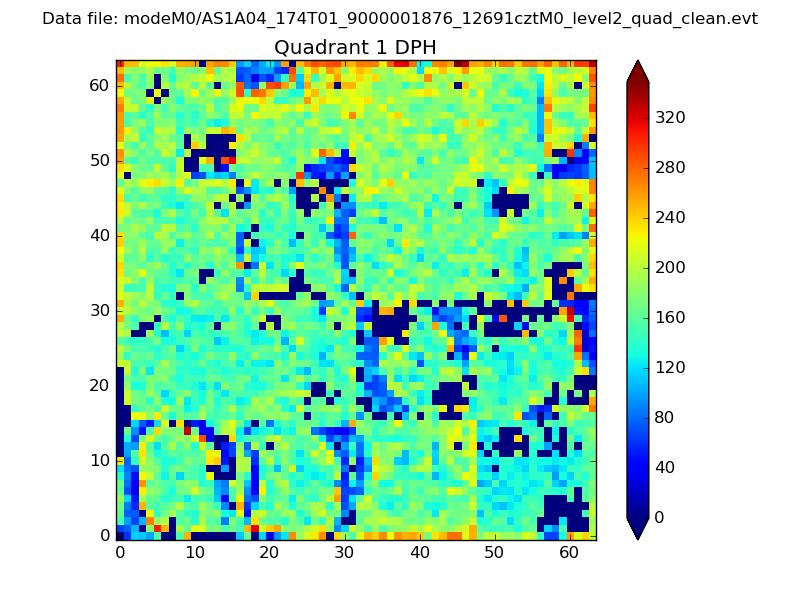 |
Quadrant B |
|---|---|---|---|
| Quadrant D | 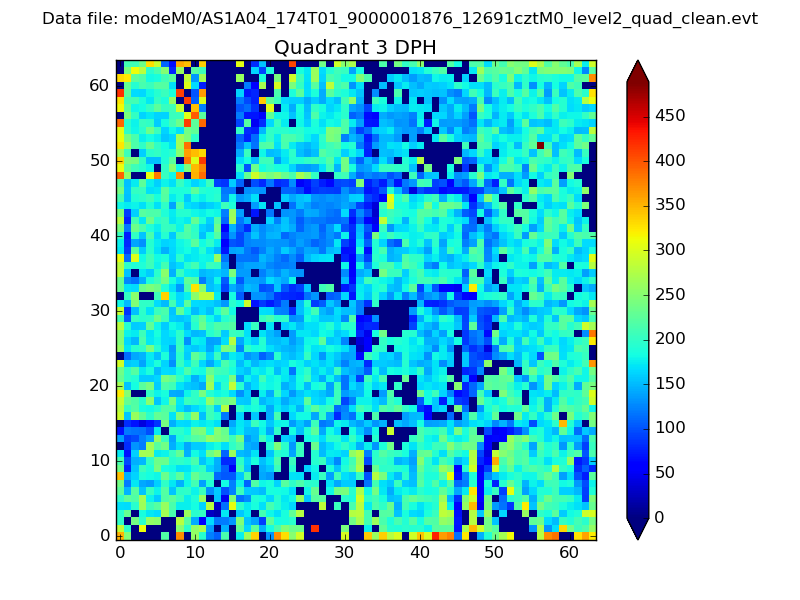 |
 |
Quadrant C |
| Plot type | Count rate plots | Images |
|---|---|---|
| Comparison with Poisson distribution Blue bars denote a histogram of data divided into 1 sec bins. Red curve is a Poisson curve with rate = median count rate of data. |
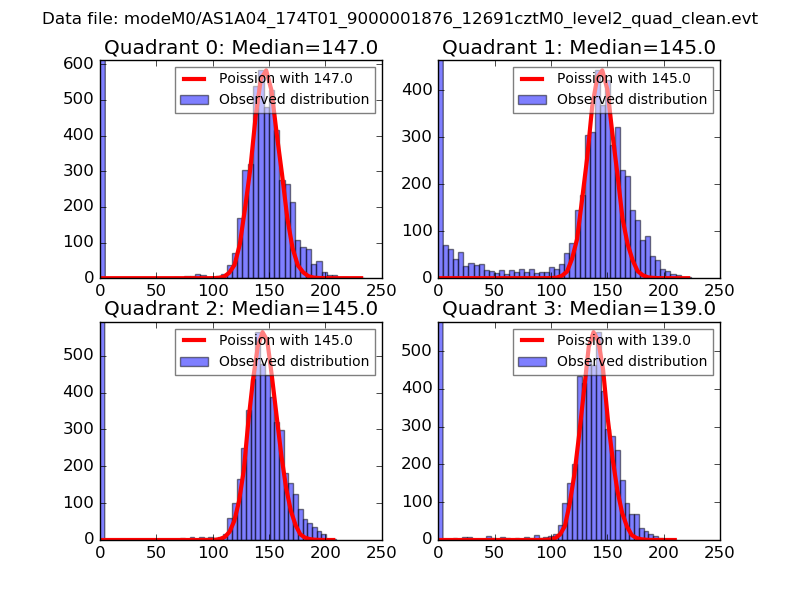 |
 |
| Quadrant-wise count rates Data is divided into 100 sec bins |
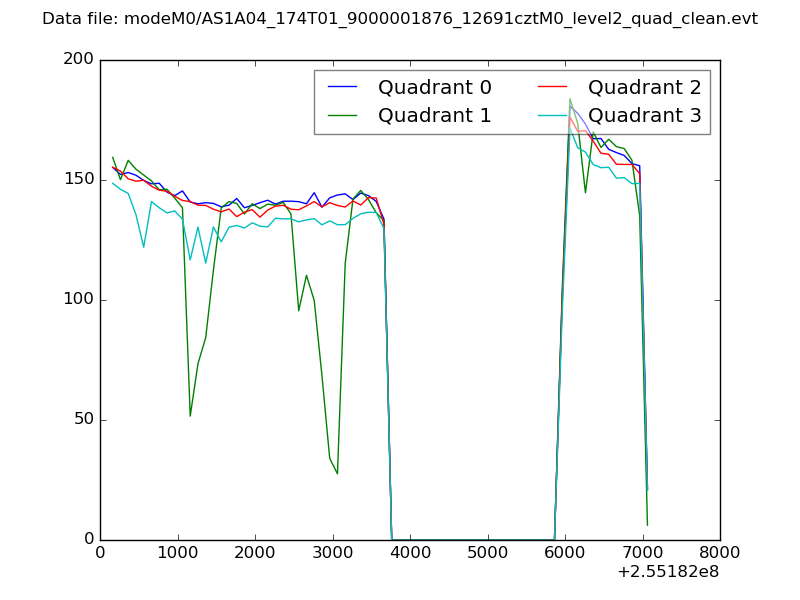 |
|
| Module-wise count rates for Quadrant A Data is divided into 100 sec bins |
 |
 |
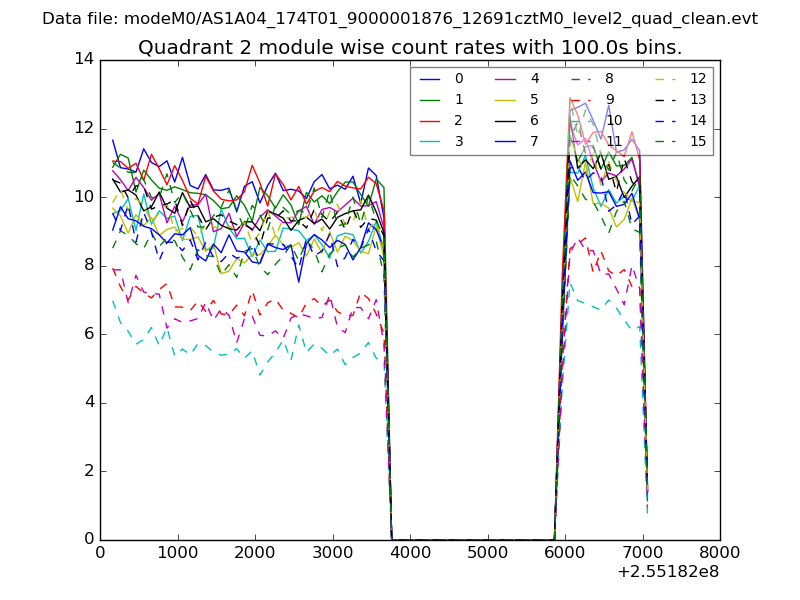
| Module-wise count rates for Quadrant B Data is divided into 100 sec bins |
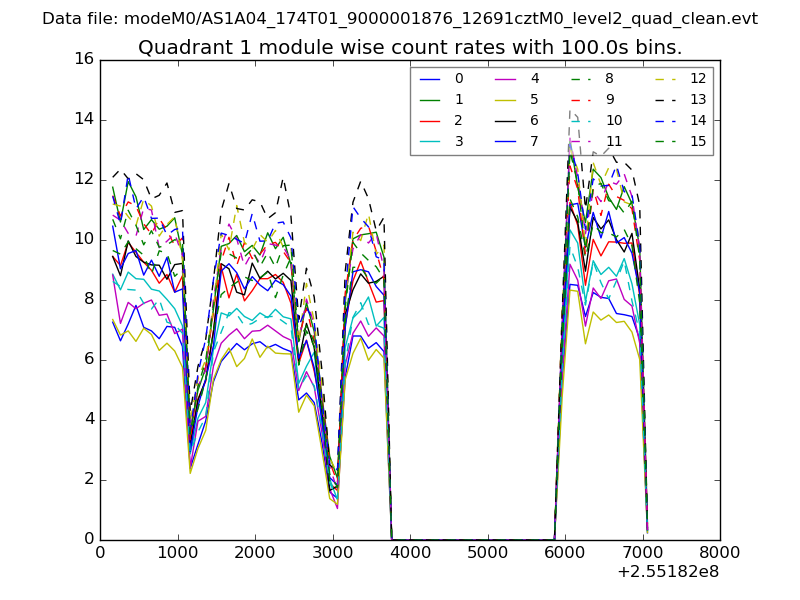 |
 |
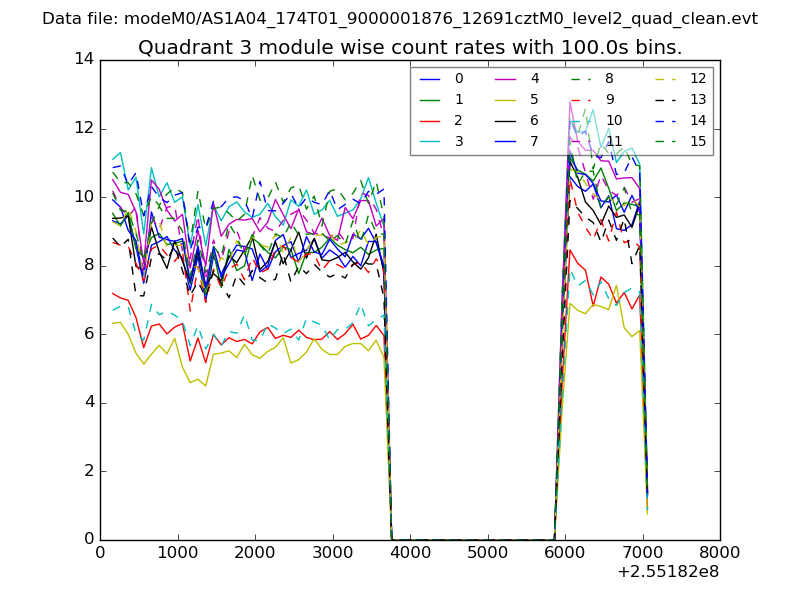
| Module-wise count rates for Quadrant C Data is divided into 100 sec bins |
 |
 |
| Module-wise count rates for Quadrant D Data is divided into 100 sec bins |
 |
 |
| Parameter | Plot |
|---|---|
| CZT HV Monitor | 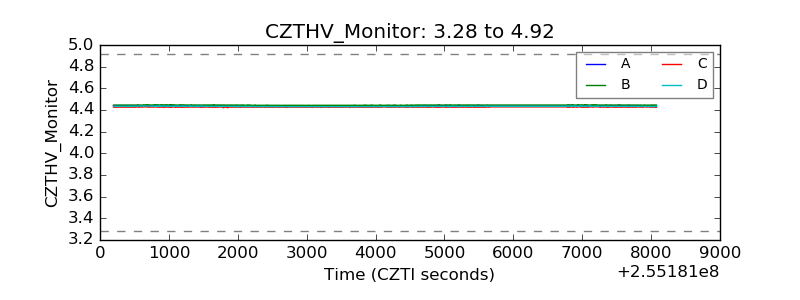 |
| D_VDD | 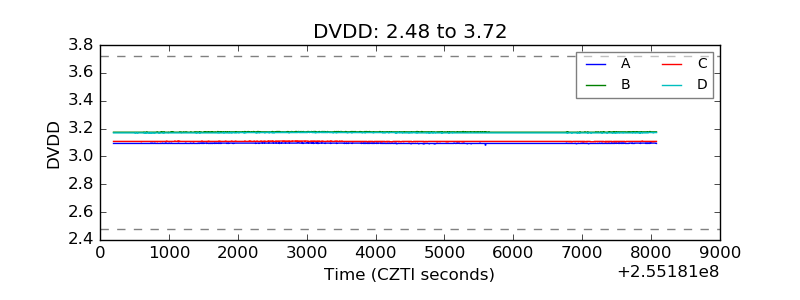 |
| Temperature 1 | 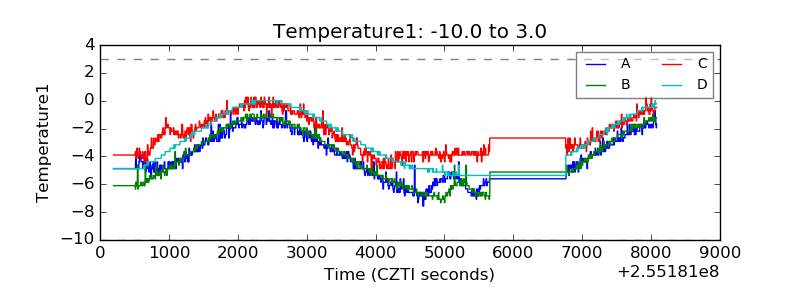 |
| Veto HV Monitor | 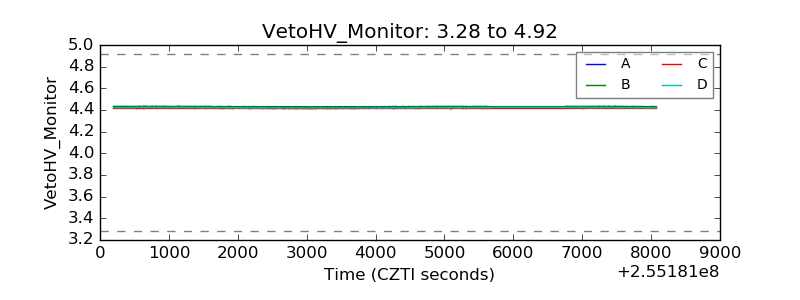 |
| Veto LLD | 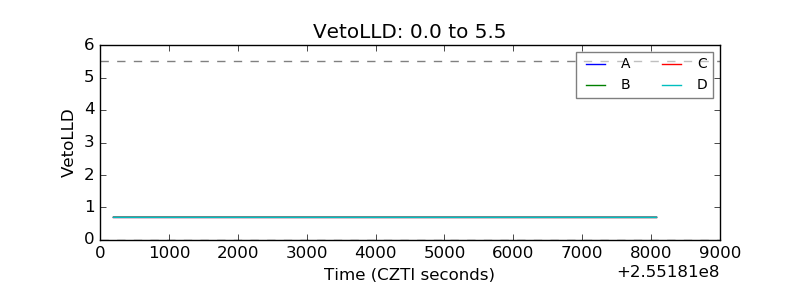 |
| Alpha Counter | 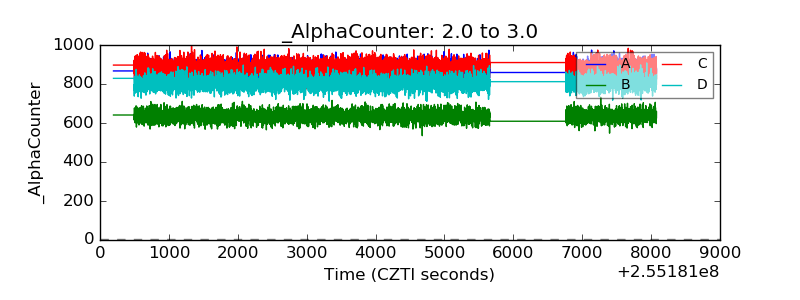 |
| _CPM_Rate | 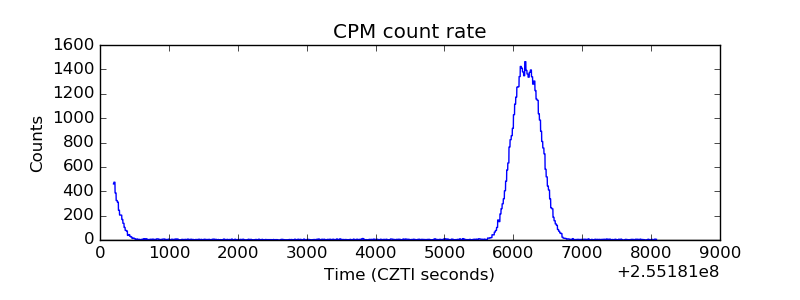 |
| CZT Counter |  |
| +2.5 Volts monitor |  |
| +5 Volts monitor |  |
| _ROLL_ROT | 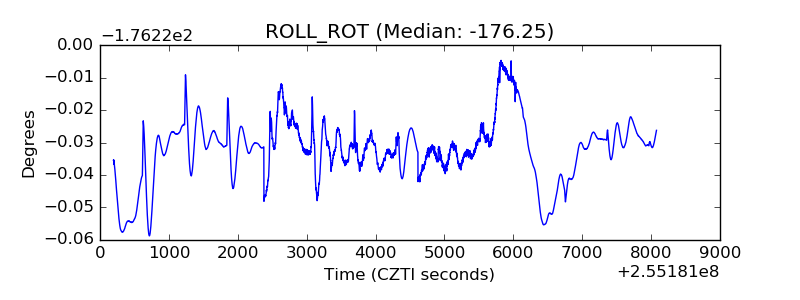 |
| _Roll_DEC | 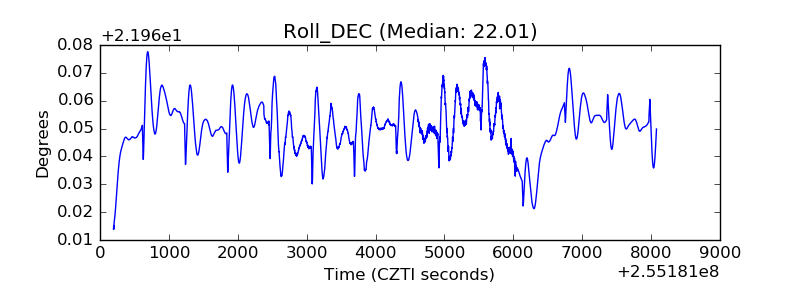 |
| _Roll_RA |  |
| Veto Counter | 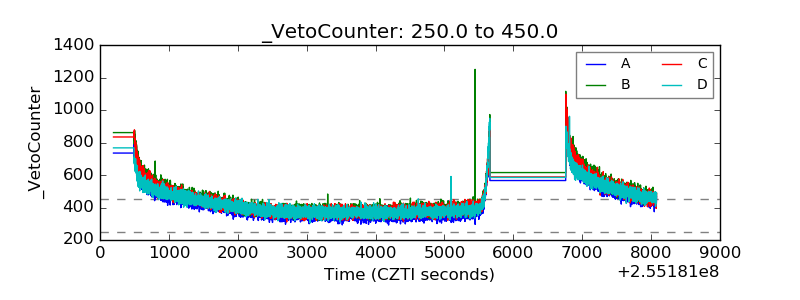 |