| Param | Original file | Final file |
|---|---|---|
| Filename | modeM0/AS1A04_174T01_9000001876_12692cztM0_level2.evt | modeM0/AS1A04_174T01_9000001876_12692cztM0_level2_quad_clean.evt |
| Size (bytes) | 510,874,560 | 106,358,400 |
| Size | 487.2 MB | 101.4 MB |
| Events in quadrant A | 3,102,276 | 750,196 |
| Events in quadrant B | 5,868,705 | 621,458 |
| Events in quadrant C | 3,011,180 | 728,918 |
| Events in quadrant D | 3,085,003 | 703,764 |
| Mode M9 | |||
|---|---|---|---|
| Quadrant | BADHDUFLAG | Total packets | Discarded packets |
| A | 0 | 12 | 0 |
| B | 0 | 12 | 0 |
| C | 0 | 12 | 0 |
| D | 0 | 12 | 0 |
| Mode M0 | |||
|---|---|---|---|
| Quadrant | BADHDUFLAG | Total packets | Discarded packets |
| A | 0 | 12805 | 2 |
| B | 0 | 21388 | 1 |
| C | 0 | 12720 | 1 |
| D | 0 | 13032 | 1 |
| Mode SS | |||
|---|---|---|---|
| Quadrant | BADHDUFLAG | Total packets | Discarded packets |
| A | 0 | 120 | 0 |
| B | 0 | 120 | 0 |
| C | 0 | 120 | 0 |
| D | 0 | 120 | 0 |
| Quadrant | Total seconds | Saturated seconds | Saturation percentage |
|---|---|---|---|
| A | 5966 | 90 | 1.508548% |
| B | 5966 | 1215 | 20.365404% |
| C | 5966 | 69 | 1.156554% |
| D | 5966 | 80 | 1.340932% |
Noise dominated data is calculated using 1-second bins in cleaned event files. If a bin has >2000 counts, and if more than 50% of those come from <1% of pixels, then it is considered to be noise-dominated and hence unusable.
| Quadrant | # 1 sec bins | Bins with >0 counts | Bins with >2000 counts | High rate bins dominated by noise | Noise dominated (total time) | Noise dominated (detector-on time) | Marked lightcurve |
|---|---|---|---|---|---|---|---|
| A | 7152 | 5968 | 0 | 0 | 0.00% | 0.00% |  |
| B | 7152 | 5968 | 956 | 956 | 13.37% | 16.02% | 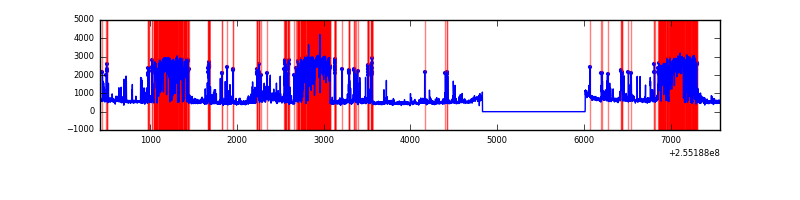 |
| C | 7152 | 5968 | 1 | 1 | 0.01% | 0.02% | 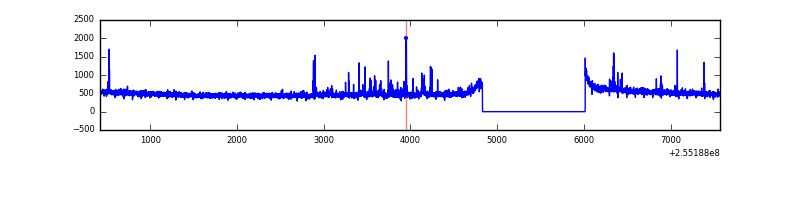 |
| D | 7152 | 5968 | 2 | 2 | 0.03% | 0.03% | 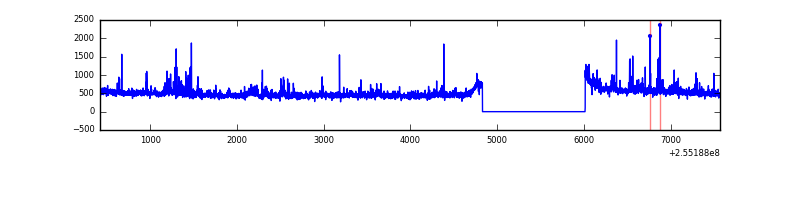 |
Top three noisy pixels from each quadrant. If the there are fewer than three noisy pixels in the level2.evt file, extra rows are filled as -1
| Pixel properties | Quadrant properties | ||||||
|---|---|---|---|---|---|---|---|
| Quadrant | DetID | PixID | Counts | Sigma | Mean | Median | Sigma |
| A | 12 | 189 | 64896 | 405.99 | 781 | 768 | 158.0 |
| A | 8 | 15 | 34895 | 216.06 | 781 | 768 | 158.0 |
| A | 0 | 226 | 6946 | 39.11 | 781 | 768 | 158.0 |
| B | 4 | 239 | 2988114 | 23179.8 | 680 | 668 | 128.9 |
| B | 11 | 51 | 99047 | 763.33 | 680 | 668 | 128.9 |
| B | 3 | 209 | 24345 | 183.71 | 680 | 668 | 128.9 |
| C | 15 | 208 | 99531 | 576.45 | 744 | 750 | 171.4 |
| C | 14 | 234 | 6865 | 35.68 | 744 | 750 | 171.4 |
| C | 13 | 61 | 5501 | 27.73 | 744 | 750 | 171.4 |
| D | 1 | 52 | 110871 | 607.17 | 752 | 735 | 181.4 |
| D | 10 | 157 | 67274 | 366.83 | 752 | 735 | 181.4 |
| D | 2 | 234 | 24325 | 130.05 | 752 | 735 | 181.4 |
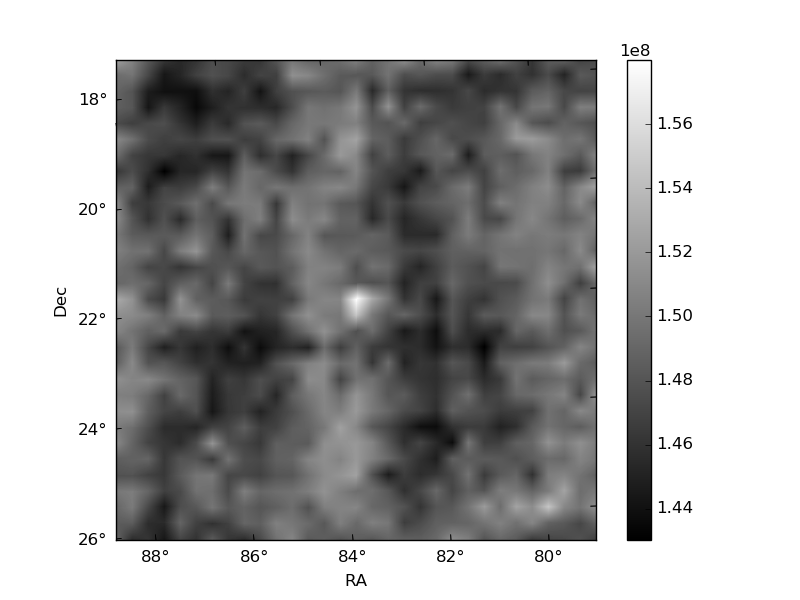
Histogram calculated using DETX and DETY for each event in the final _common_clean file
| Quadrant A | 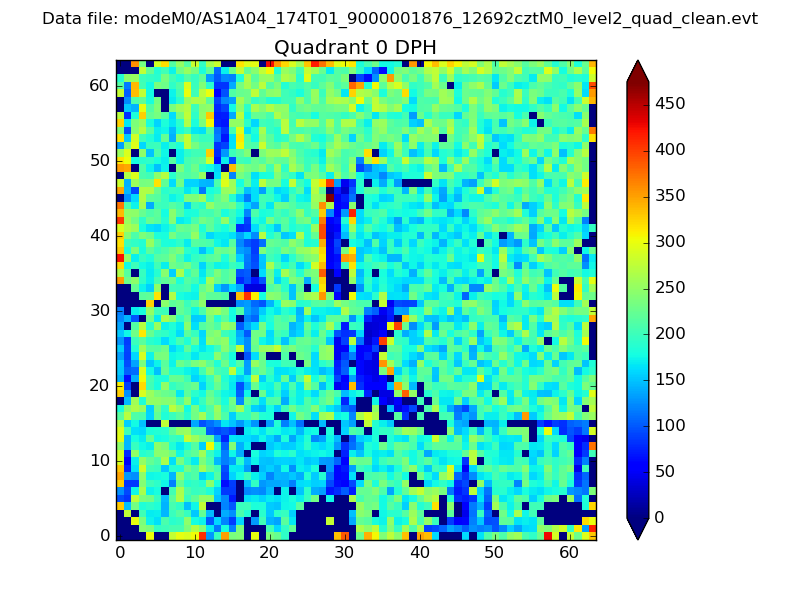 |
 |
Quadrant B |
|---|---|---|---|
| Quadrant D | 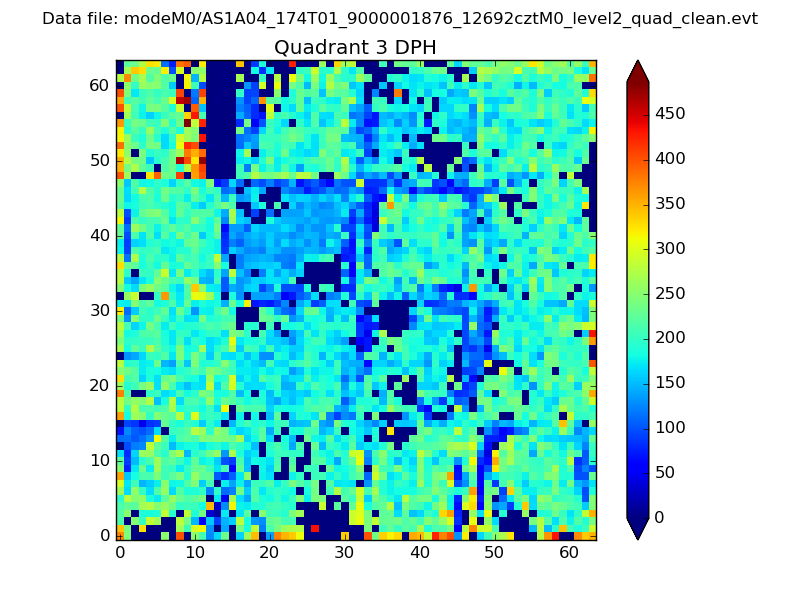 |
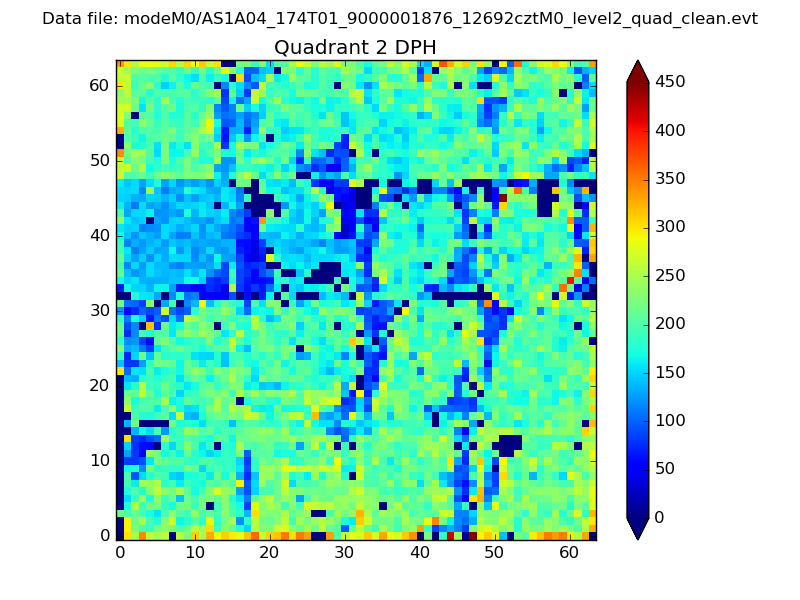 |
Quadrant C |
| Plot type | Count rate plots | Images |
|---|---|---|
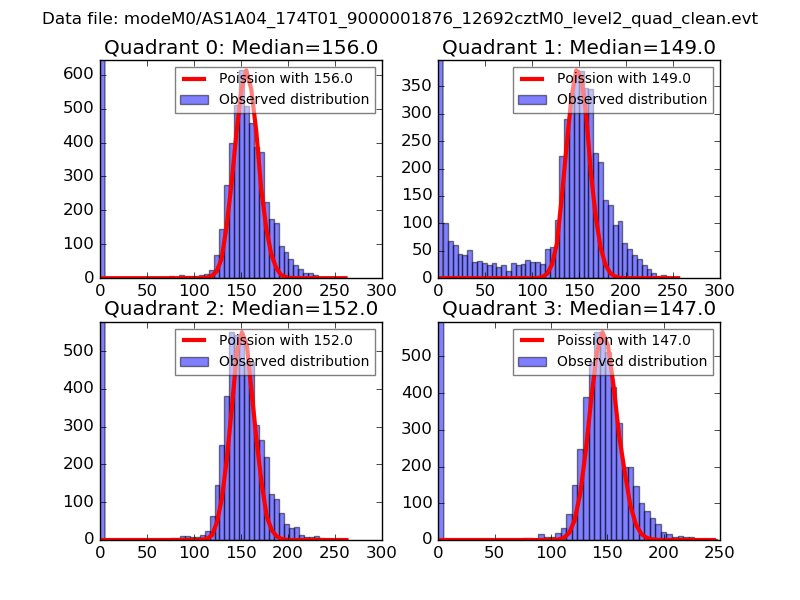
| Comparison with Poisson distribution Blue bars denote a histogram of data divided into 1 sec bins. Red curve is a Poisson curve with rate = median count rate of data. |
 |
 |
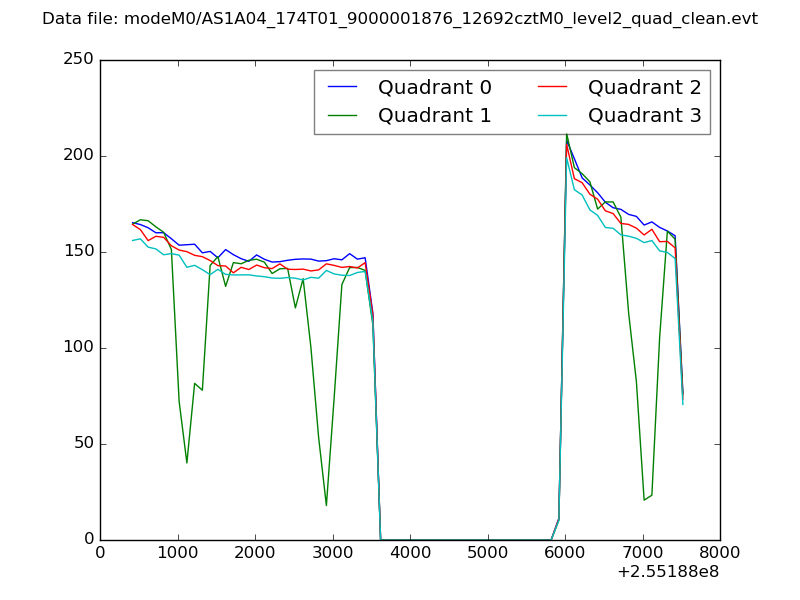
| Quadrant-wise count rates Data is divided into 100 sec bins |
 |
|
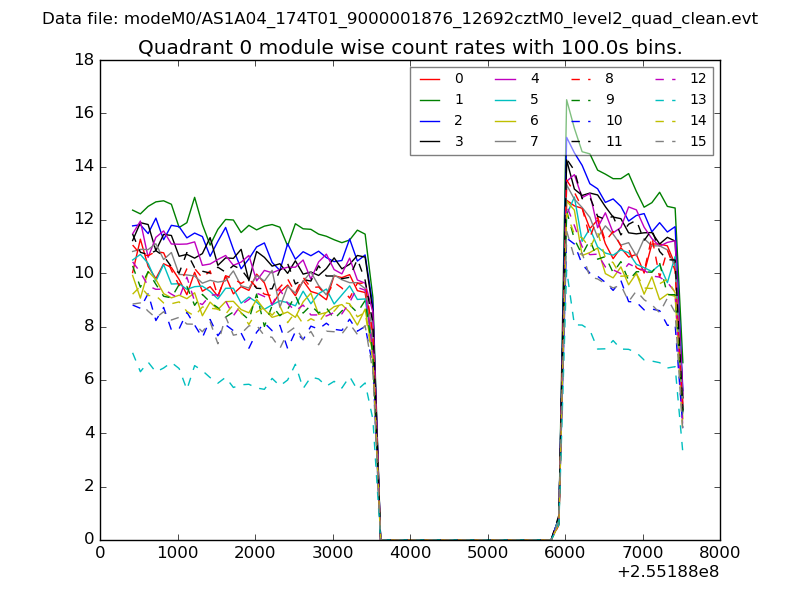
| Module-wise count rates for Quadrant A Data is divided into 100 sec bins |
 |
 |
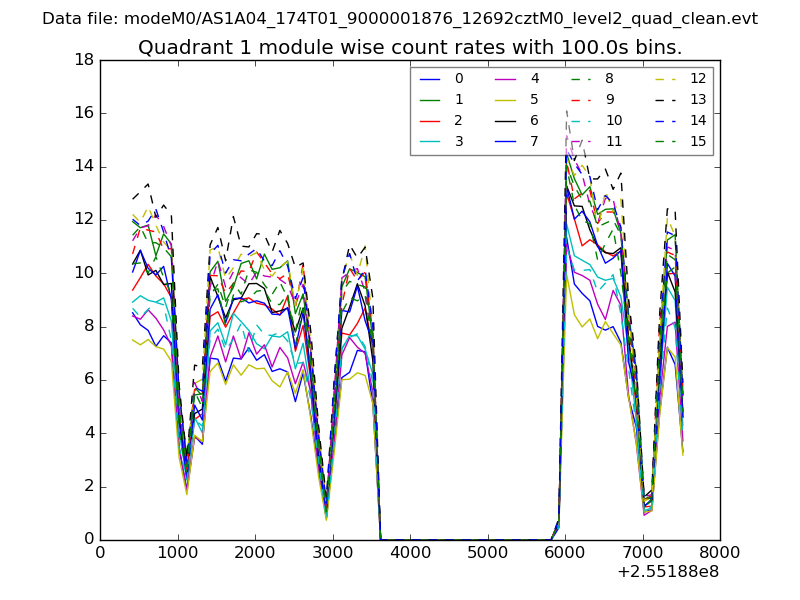
| Module-wise count rates for Quadrant B Data is divided into 100 sec bins |
 |
 |
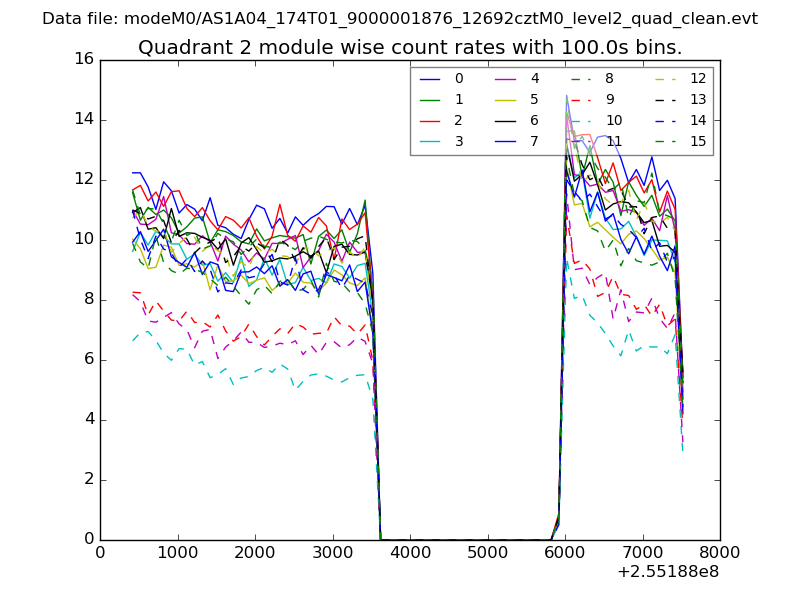
| Module-wise count rates for Quadrant C Data is divided into 100 sec bins |
 |
 |
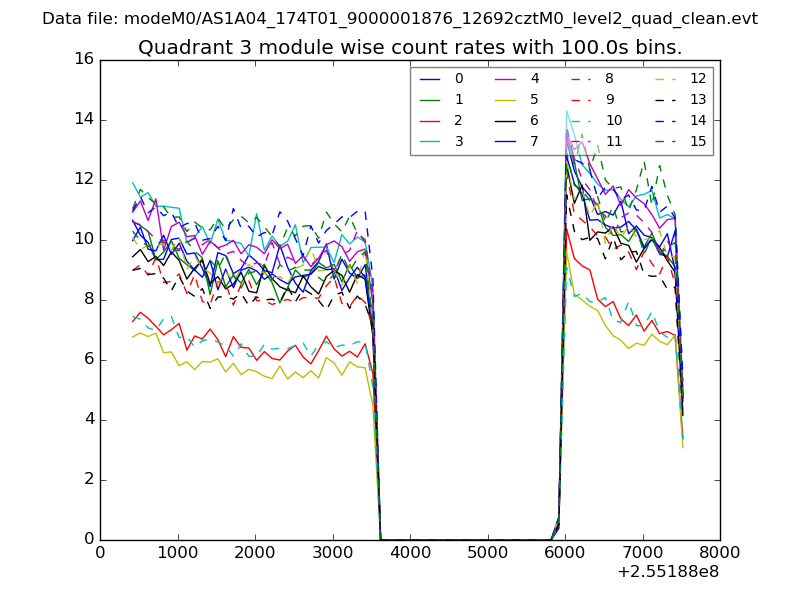
| Module-wise count rates for Quadrant D Data is divided into 100 sec bins |
 |
 |
| Parameter | Plot |
|---|---|
| CZT HV Monitor | 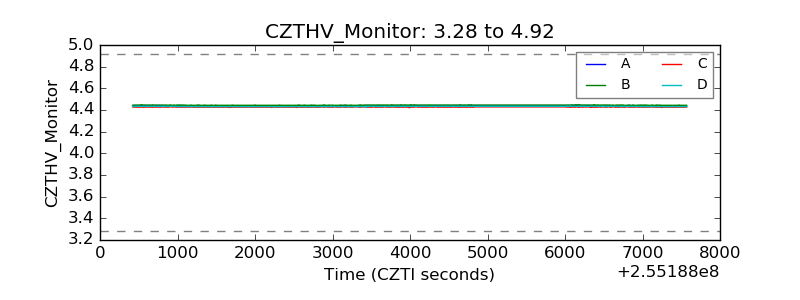 |
| D_VDD | 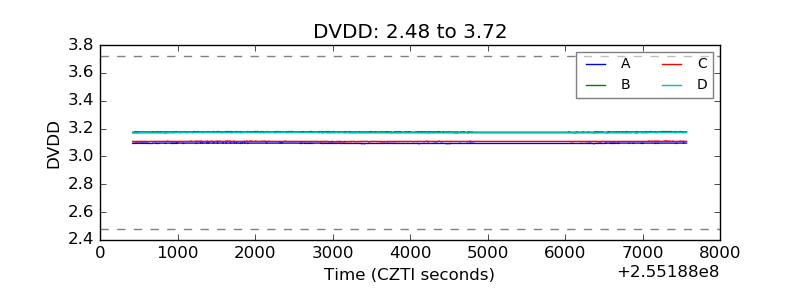 |
| Temperature 1 | 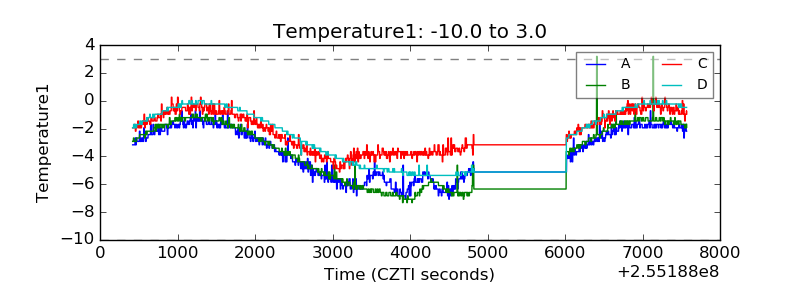 |
| Veto HV Monitor | 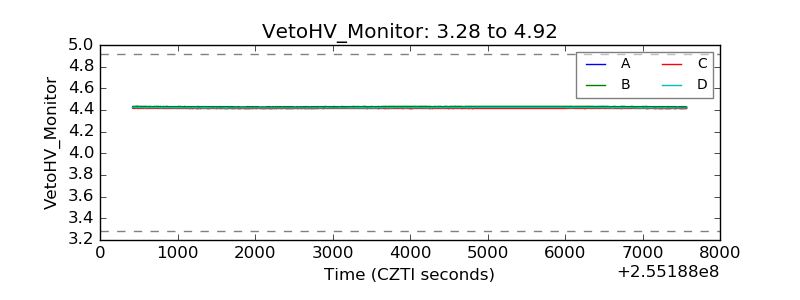 |
| Veto LLD | 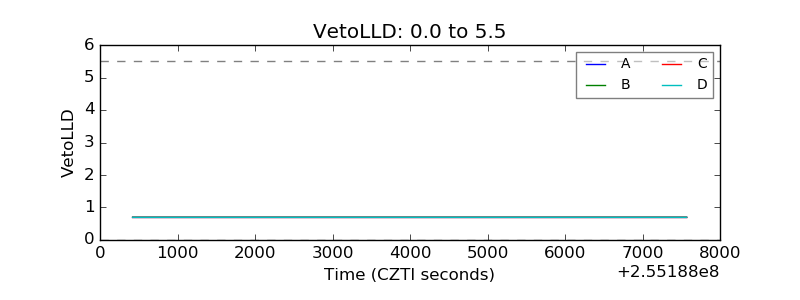 |
| Alpha Counter | 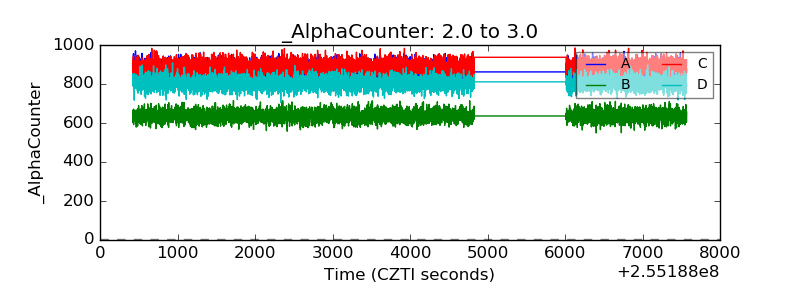 |
| _CPM_Rate | 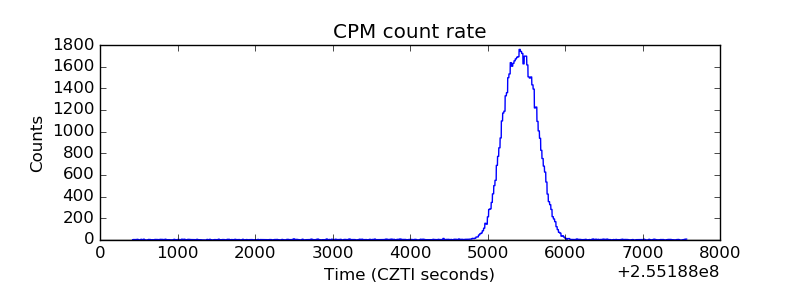 |
| CZT Counter | 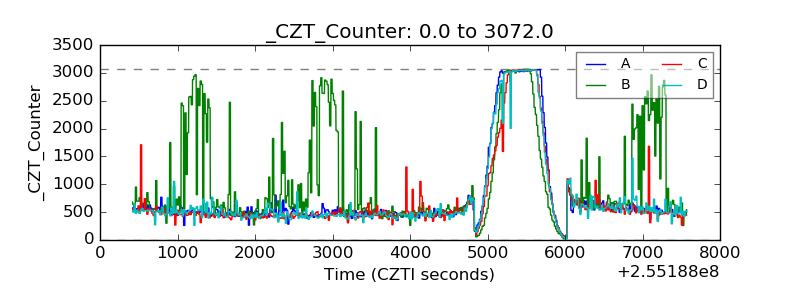 |
| +2.5 Volts monitor |  |
| +5 Volts monitor |  |
| _ROLL_ROT | 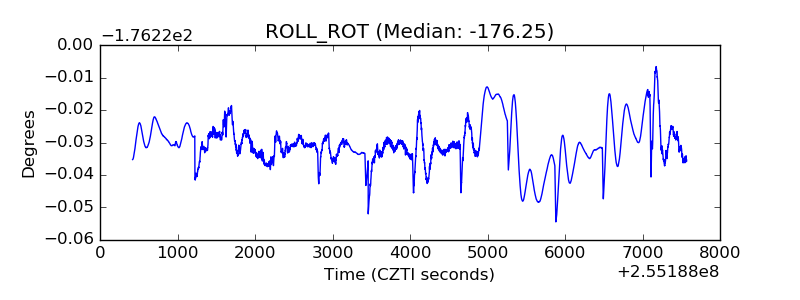 |
| _Roll_DEC | 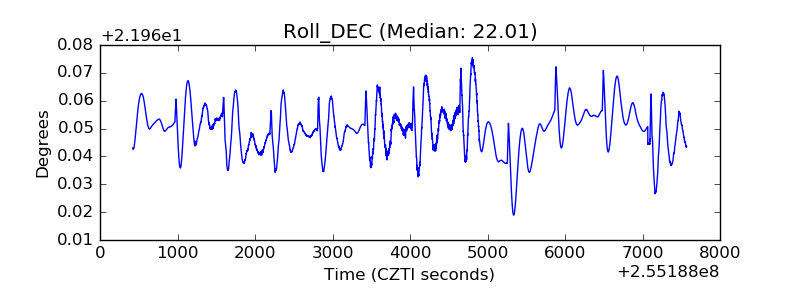 |
| _Roll_RA | 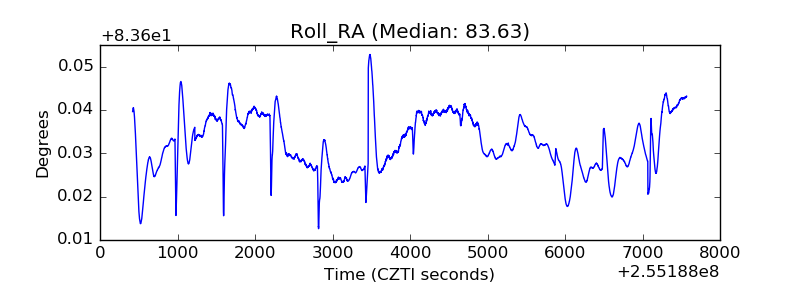 |
| Veto Counter | 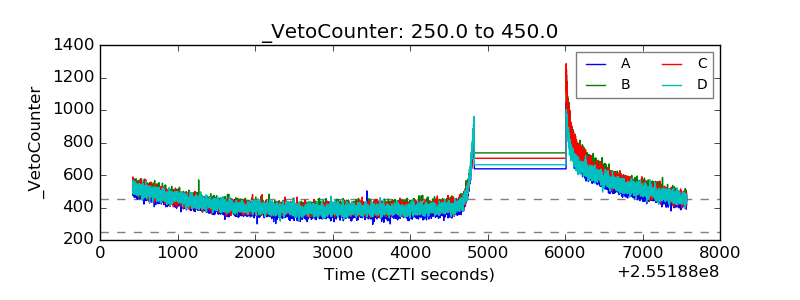 |