| Param | Original file | Final file |
|---|---|---|
| Filename | modeM0/AS1A04_174T01_9000001876_12693cztM0_level2.evt | modeM0/AS1A04_174T01_9000001876_12693cztM0_level2_quad_clean.evt |
| Size (bytes) | 507,029,760 | 101,384,640 |
| Size | 483.5 MB | 96.7 MB |
| Events in quadrant A | 3,078,508 | 713,391 |
| Events in quadrant B | 5,654,618 | 580,721 |
| Events in quadrant C | 3,027,923 | 690,957 |
| Events in quadrant D | 3,186,927 | 665,686 |
| Mode M9 | |||
|---|---|---|---|
| Quadrant | BADHDUFLAG | Total packets | Discarded packets |
| A | 0 | 12 | 0 |
| B | 0 | 12 | 0 |
| C | 0 | 12 | 0 |
| D | 0 | 12 | 0 |
| Mode M0 | |||
|---|---|---|---|
| Quadrant | BADHDUFLAG | Total packets | Discarded packets |
| A | 0 | 12814 | 2 |
| B | 0 | 20672 | 1 |
| C | 0 | 12722 | 1 |
| D | 0 | 13288 | 1 |
| Mode SS | |||
|---|---|---|---|
| Quadrant | BADHDUFLAG | Total packets | Discarded packets |
| A | 0 | 124 | 0 |
| B | 0 | 124 | 0 |
| C | 0 | 124 | 0 |
| D | 0 | 124 | 0 |
| Quadrant | Total seconds | Saturated seconds | Saturation percentage |
|---|---|---|---|
| A | 5995 | 71 | 1.184320% |
| B | 5995 | 1175 | 19.599666% |
| C | 5995 | 57 | 0.950792% |
| D | 5995 | 74 | 1.234362% |
Noise dominated data is calculated using 1-second bins in cleaned event files. If a bin has >2000 counts, and if more than 50% of those come from <1% of pixels, then it is considered to be noise-dominated and hence unusable.
| Quadrant | # 1 sec bins | Bins with >0 counts | Bins with >2000 counts | High rate bins dominated by noise | Noise dominated (total time) | Noise dominated (detector-on time) | Marked lightcurve |
|---|---|---|---|---|---|---|---|
| A | 7276 | 5997 | 0 | 0 | 0.00% | 0.00% | 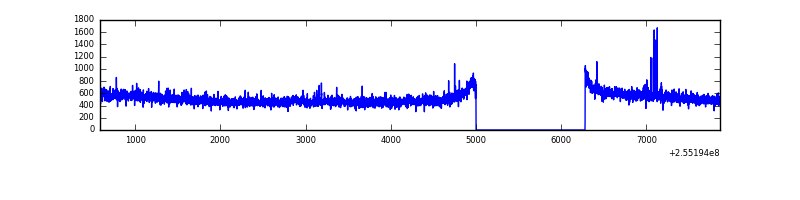 |
| B | 7276 | 5997 | 936 | 936 | 12.86% | 15.61% | 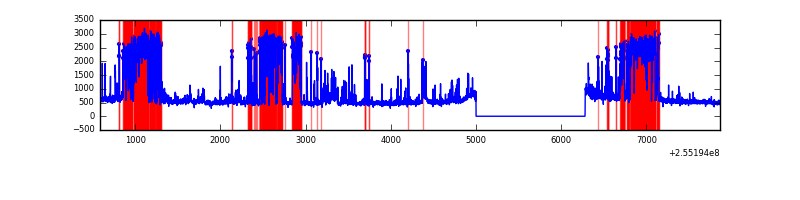 |
| C | 7276 | 5997 | 12 | 12 | 0.16% | 0.20% | 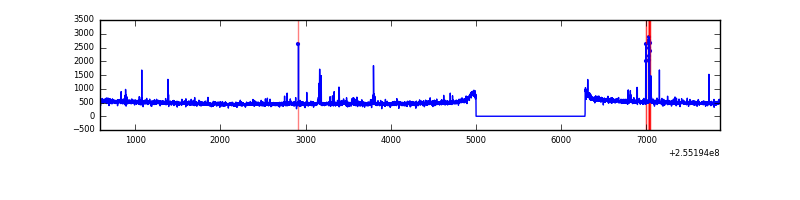 |
| D | 7276 | 5997 | 11 | 11 | 0.15% | 0.18% | 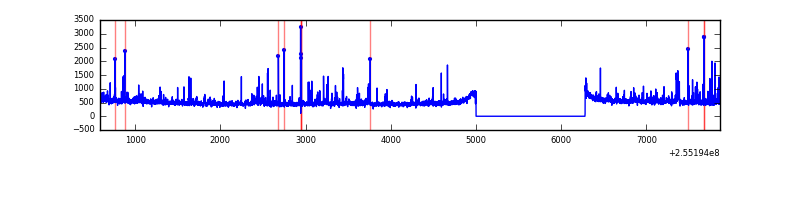 |
Top three noisy pixels from each quadrant. If the there are fewer than three noisy pixels in the level2.evt file, extra rows are filled as -1
| Pixel properties | Quadrant properties | ||||||
|---|---|---|---|---|---|---|---|
| Quadrant | DetID | PixID | Counts | Sigma | Mean | Median | Sigma |
| A | 12 | 189 | 30290 | 186.98 | 784 | 772 | 157.9 |
| A | 8 | 15 | 15796 | 95.17 | 784 | 772 | 157.9 |
| A | 9 | 143 | 10501 | 61.63 | 784 | 772 | 157.9 |
| B | 4 | 239 | 2819387 | 22287.14 | 677 | 664 | 126.5 |
| B | 3 | 64 | 69722 | 546.03 | 677 | 664 | 126.5 |
| B | 0 | 219 | 29780 | 230.22 | 677 | 664 | 126.5 |
| C | 15 | 208 | 102937 | 592.91 | 748 | 755 | 172.3 |
| C | 13 | 61 | 5611 | 28.18 | 748 | 755 | 172.3 |
| C | 1 | 5 | 4098 | 19.4 | 748 | 755 | 172.3 |
| D | 1 | 52 | 127551 | 697.04 | 757 | 739 | 181.9 |
| D | 10 | 157 | 62315 | 338.46 | 757 | 739 | 181.9 |
| D | 8 | 195 | 41172 | 222.25 | 757 | 739 | 181.9 |
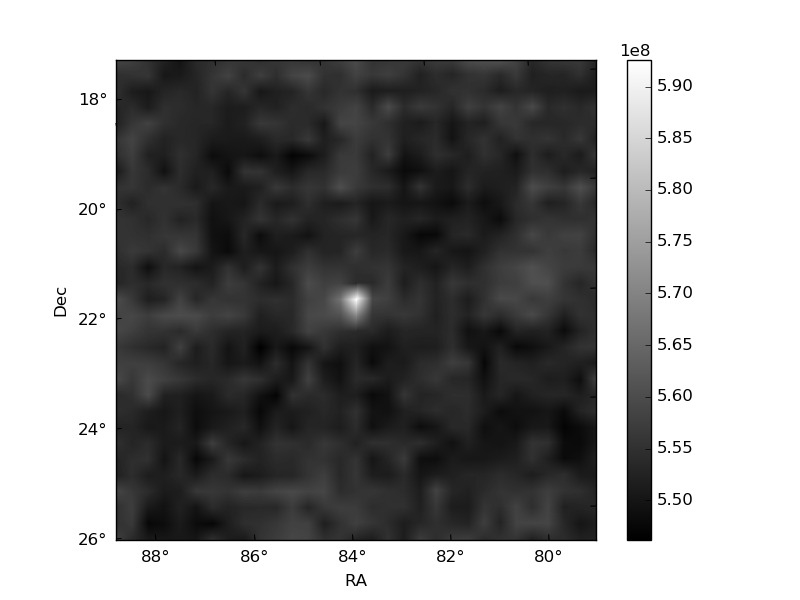
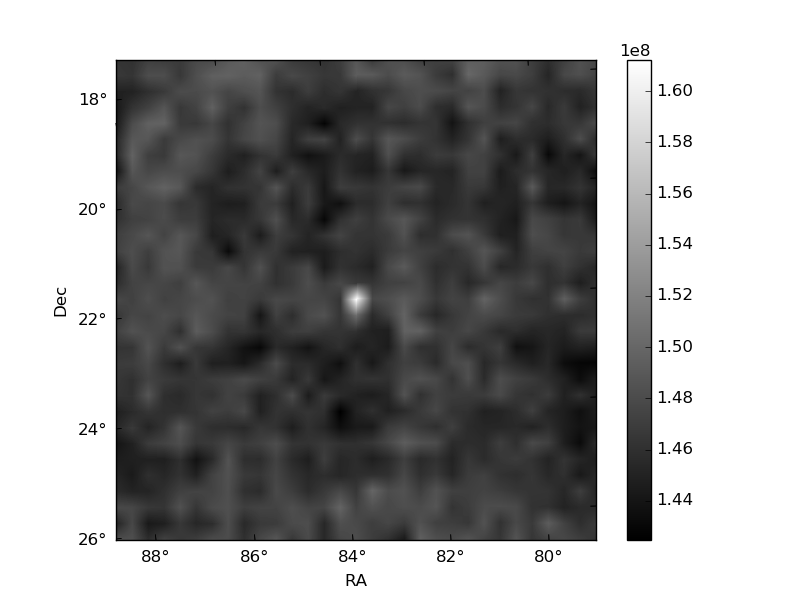
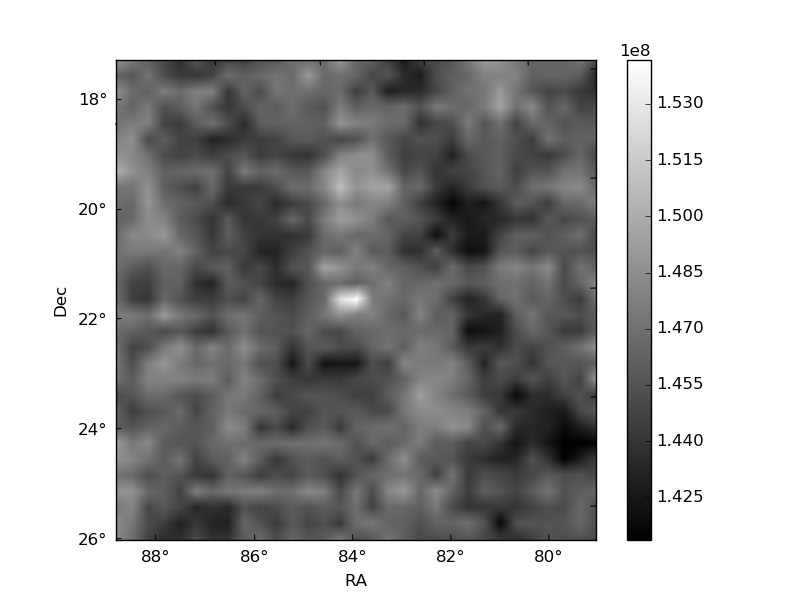
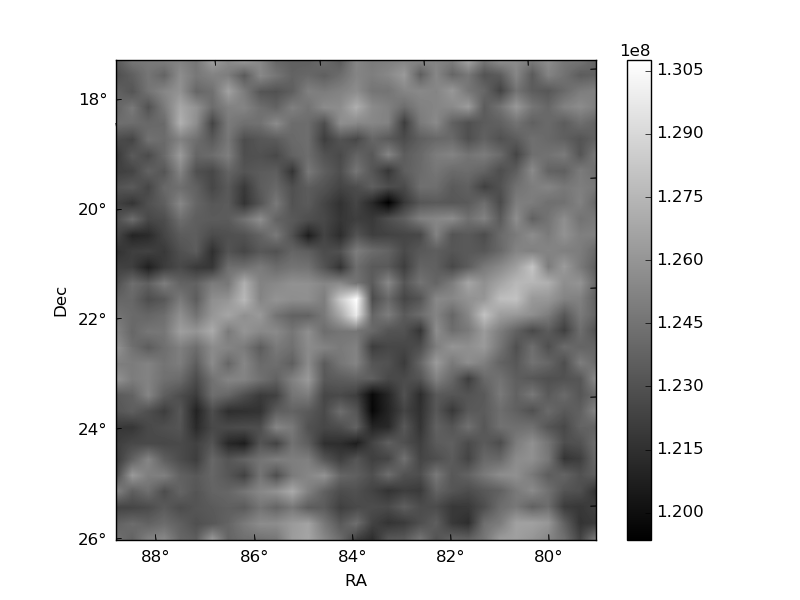
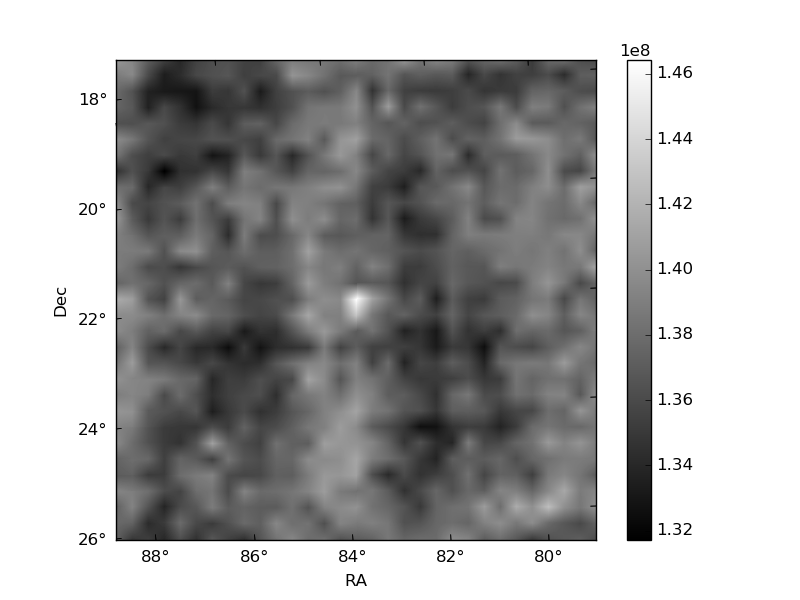
Histogram calculated using DETX and DETY for each event in the final _common_clean file
| Quadrant A | 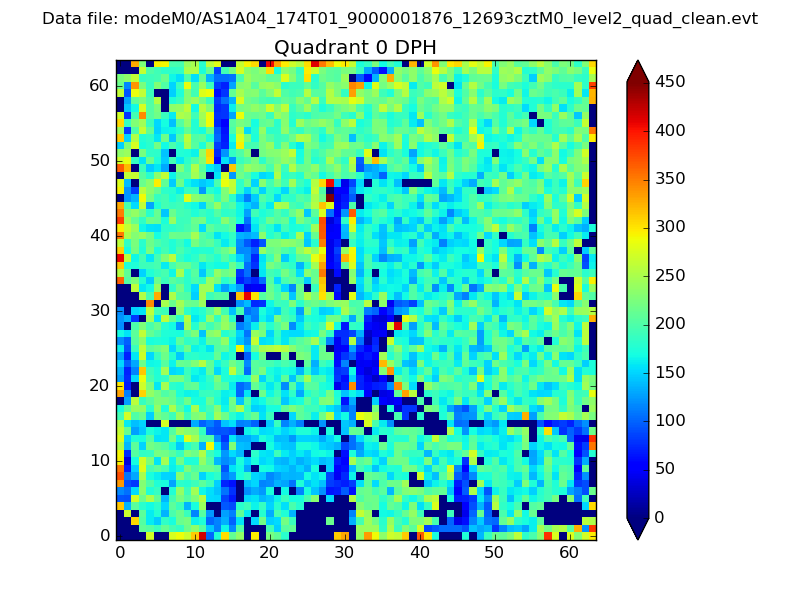 |
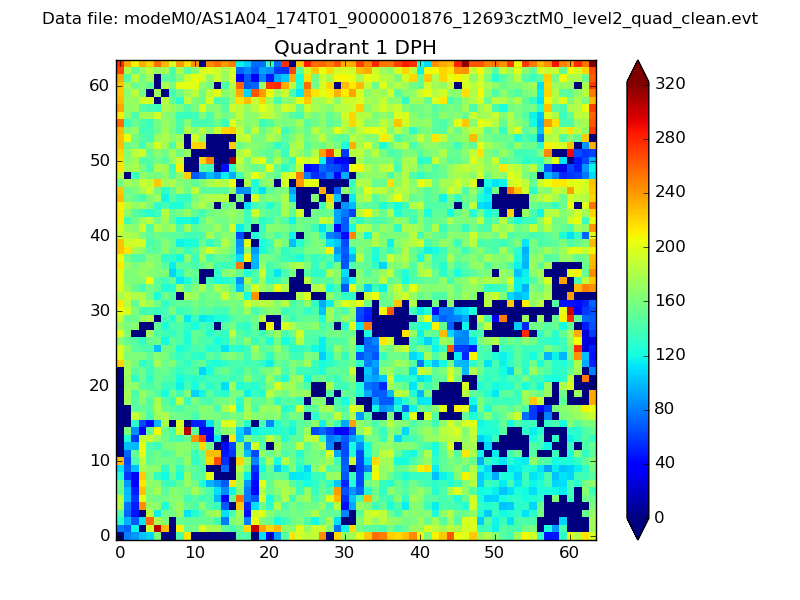 |
Quadrant B |
|---|---|---|---|
| Quadrant D | 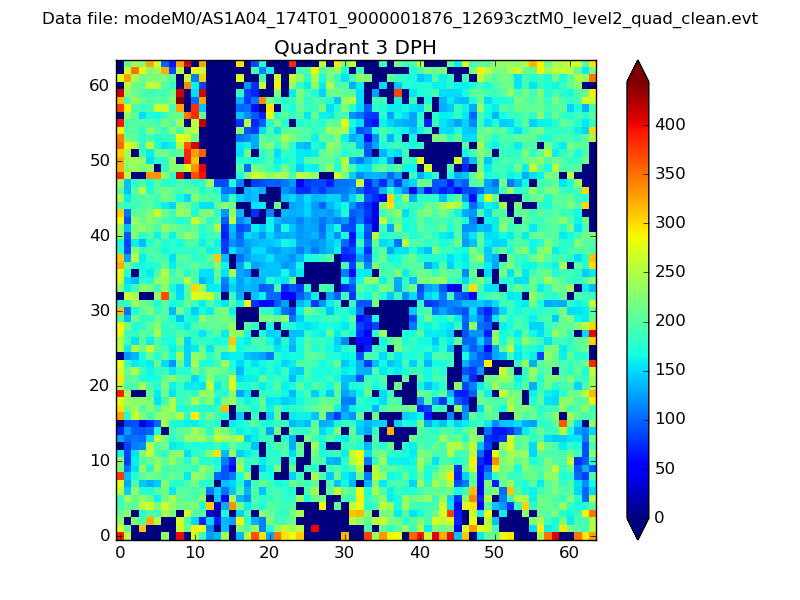 |
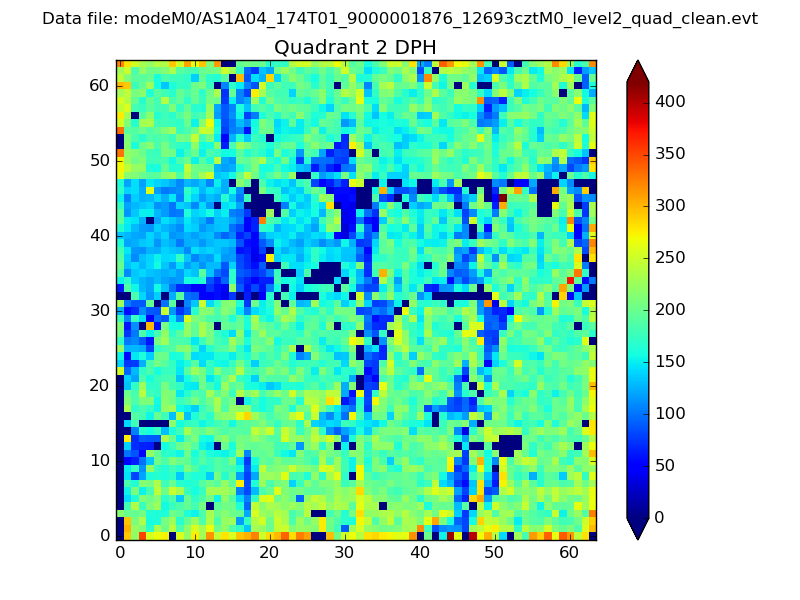 |
Quadrant C |
| Plot type | Count rate plots | Images |
|---|---|---|
| Comparison with Poisson distribution Blue bars denote a histogram of data divided into 1 sec bins. Red curve is a Poisson curve with rate = median count rate of data. |
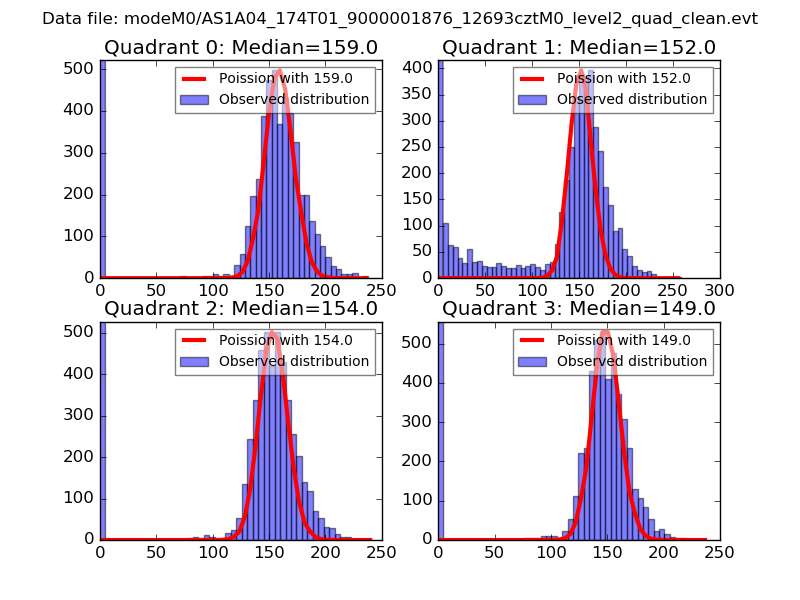 |
 |
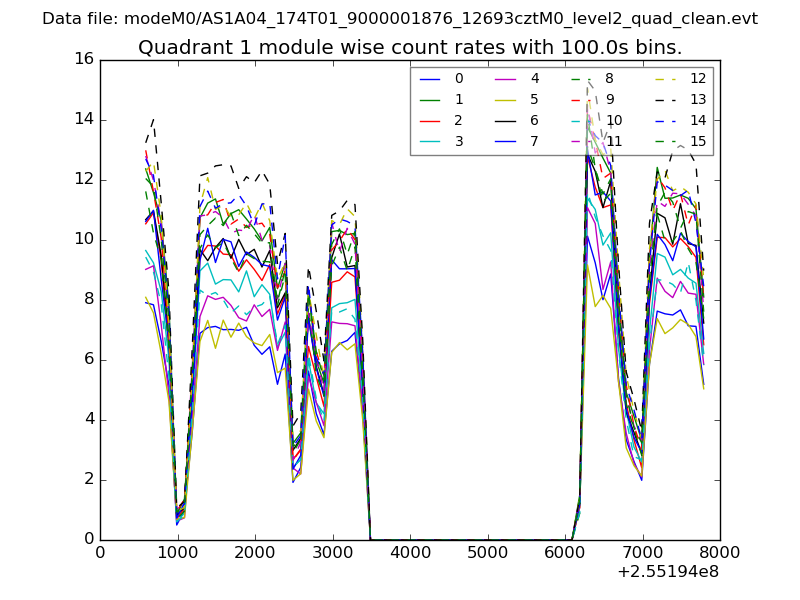
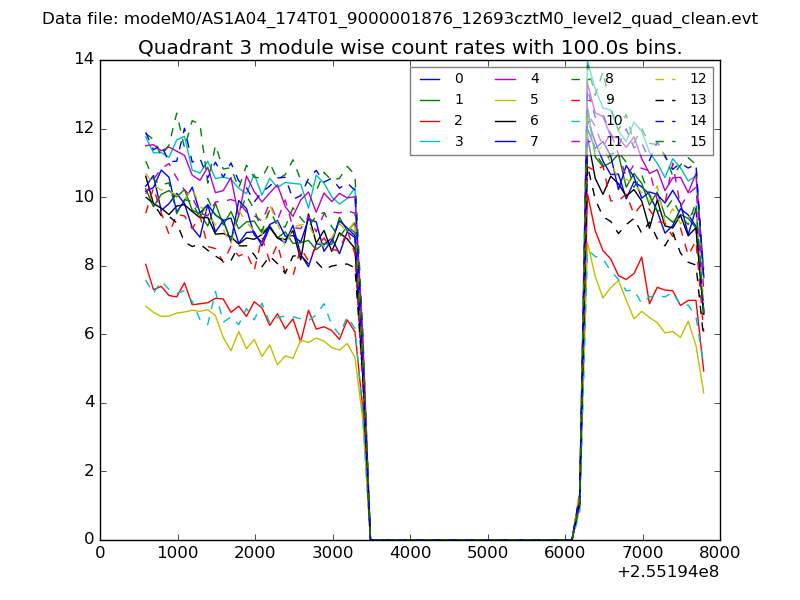
| Quadrant-wise count rates Data is divided into 100 sec bins |
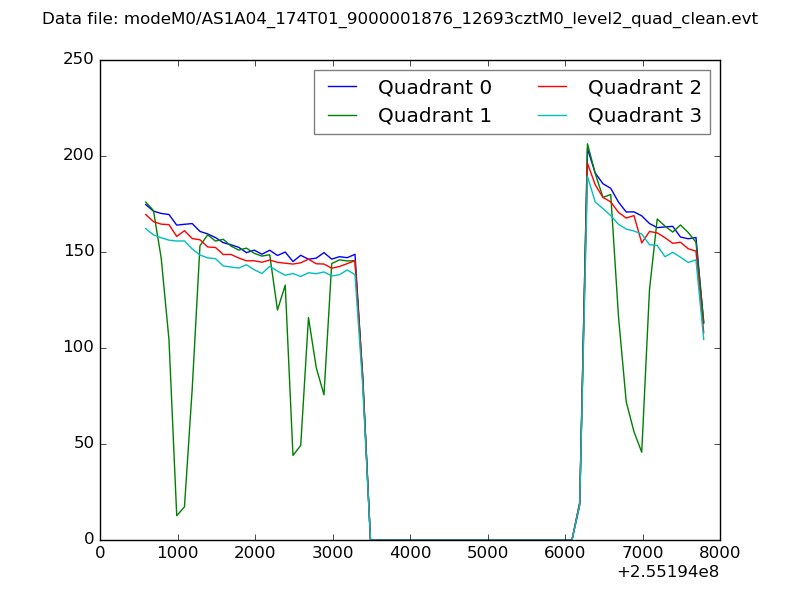 |
|
| Module-wise count rates for Quadrant A Data is divided into 100 sec bins |
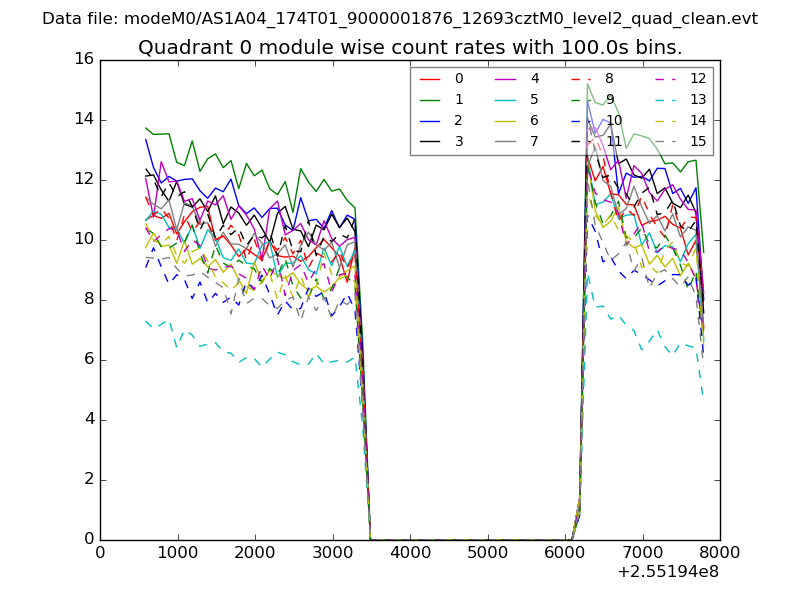 |
 |
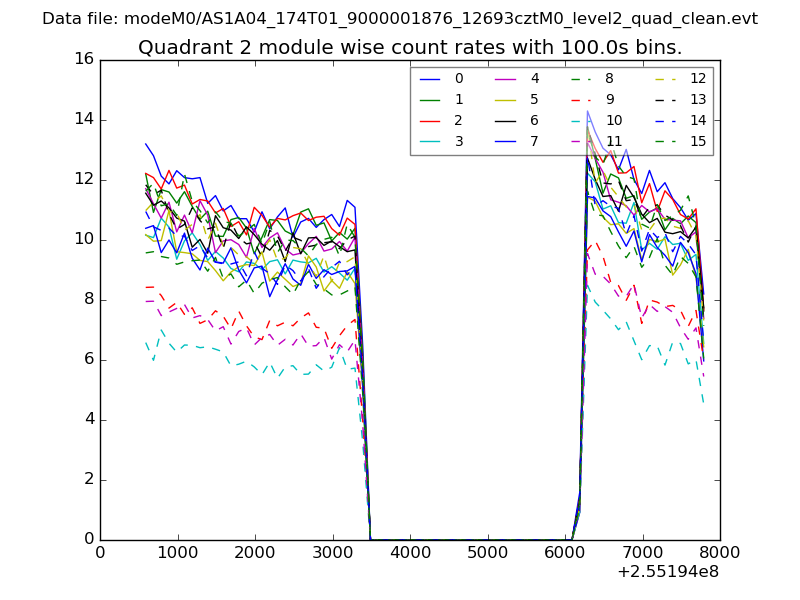
| Module-wise count rates for Quadrant B Data is divided into 100 sec bins |
 |
 |
| Module-wise count rates for Quadrant C Data is divided into 100 sec bins |
 |
 |
| Module-wise count rates for Quadrant D Data is divided into 100 sec bins |
 |
 |
| Parameter | Plot |
|---|---|
| CZT HV Monitor | 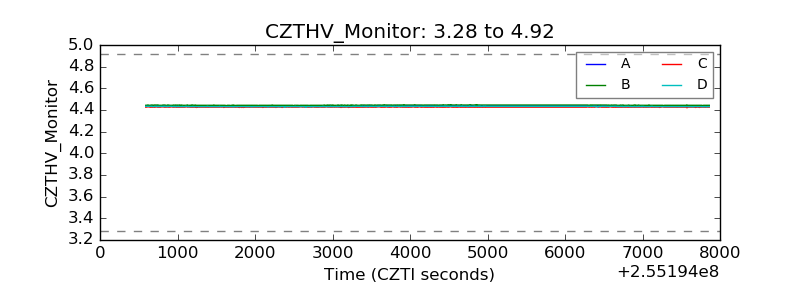 |
| D_VDD | 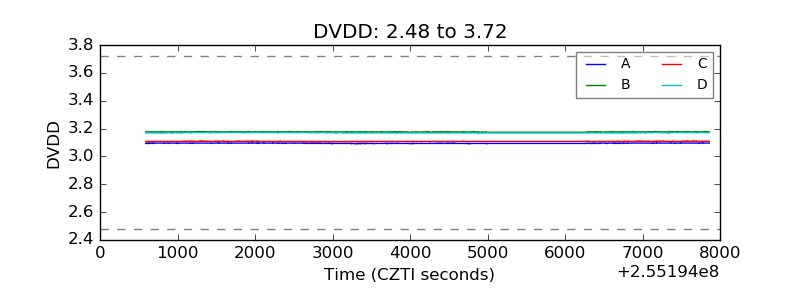 |
| Temperature 1 | 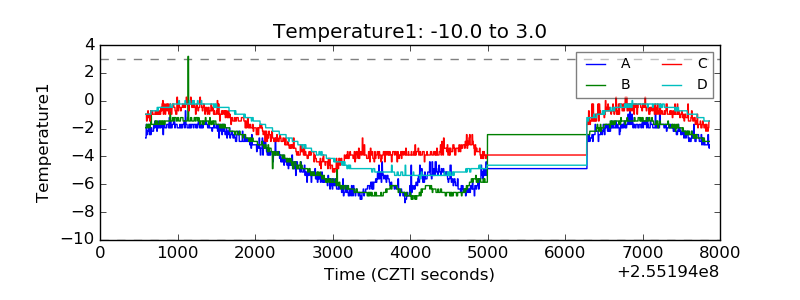 |
| Veto HV Monitor | 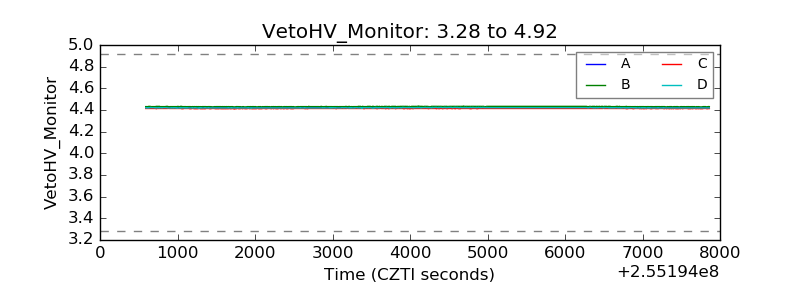 |
| Veto LLD | 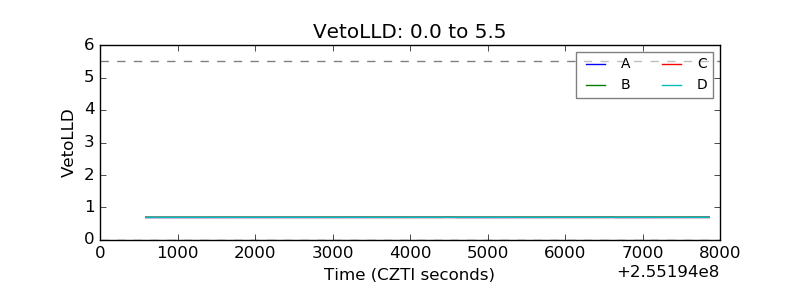 |
| Alpha Counter | 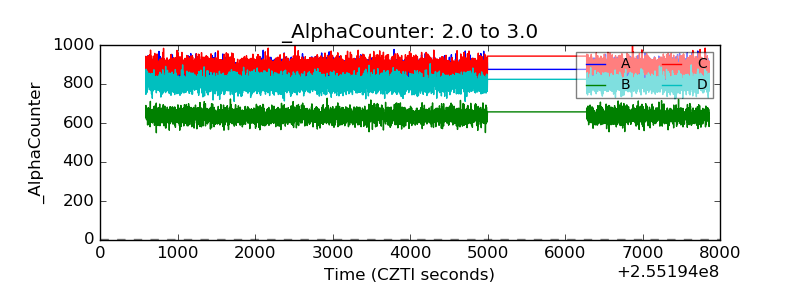 |
| _CPM_Rate | 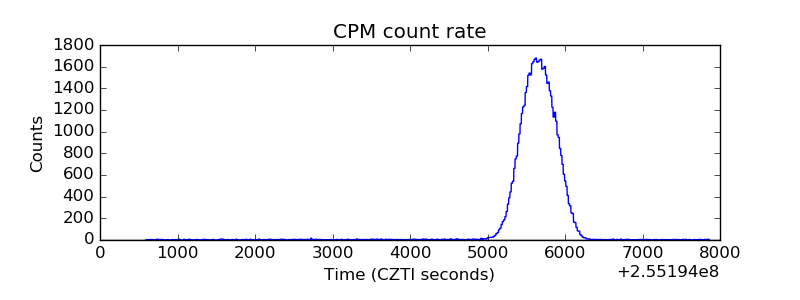 |
| CZT Counter | 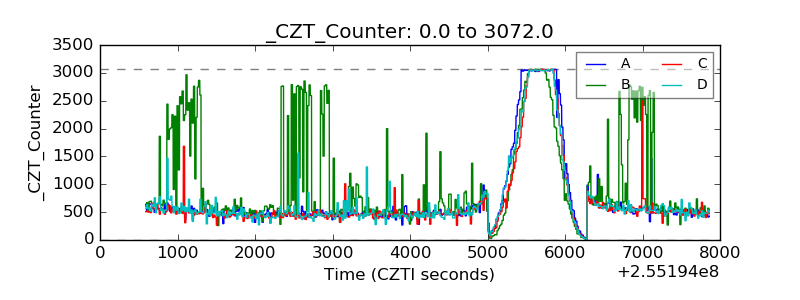 |
| +2.5 Volts monitor | 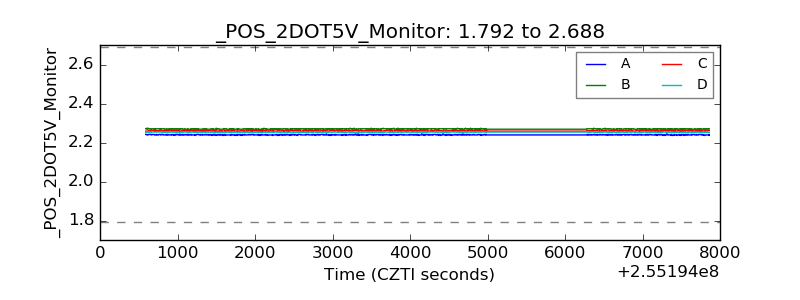 |
| +5 Volts monitor | 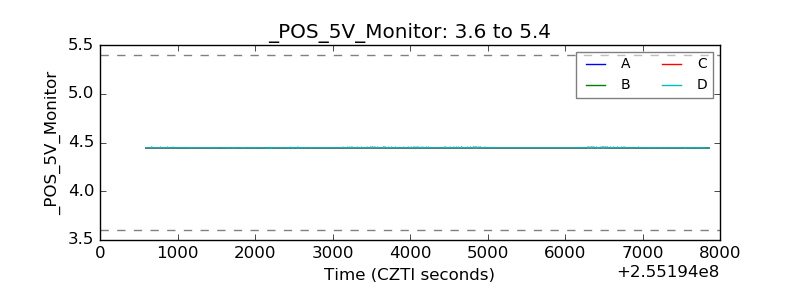 |
| _ROLL_ROT | 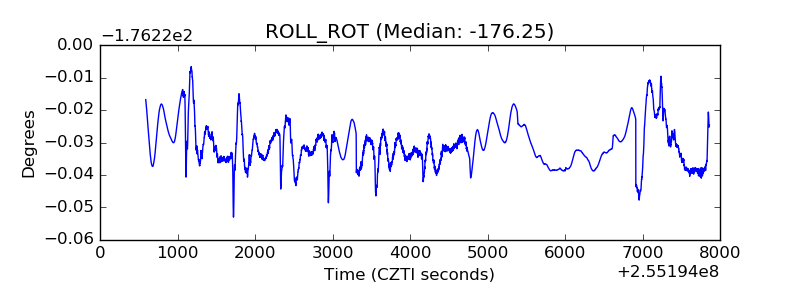 |
| _Roll_DEC | 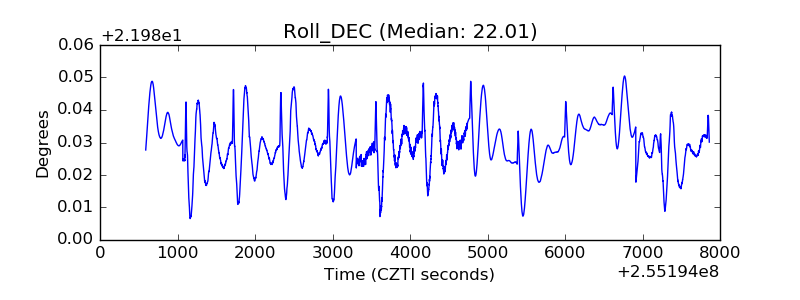 |
| _Roll_RA | 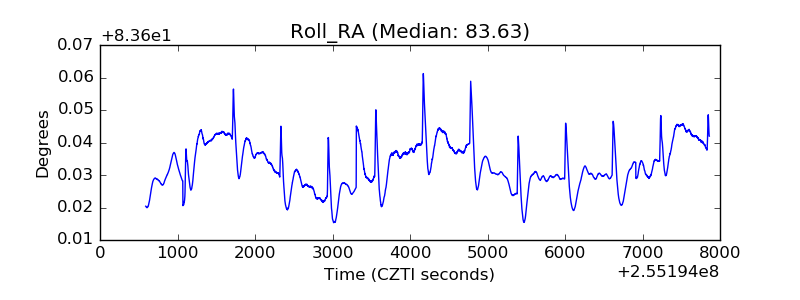 |
| Veto Counter | 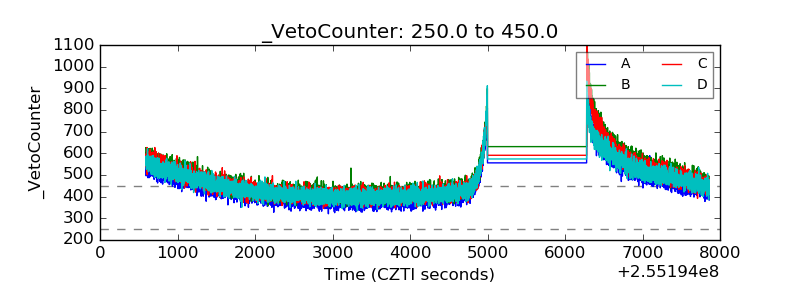 |