| Param | Original file | Final file |
|---|---|---|
| Filename | modeM0/AS1A04_174T01_9000001876_12695cztM0_level2.evt | modeM0/AS1A04_174T01_9000001876_12695cztM0_level2_quad_clean.evt |
| Size (bytes) | 484,004,160 | 83,378,880 |
| Size | 461.6 MB | 79.5 MB |
| Events in quadrant A | 2,906,263 | 558,661 |
| Events in quadrant B | 4,960,048 | 477,522 |
| Events in quadrant C | 2,861,088 | 551,606 |
| Events in quadrant D | 3,526,647 | 521,121 |
| Mode M9 | |||
|---|---|---|---|
| Quadrant | BADHDUFLAG | Total packets | Discarded packets |
| A | 0 | 13 | 0 |
| B | 0 | 13 | 0 |
| C | 0 | 13 | 0 |
| D | 0 | 13 | 0 |
| Mode M0 | |||
|---|---|---|---|
| Quadrant | BADHDUFLAG | Total packets | Discarded packets |
| A | 0 | 12419 | 2 |
| B | 0 | 18551 | 1 |
| C | 0 | 12304 | 1 |
| D | 0 | 14305 | 1 |
| Mode SS | |||
|---|---|---|---|
| Quadrant | BADHDUFLAG | Total packets | Discarded packets |
| A | 0 | 120 | 0 |
| B | 0 | 120 | 0 |
| C | 0 | 120 | 0 |
| D | 0 | 120 | 0 |
| Quadrant | Total seconds | Saturated seconds | Saturation percentage |
|---|---|---|---|
| A | 5953 | 42 | 0.705527% |
| B | 5953 | 822 | 13.808164% |
| C | 5953 | 30 | 0.503948% |
| D | 5953 | 139 | 2.334957% |
Noise dominated data is calculated using 1-second bins in cleaned event files. If a bin has >2000 counts, and if more than 50% of those come from <1% of pixels, then it is considered to be noise-dominated and hence unusable.
| Quadrant | # 1 sec bins | Bins with >0 counts | Bins with >2000 counts | High rate bins dominated by noise | Noise dominated (total time) | Noise dominated (detector-on time) | Marked lightcurve |
|---|---|---|---|---|---|---|---|
| A | 7194 | 5957 | 0 | 0 | 0.00% | 0.00% | 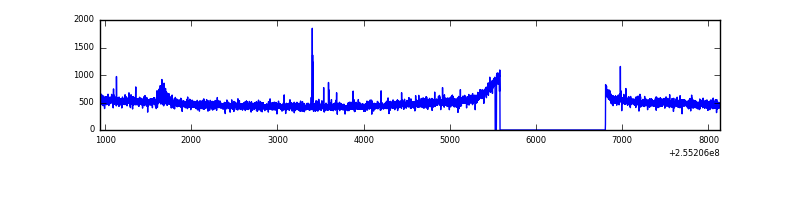 |
| B | 7194 | 5956 | 600 | 600 | 8.34% | 10.07% | 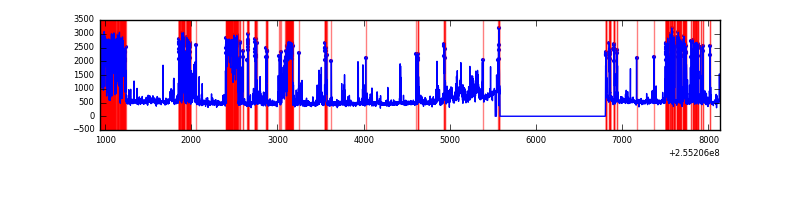 |
| C | 7194 | 5957 | 1 | 1 | 0.01% | 0.02% | 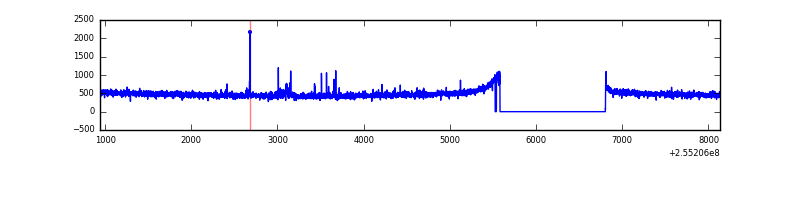 |
| D | 7194 | 5956 | 105 | 105 | 1.46% | 1.76% | 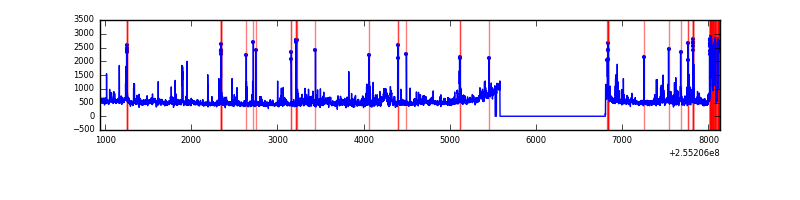 |
Top three noisy pixels from each quadrant. If the there are fewer than three noisy pixels in the level2.evt file, extra rows are filled as -1
| Pixel properties | Quadrant properties | ||||||
|---|---|---|---|---|---|---|---|
| Quadrant | DetID | PixID | Counts | Sigma | Mean | Median | Sigma |
| A | 8 | 15 | 23804 | 153.66 | 743 | 729 | 150.2 |
| A | 12 | 189 | 18900 | 121.0 | 743 | 729 | 150.2 |
| A | 7 | 16 | 9219 | 56.54 | 743 | 729 | 150.2 |
| B | 4 | 239 | 2029364 | 15904.78 | 676 | 665 | 127.6 |
| B | 0 | 85 | 200560 | 1567.16 | 676 | 665 | 127.6 |
| B | 0 | 219 | 29499 | 226.06 | 676 | 665 | 127.6 |
| C | 15 | 208 | 47518 | 278.17 | 721 | 730 | 168.2 |
| C | 13 | 61 | 5382 | 27.66 | 721 | 730 | 168.2 |
| C | 1 | 5 | 3335 | 15.49 | 721 | 730 | 168.2 |
| D | 1 | 52 | 740759 | 4297.61 | 714 | 696 | 172.2 |
| D | 10 | 157 | 31712 | 180.11 | 714 | 696 | 172.2 |
| D | 2 | 234 | 23058 | 129.86 | 714 | 696 | 172.2 |
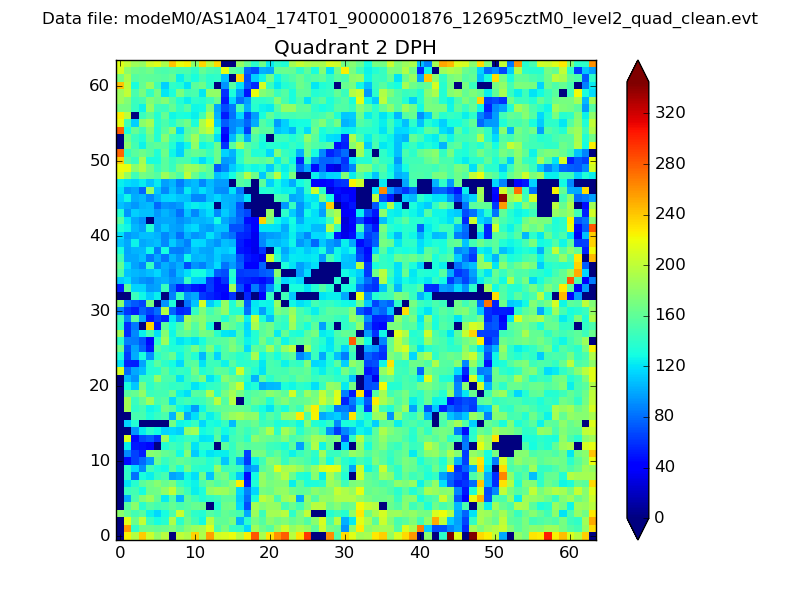
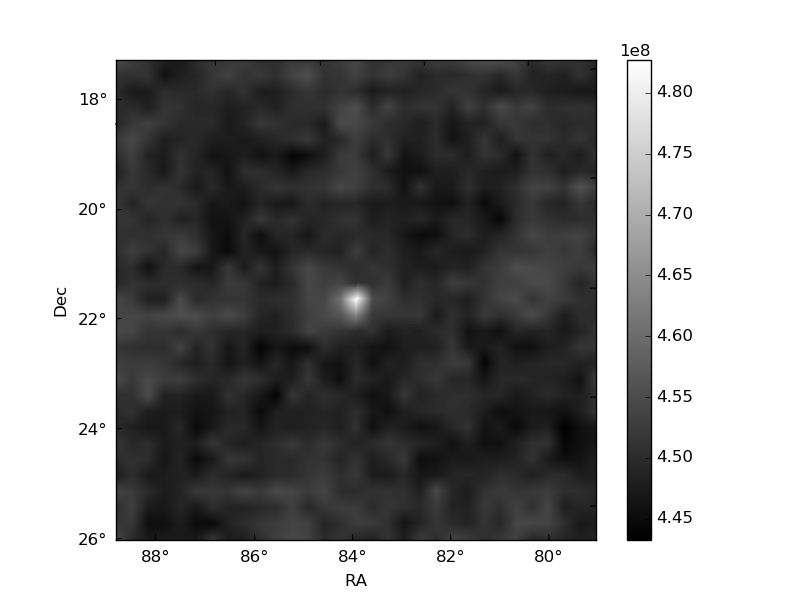
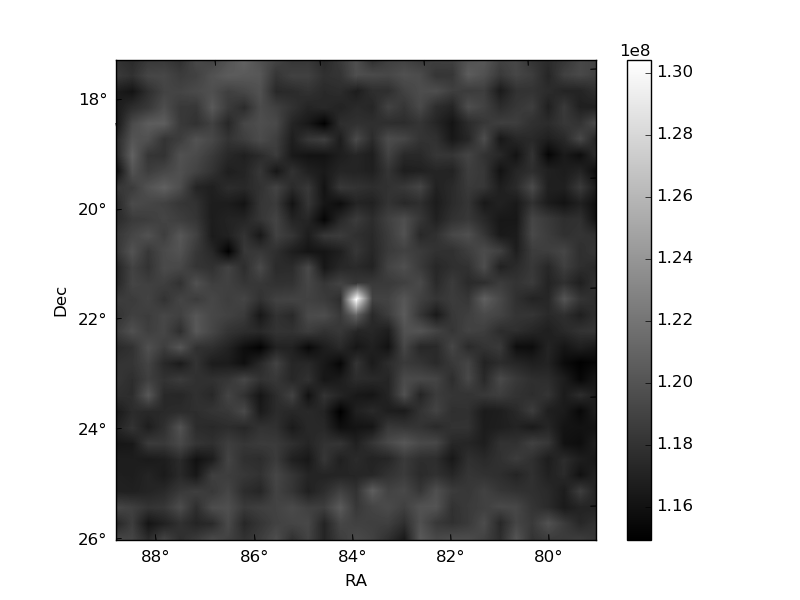
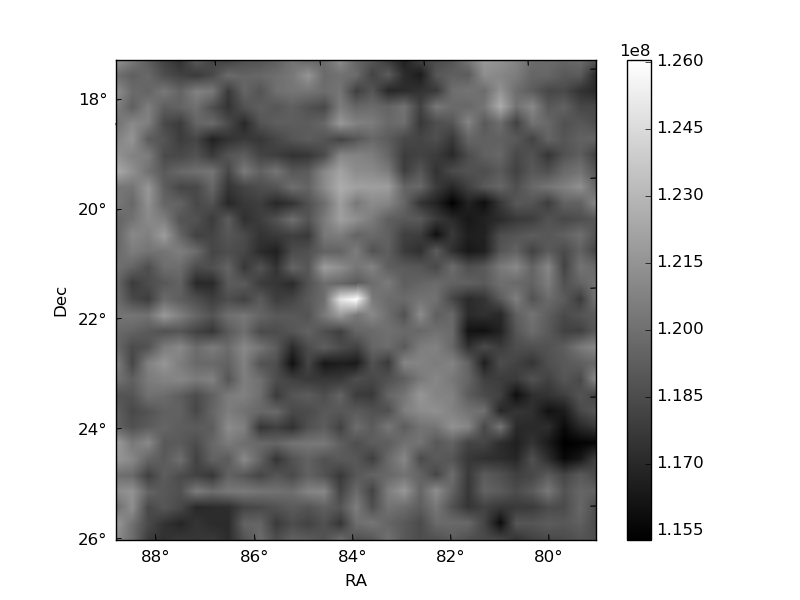
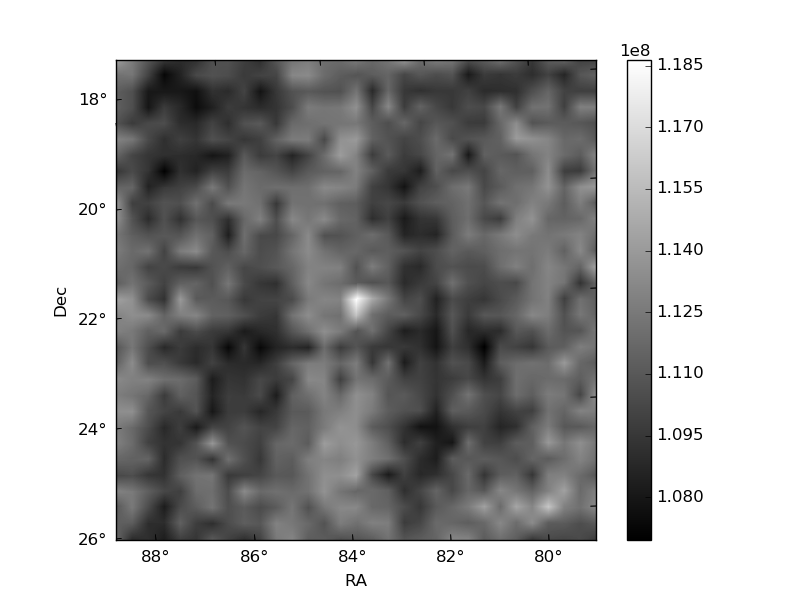
Histogram calculated using DETX and DETY for each event in the final _common_clean file
| Quadrant A | 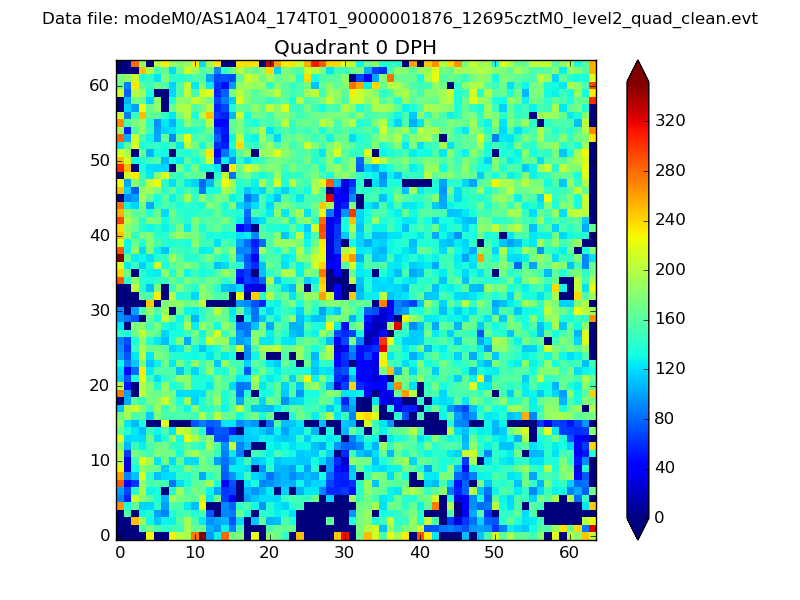 |
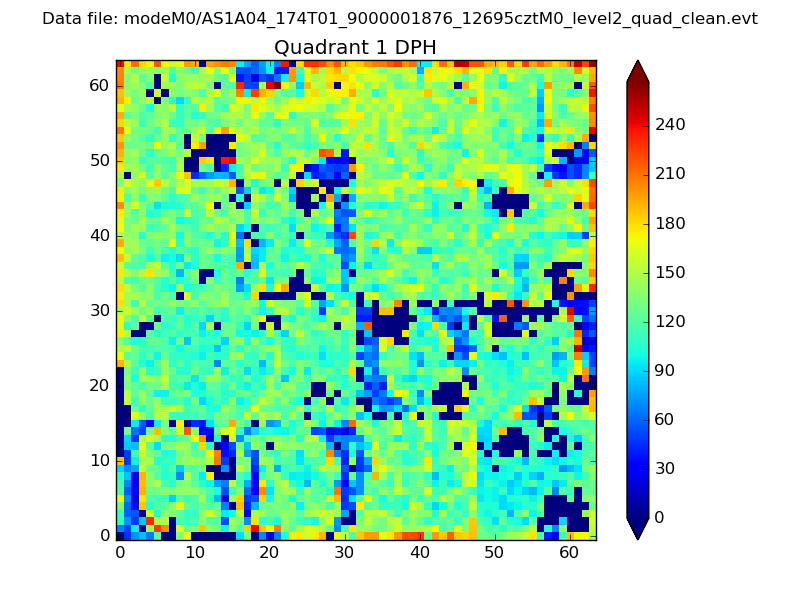 |
Quadrant B |
|---|---|---|---|
| Quadrant D | 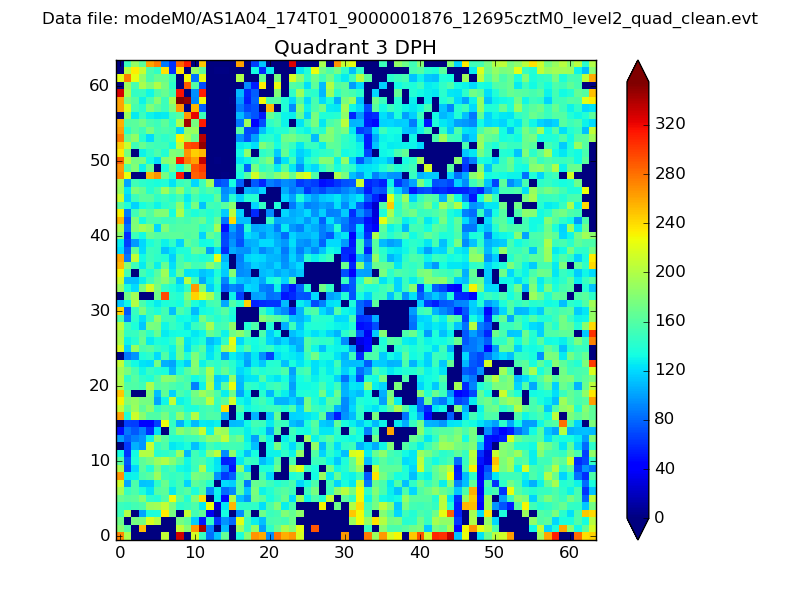 |
 |
Quadrant C |
| Plot type | Count rate plots | Images |
|---|---|---|
| Comparison with Poisson distribution Blue bars denote a histogram of data divided into 1 sec bins. Red curve is a Poisson curve with rate = median count rate of data. |
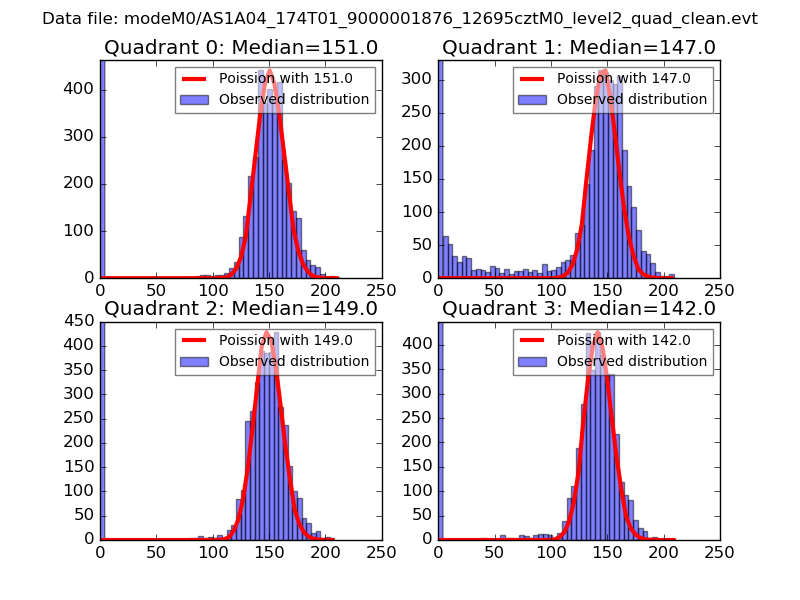 |
 |
| Quadrant-wise count rates Data is divided into 100 sec bins |
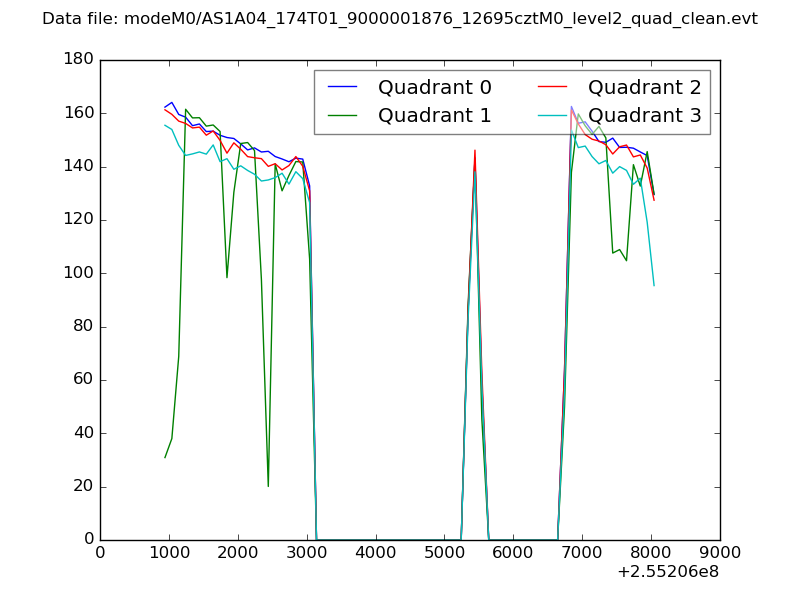 |
|
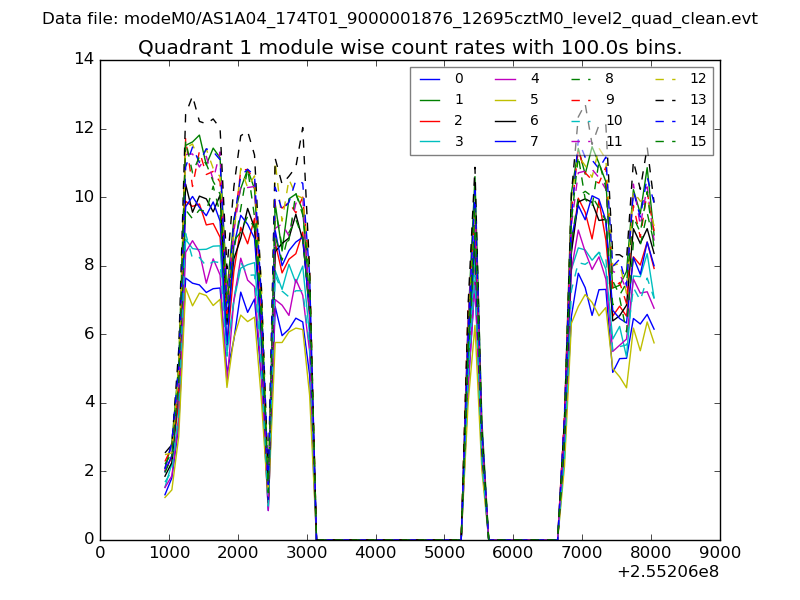
| Module-wise count rates for Quadrant A Data is divided into 100 sec bins |
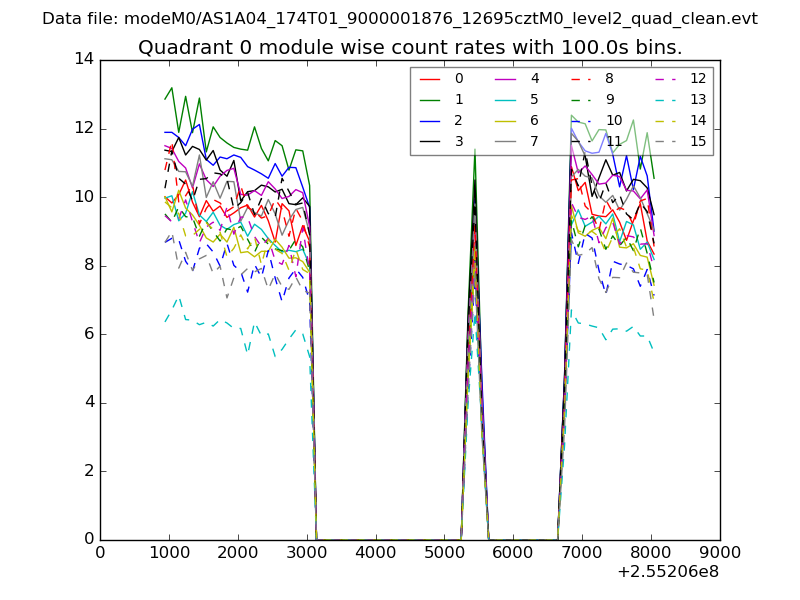 |
 |
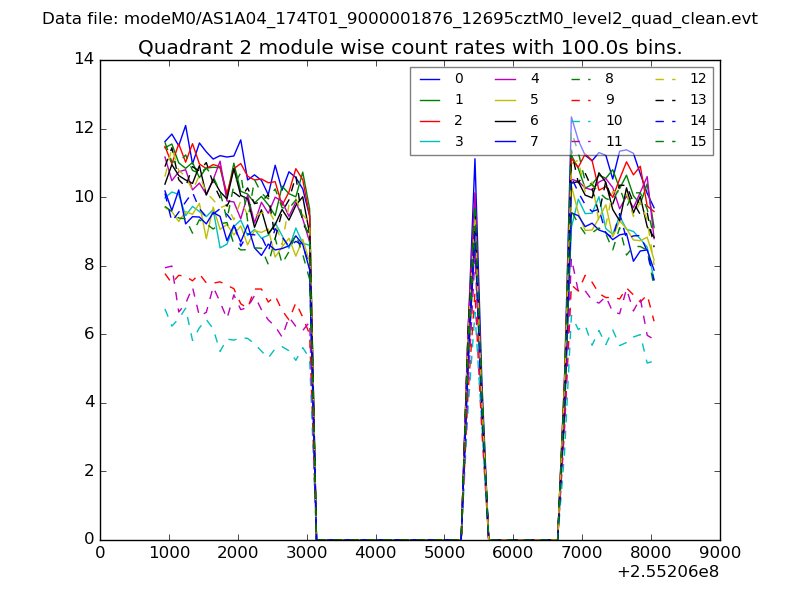
| Module-wise count rates for Quadrant B Data is divided into 100 sec bins |
 |
 |
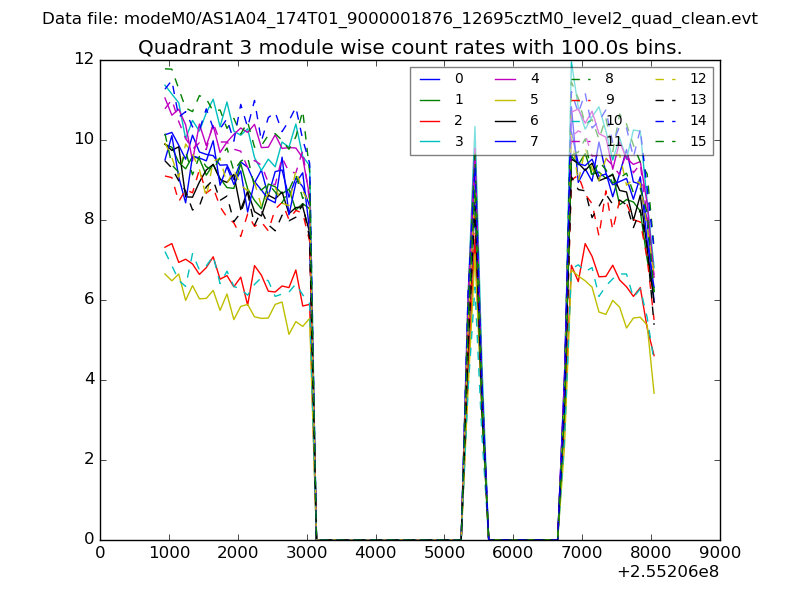
| Module-wise count rates for Quadrant C Data is divided into 100 sec bins |
 |
 |
| Module-wise count rates for Quadrant D Data is divided into 100 sec bins |
 |
 |
| Parameter | Plot |
|---|---|
| CZT HV Monitor | 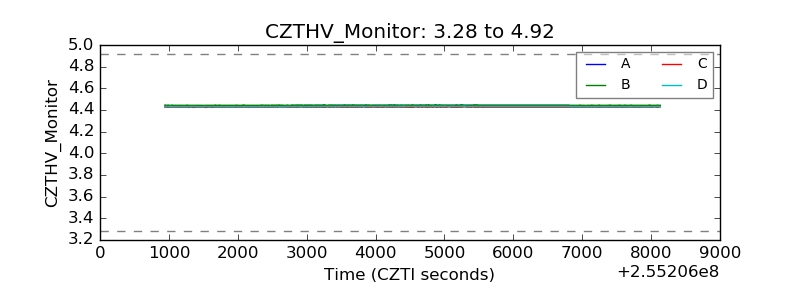 |
| D_VDD |  |
| Temperature 1 | 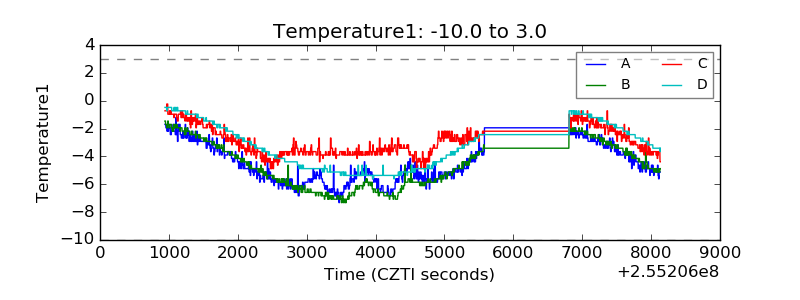 |
| Veto HV Monitor | 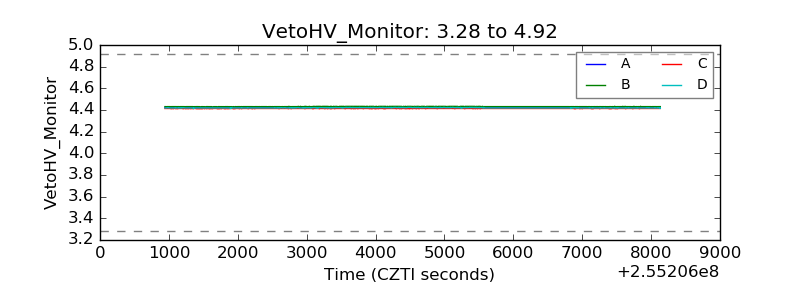 |
| Veto LLD | 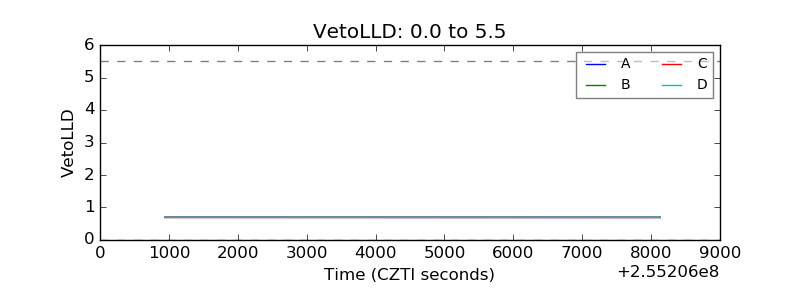 |
| Alpha Counter | 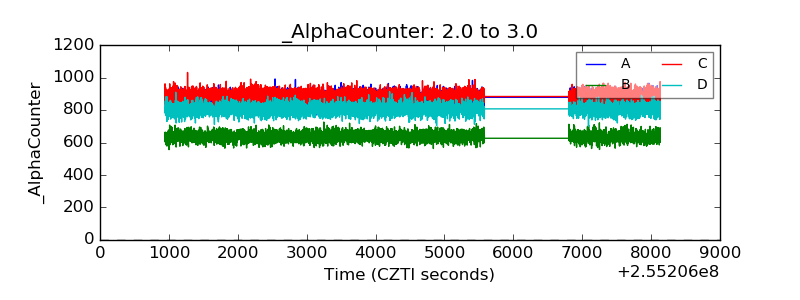 |
| _CPM_Rate | 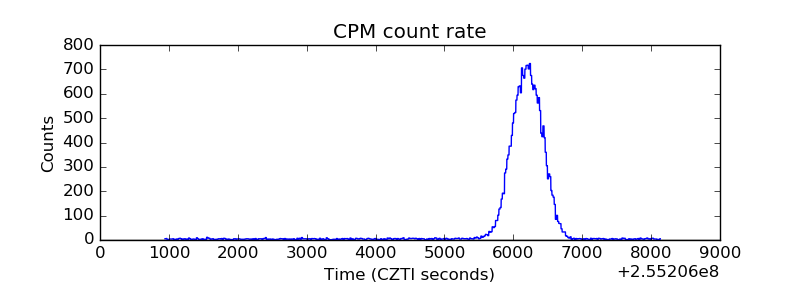 |
| CZT Counter | 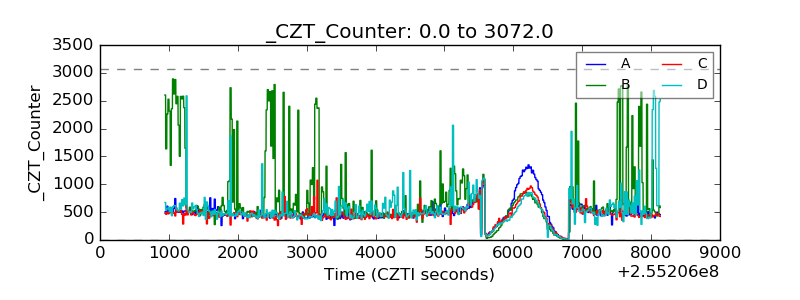 |
| +2.5 Volts monitor |  |
| +5 Volts monitor |  |
| _ROLL_ROT | 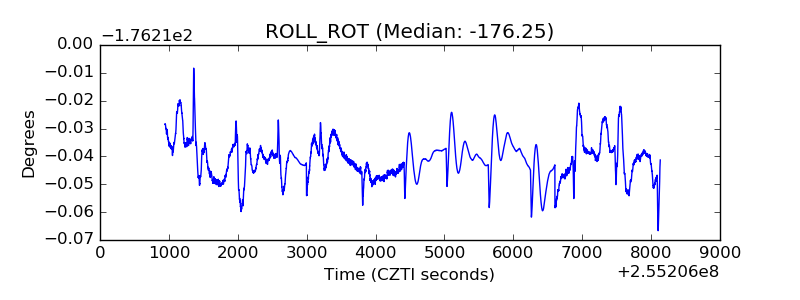 |
| _Roll_DEC | 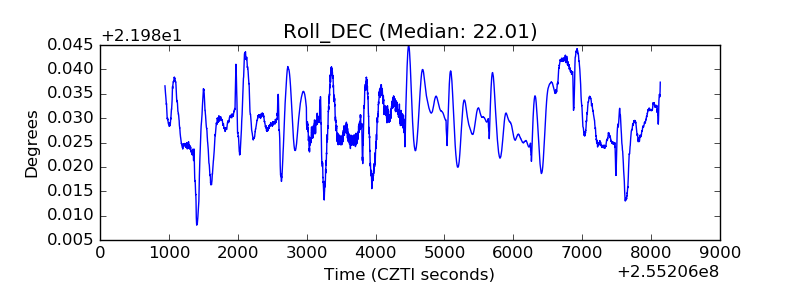 |
| _Roll_RA | 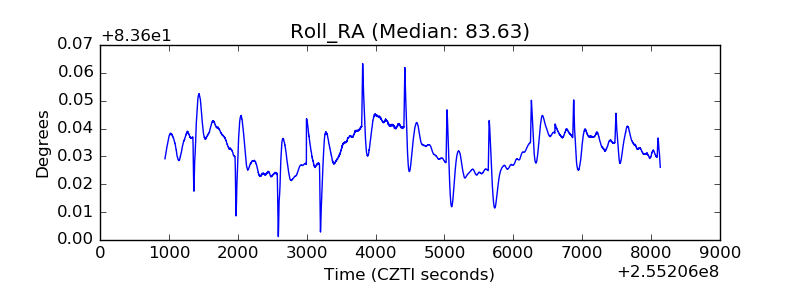 |
| Veto Counter | 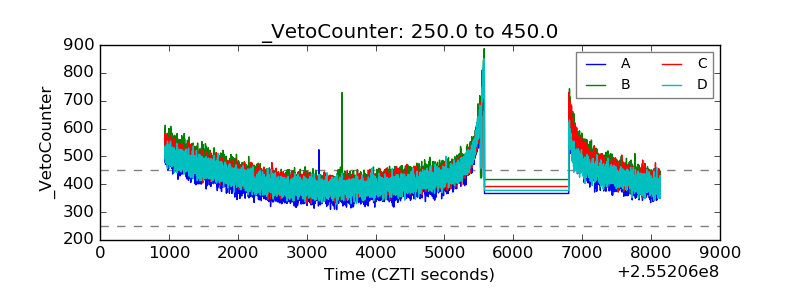 |