| Param | Original file | Final file |
|---|---|---|
| Filename | modeM0/AS1A04_174T01_9000001876_12696cztM0_level2.evt | modeM0/AS1A04_174T01_9000001876_12696cztM0_level2_quad_clean.evt |
| Size (bytes) | 519,822,720 | 86,529,600 |
| Size | 495.7 MB | 82.5 MB |
| Events in quadrant A | 2,937,383 | 578,652 |
| Events in quadrant B | 5,681,748 | 506,680 |
| Events in quadrant C | 2,895,922 | 573,407 |
| Events in quadrant D | 3,805,829 | 527,280 |
| Mode M9 | |||
|---|---|---|---|
| Quadrant | BADHDUFLAG | Total packets | Discarded packets |
| A | 0 | 10 | 0 |
| B | 0 | 10 | 0 |
| C | 0 | 10 | 0 |
| D | 0 | 10 | 0 |
| Mode M0 | |||
|---|---|---|---|
| Quadrant | BADHDUFLAG | Total packets | Discarded packets |
| A | 0 | 12803 | 2 |
| B | 0 | 21033 | 1 |
| C | 0 | 12762 | 1 |
| D | 0 | 15394 | 1 |
| Mode SS | |||
|---|---|---|---|
| Quadrant | BADHDUFLAG | Total packets | Discarded packets |
| A | 0 | 126 | 0 |
| B | 0 | 126 | 0 |
| C | 0 | 126 | 0 |
| D | 0 | 126 | 0 |
| Quadrant | Total seconds | Saturated seconds | Saturation percentage |
|---|---|---|---|
| A | 6218 | 22 | 0.353812% |
| B | 6218 | 965 | 15.519460% |
| C | 6218 | 14 | 0.225153% |
| D | 6218 | 243 | 3.908009% |
Noise dominated data is calculated using 1-second bins in cleaned event files. If a bin has >2000 counts, and if more than 50% of those come from <1% of pixels, then it is considered to be noise-dominated and hence unusable.
| Quadrant | # 1 sec bins | Bins with >0 counts | Bins with >2000 counts | High rate bins dominated by noise | Noise dominated (total time) | Noise dominated (detector-on time) | Marked lightcurve |
|---|---|---|---|---|---|---|---|
| A | 7179 | 6220 | 0 | 0 | 0.00% | 0.00% | 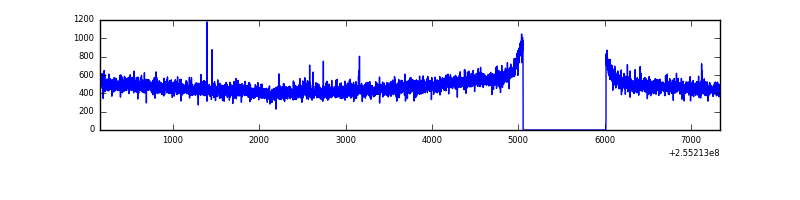 |
| B | 7179 | 6220 | 762 | 762 | 10.61% | 12.25% | 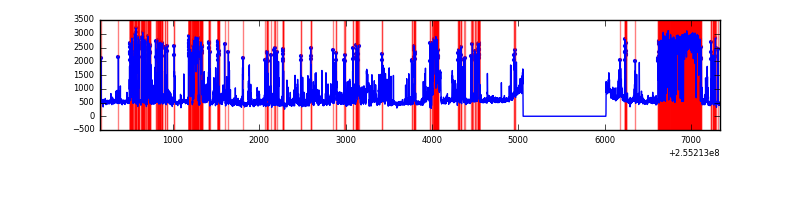 |
| C | 7179 | 6220 | 0 | 0 | 0.00% | 0.00% | 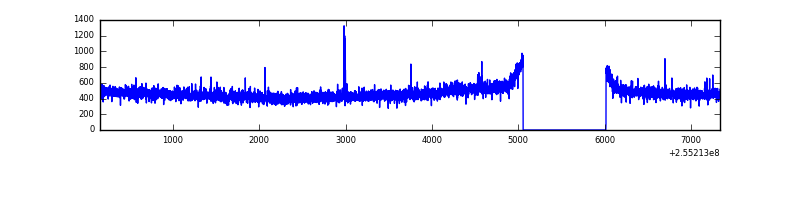 |
| D | 7179 | 6220 | 223 | 223 | 3.11% | 3.59% | 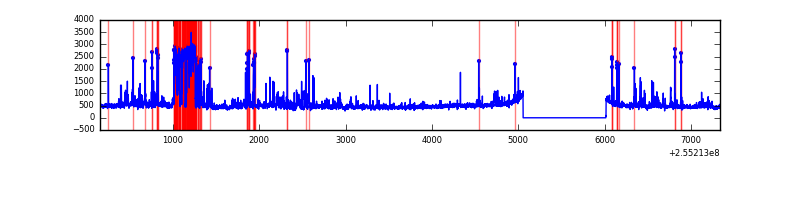 |
Top three noisy pixels from each quadrant. If the there are fewer than three noisy pixels in the level2.evt file, extra rows are filled as -1
| Pixel properties | Quadrant properties | ||||||
|---|---|---|---|---|---|---|---|
| Quadrant | DetID | PixID | Counts | Sigma | Mean | Median | Sigma |
| A | 12 | 189 | 21538 | 134.76 | 756 | 740 | 154.3 |
| A | 8 | 15 | 10924 | 65.99 | 756 | 740 | 154.3 |
| A | 0 | 226 | 6740 | 38.88 | 756 | 740 | 154.3 |
| B | 4 | 239 | 2272569 | 17213.68 | 694 | 679 | 132.0 |
| B | 0 | 85 | 333229 | 2519.67 | 694 | 679 | 132.0 |
| B | 3 | 64 | 207282 | 1565.39 | 694 | 679 | 132.0 |
| C | 15 | 208 | 27291 | 154.85 | 735 | 741 | 171.4 |
| C | 13 | 61 | 5421 | 27.29 | 735 | 741 | 171.4 |
| C | 14 | 234 | 3591 | 16.62 | 735 | 741 | 171.4 |
| D | 1 | 52 | 988968 | 5283.82 | 712 | 701 | 187.0 |
| D | 8 | 195 | 57731 | 304.91 | 712 | 701 | 187.0 |
| D | 2 | 234 | 24036 | 124.76 | 712 | 701 | 187.0 |
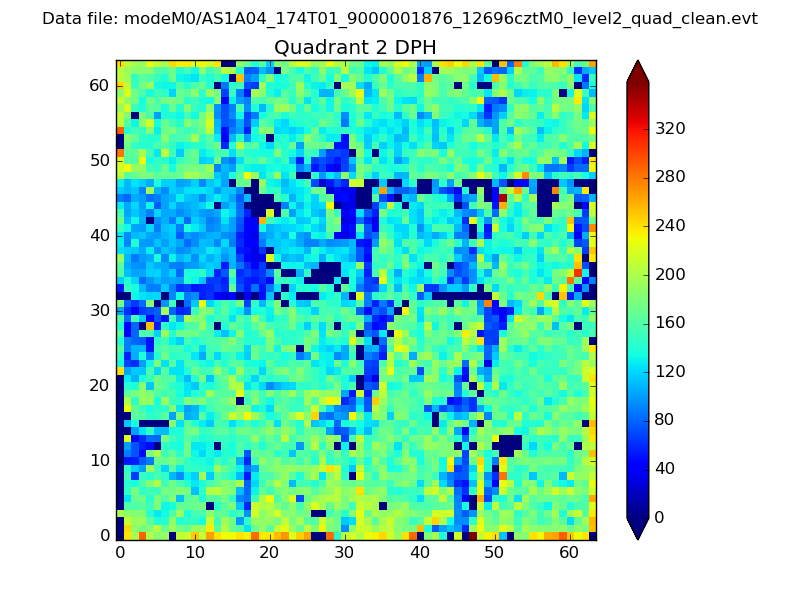
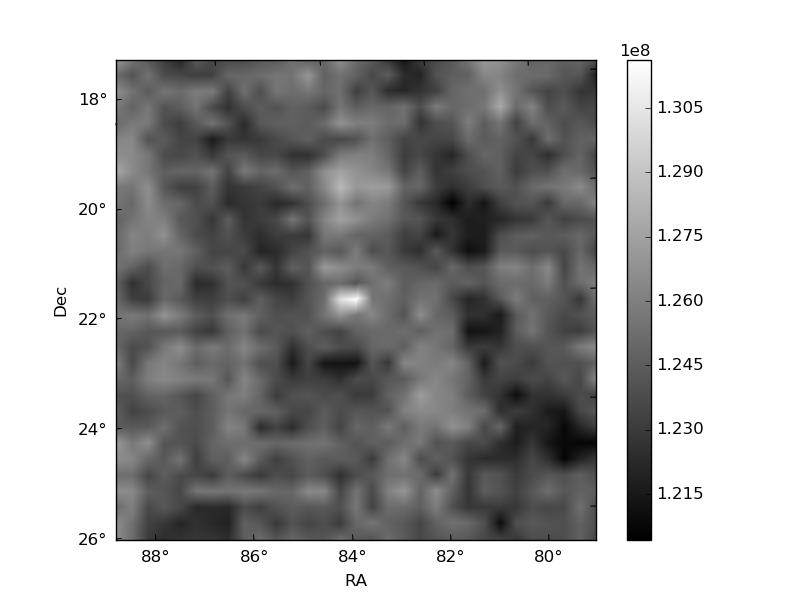
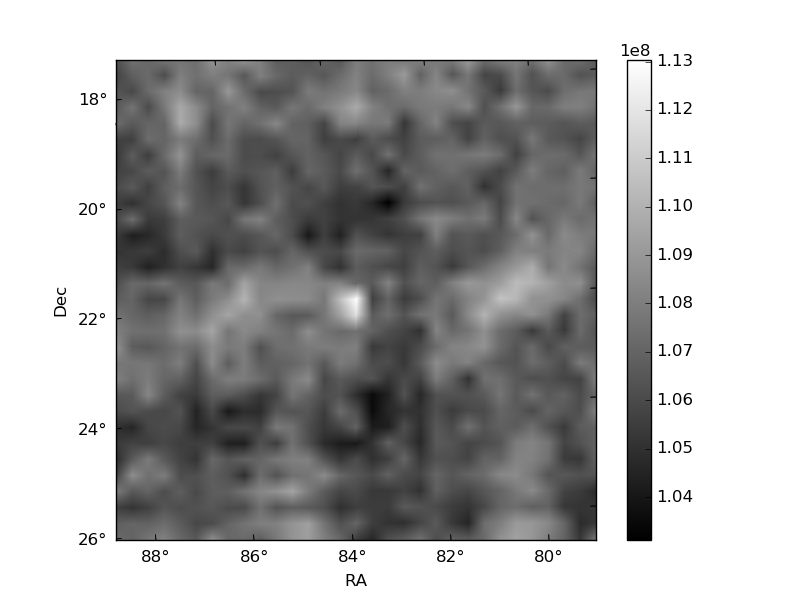
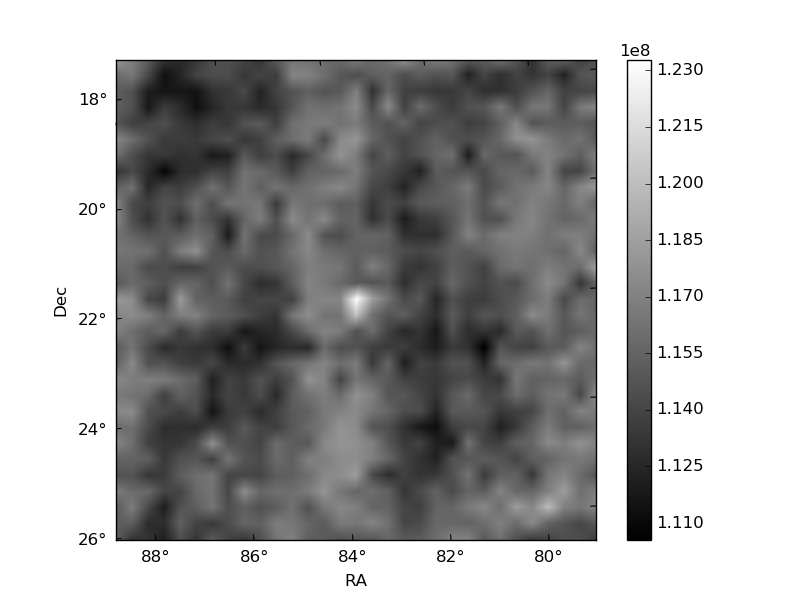
Histogram calculated using DETX and DETY for each event in the final _common_clean file
| Quadrant A |  |
 |
Quadrant B |
|---|---|---|---|
| Quadrant D | 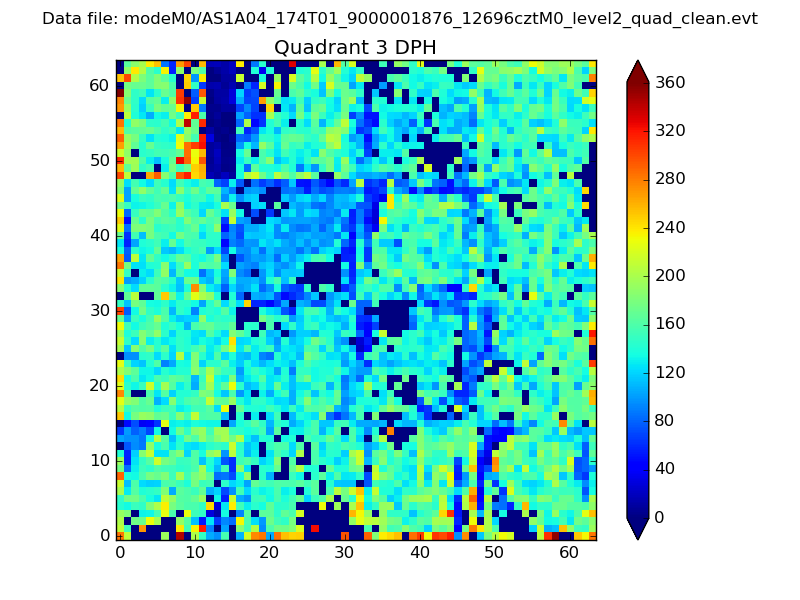 |
 |
Quadrant C |
| Plot type | Count rate plots | Images |
|---|---|---|
| Comparison with Poisson distribution Blue bars denote a histogram of data divided into 1 sec bins. Red curve is a Poisson curve with rate = median count rate of data. |
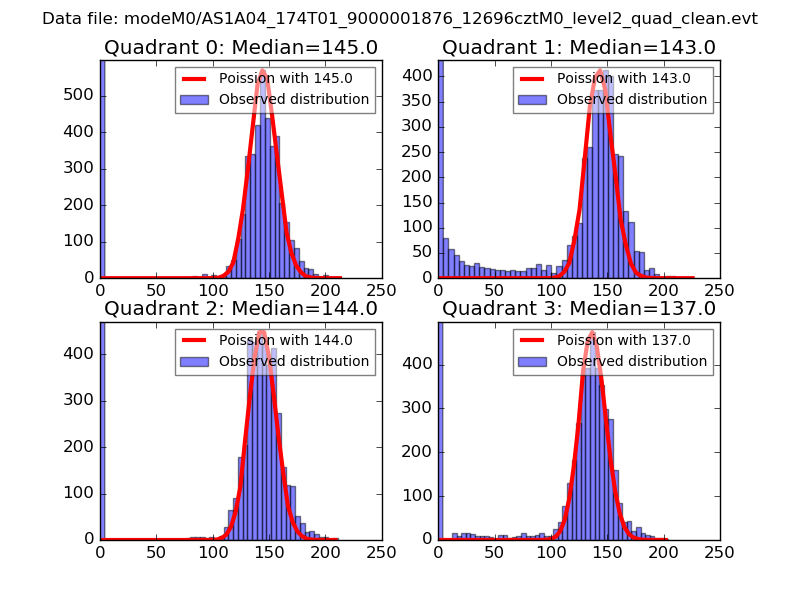 |
 |
| Quadrant-wise count rates Data is divided into 100 sec bins |
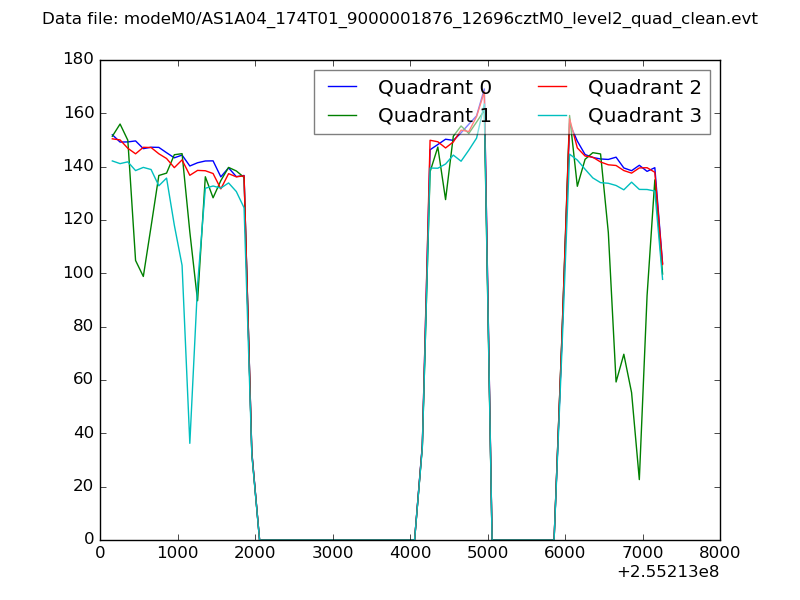 |
|
| Module-wise count rates for Quadrant A Data is divided into 100 sec bins |
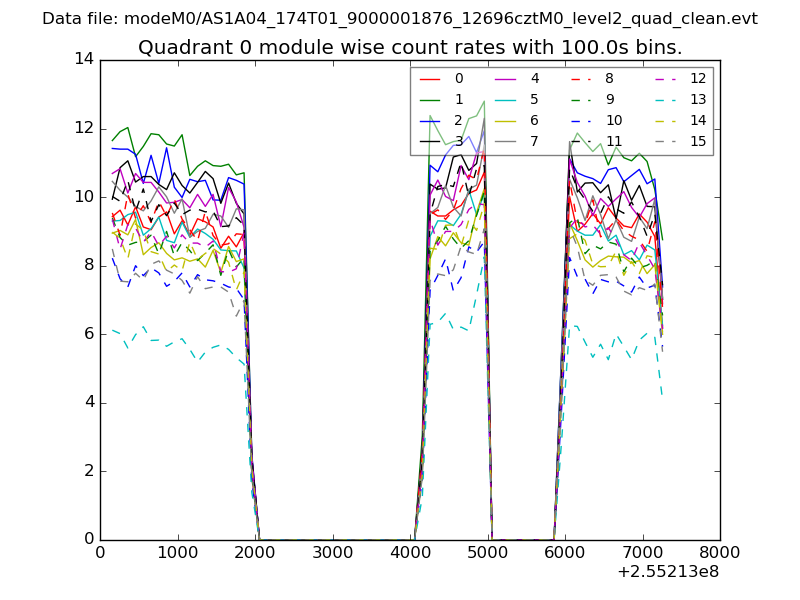 |
 |
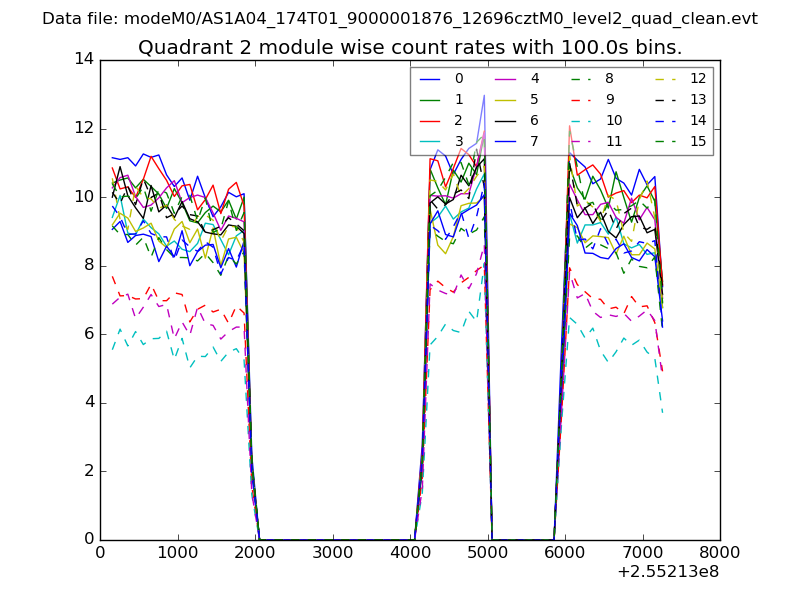
| Module-wise count rates for Quadrant B Data is divided into 100 sec bins |
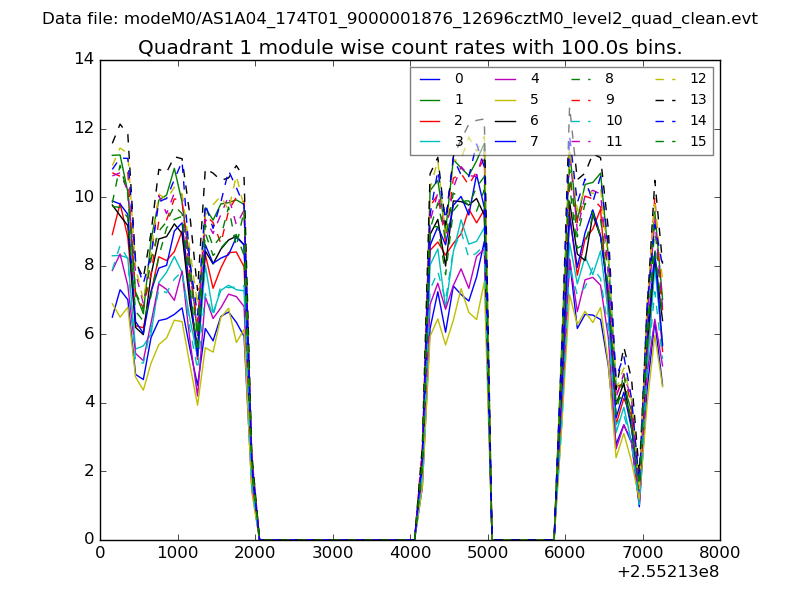 |
 |
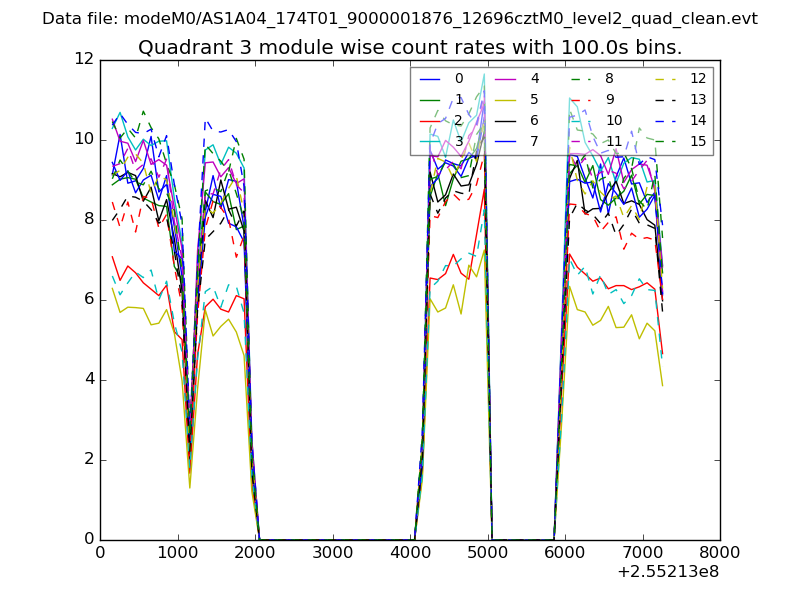
| Module-wise count rates for Quadrant C Data is divided into 100 sec bins |
 |
 |
| Module-wise count rates for Quadrant D Data is divided into 100 sec bins |
 |
 |
| Parameter | Plot |
|---|---|
| CZT HV Monitor | 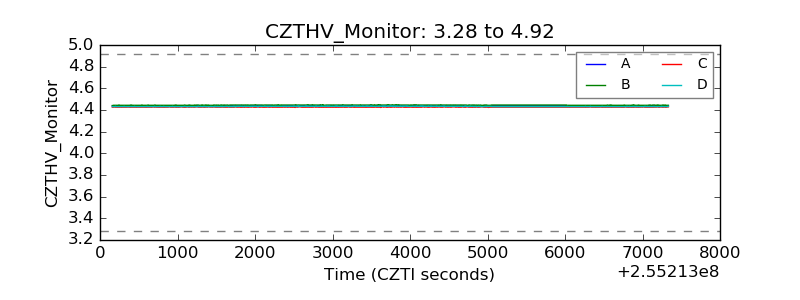 |
| D_VDD | 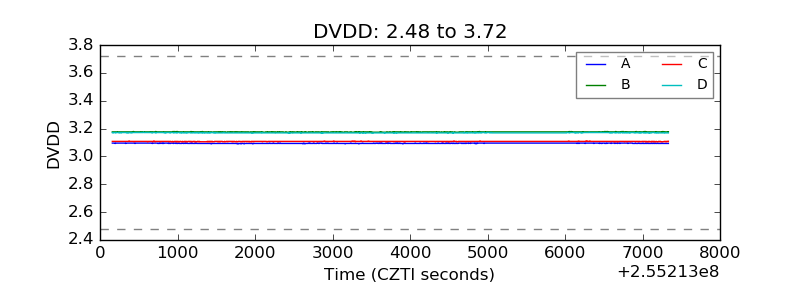 |
| Temperature 1 | 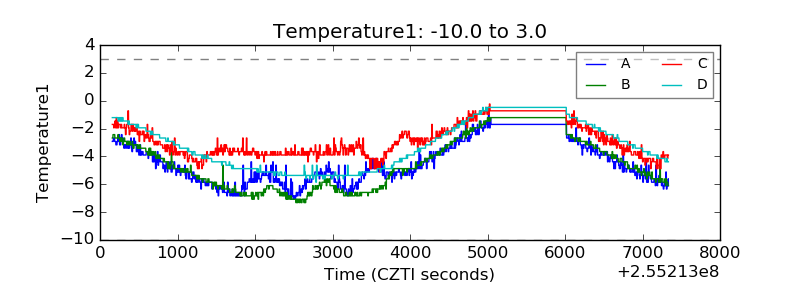 |
| Veto HV Monitor | 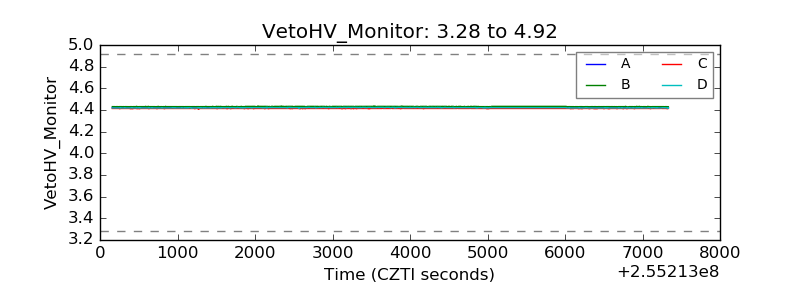 |
| Veto LLD | 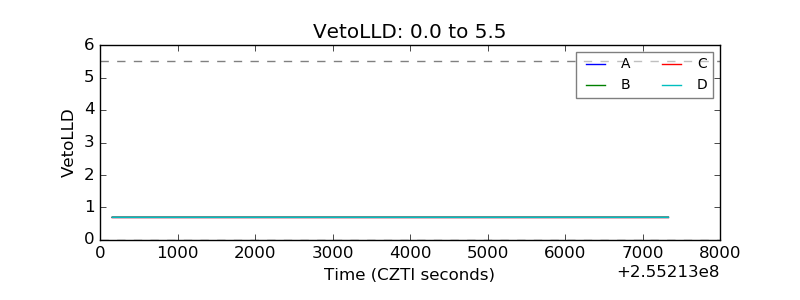 |
| Alpha Counter | 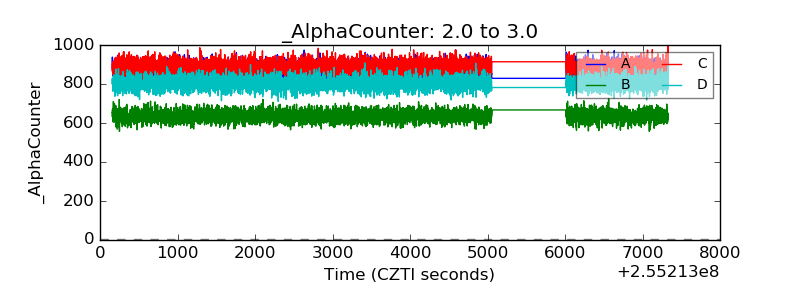 |
| _CPM_Rate | 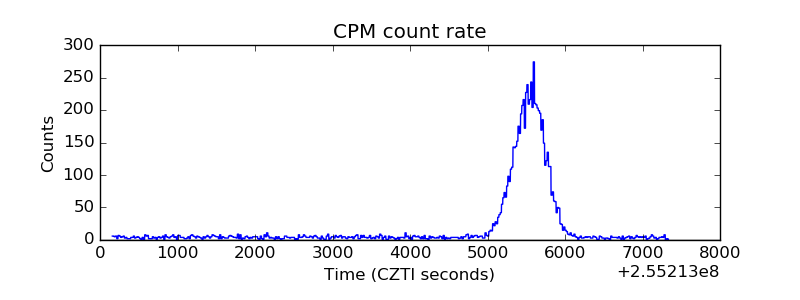 |
| CZT Counter | 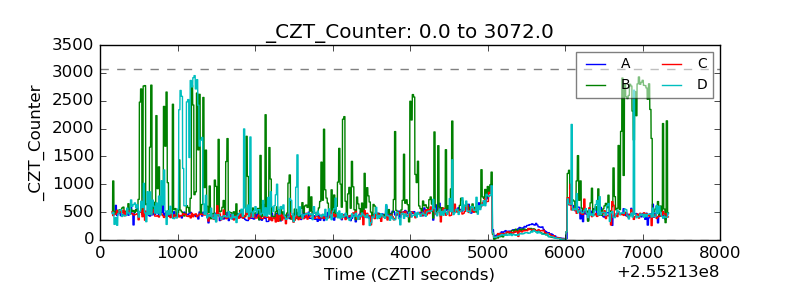 |
| +2.5 Volts monitor |  |
| +5 Volts monitor | 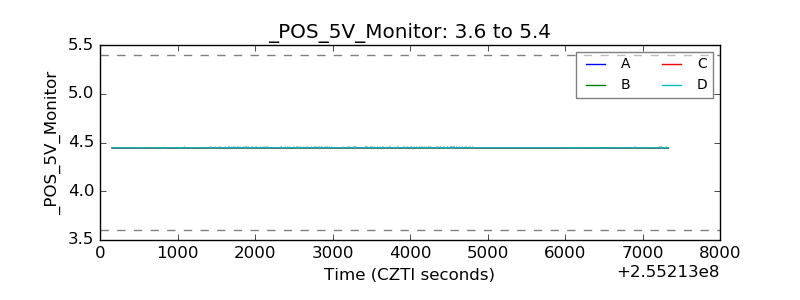 |
| _ROLL_ROT | 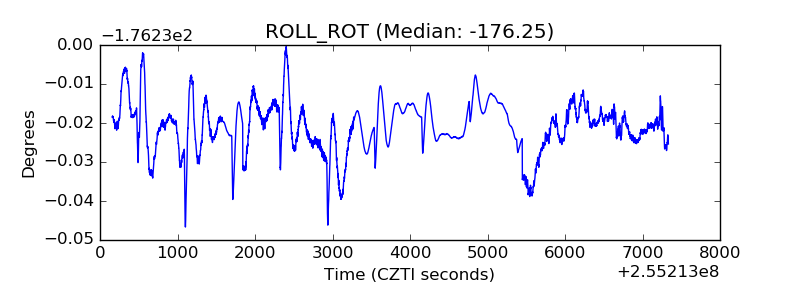 |
| _Roll_DEC | 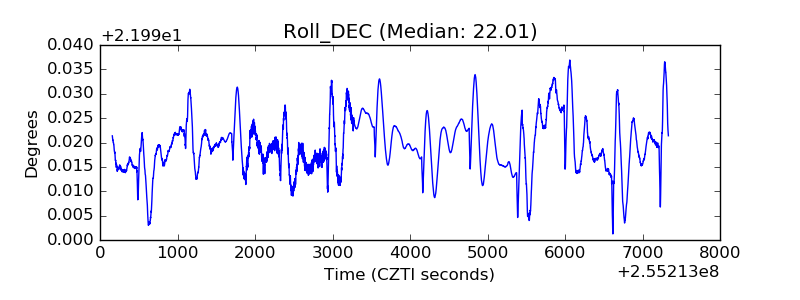 |
| _Roll_RA | 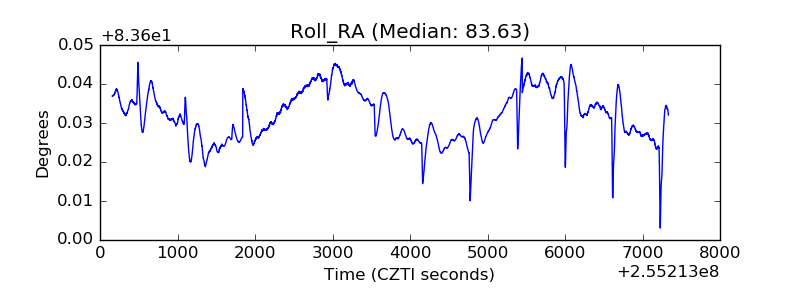 |
| Veto Counter | 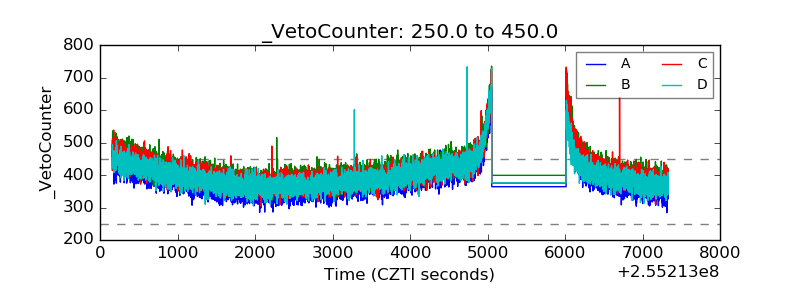 |