| Param | Original file | Final file |
|---|---|---|
| Filename | modeM0/AS1A04_174T01_9000001876_12697cztM0_level2.evt | modeM0/AS1A04_174T01_9000001876_12697cztM0_level2_quad_clean.evt |
| Size (bytes) | 551,704,320 | 98,922,240 |
| Size | 526.1 MB | 94.3 MB |
| Events in quadrant A | 3,261,876 | 666,995 |
| Events in quadrant B | 6,343,055 | 546,536 |
| Events in quadrant C | 3,306,556 | 662,654 |
| Events in quadrant D | 3,325,027 | 634,952 |
| Mode M9 | |||
|---|---|---|---|
| Quadrant | BADHDUFLAG | Total packets | Discarded packets |
| A | 0 | 6 | 0 |
| B | 0 | 6 | 0 |
| C | 0 | 6 | 0 |
| D | 0 | 6 | 0 |
| Mode M0 | |||
|---|---|---|---|
| Quadrant | BADHDUFLAG | Total packets | Discarded packets |
| A | 0 | 14306 | 2 |
| B | 0 | 23461 | 1 |
| C | 0 | 14501 | 1 |
| D | 0 | 14792 | 1 |
| Mode SS | |||
|---|---|---|---|
| Quadrant | BADHDUFLAG | Total packets | Discarded packets |
| A | 0 | 140 | 0 |
| B | 0 | 140 | 0 |
| C | 0 | 140 | 0 |
| D | 0 | 140 | 0 |
| Quadrant | Total seconds | Saturated seconds | Saturation percentage |
|---|---|---|---|
| A | 6955 | 27 | 0.388210% |
| B | 6955 | 1301 | 18.705967% |
| C | 6955 | 36 | 0.517613% |
| D | 6955 | 29 | 0.416966% |
Noise dominated data is calculated using 1-second bins in cleaned event files. If a bin has >2000 counts, and if more than 50% of those come from <1% of pixels, then it is considered to be noise-dominated and hence unusable.
| Quadrant | # 1 sec bins | Bins with >0 counts | Bins with >2000 counts | High rate bins dominated by noise | Noise dominated (total time) | Noise dominated (detector-on time) | Marked lightcurve |
|---|---|---|---|---|---|---|---|
| A | 7521 | 6957 | 0 | 0 | 0.00% | 0.00% |  |
| B | 7521 | 6957 | 1061 | 1061 | 14.11% | 15.25% | 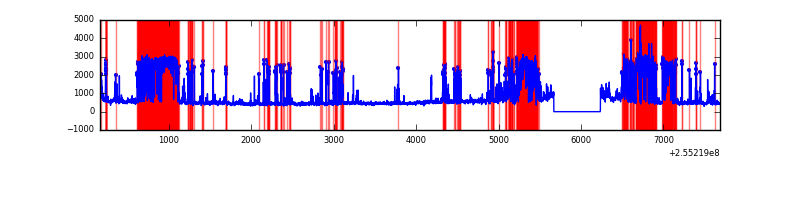 |
| C | 7521 | 6957 | 8 | 8 | 0.11% | 0.11% | 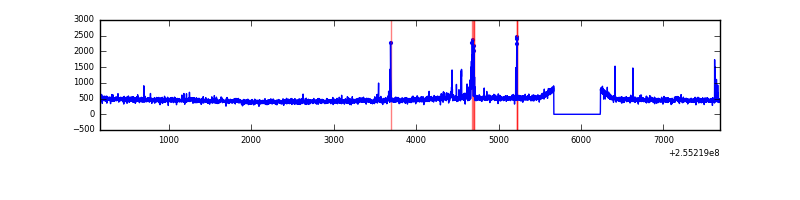 |
| D | 7521 | 6957 | 14 | 14 | 0.19% | 0.20% | 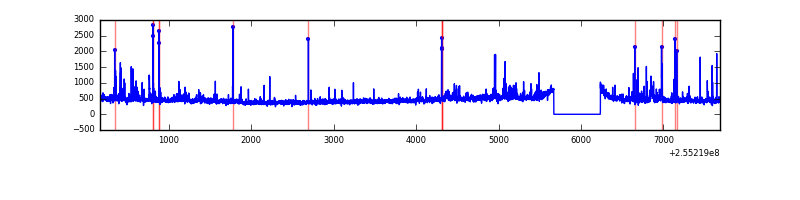 |
Top three noisy pixels from each quadrant. If the there are fewer than three noisy pixels in the level2.evt file, extra rows are filled as -1
| Pixel properties | Quadrant properties | ||||||
|---|---|---|---|---|---|---|---|
| Quadrant | DetID | PixID | Counts | Sigma | Mean | Median | Sigma |
| A | 12 | 189 | 21368 | 118.33 | 838 | 821 | 173.6 |
| A | 8 | 15 | 13932 | 75.51 | 838 | 821 | 173.6 |
| A | 0 | 226 | 7362 | 37.67 | 838 | 821 | 173.6 |
| B | 4 | 239 | 3199227 | 22545.2 | 742 | 726 | 141.9 |
| B | 3 | 209 | 92206 | 644.81 | 742 | 726 | 141.9 |
| B | 0 | 219 | 36673 | 253.38 | 742 | 726 | 141.9 |
| C | 15 | 208 | 117595 | 612.39 | 816 | 825 | 190.7 |
| C | 14 | 234 | 6018 | 27.23 | 816 | 825 | 190.7 |
| C | 13 | 61 | 6008 | 27.18 | 816 | 825 | 190.7 |
| D | 1 | 52 | 83414 | 389.47 | 803 | 788 | 212.1 |
| D | 8 | 195 | 47021 | 217.93 | 803 | 788 | 212.1 |
| D | 2 | 234 | 29937 | 137.4 | 803 | 788 | 212.1 |
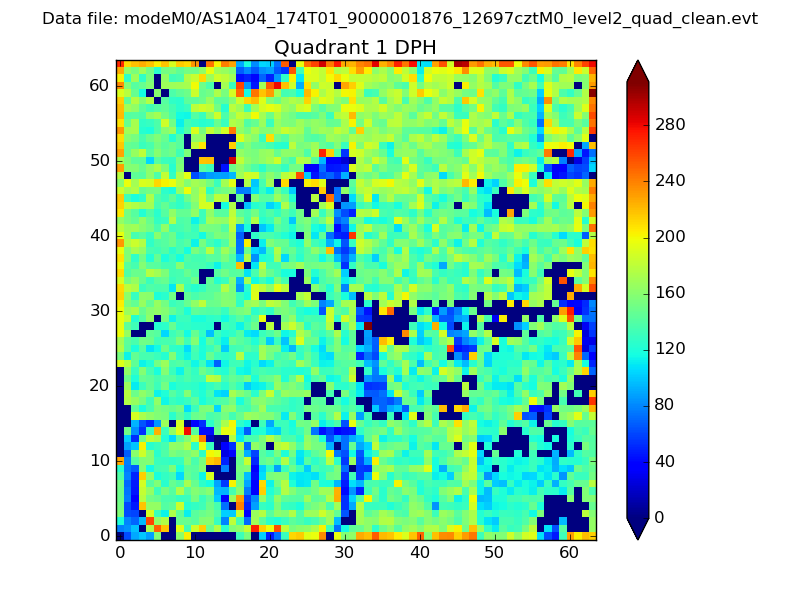
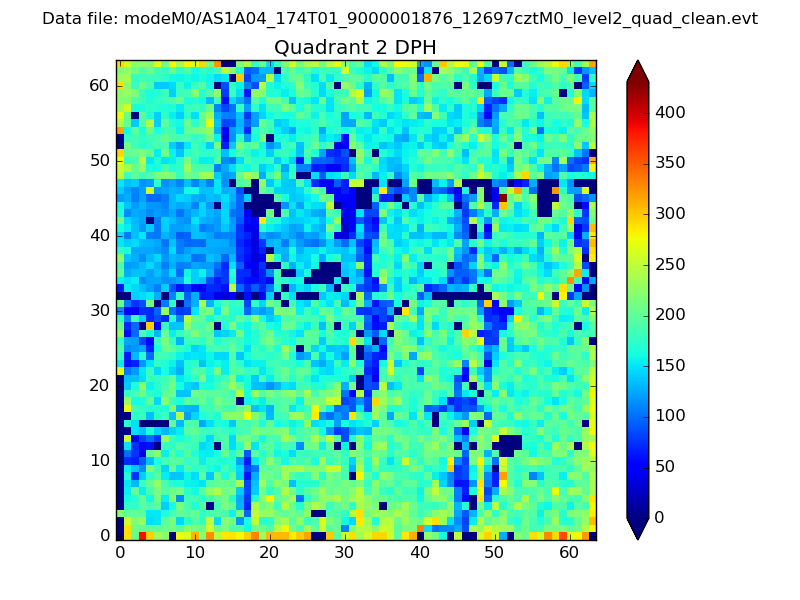
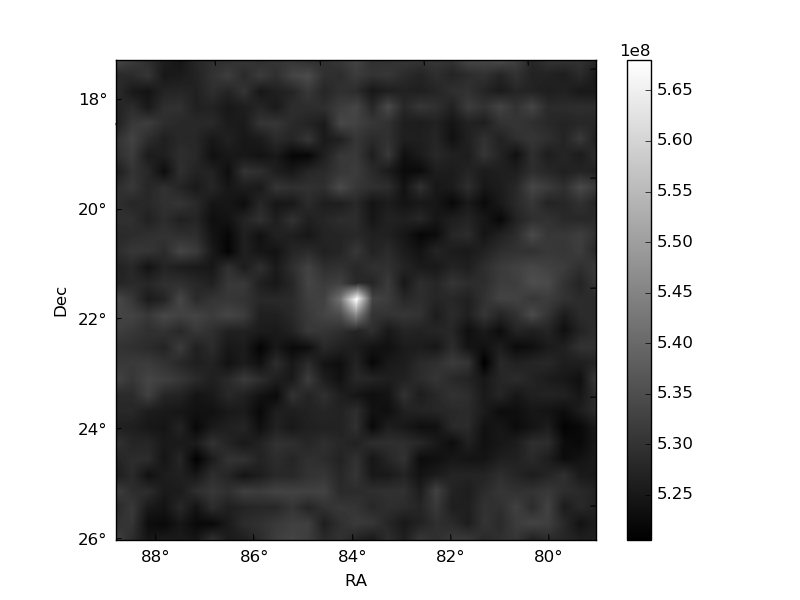
Histogram calculated using DETX and DETY for each event in the final _common_clean file
| Quadrant A | 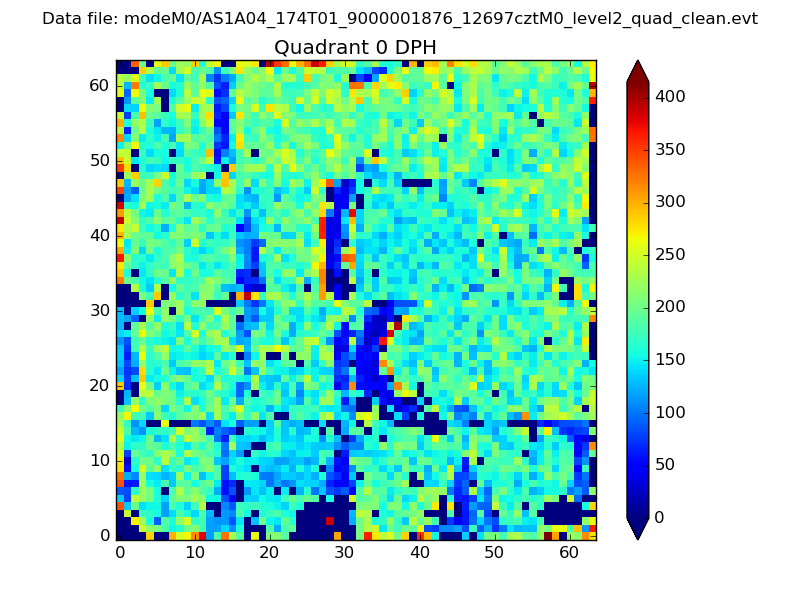 |
 |
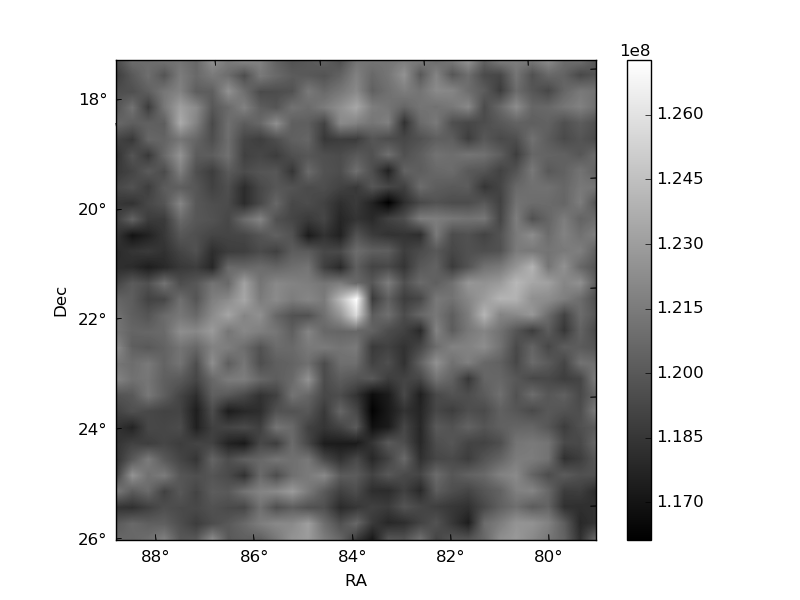
Quadrant B |
|---|---|---|---|
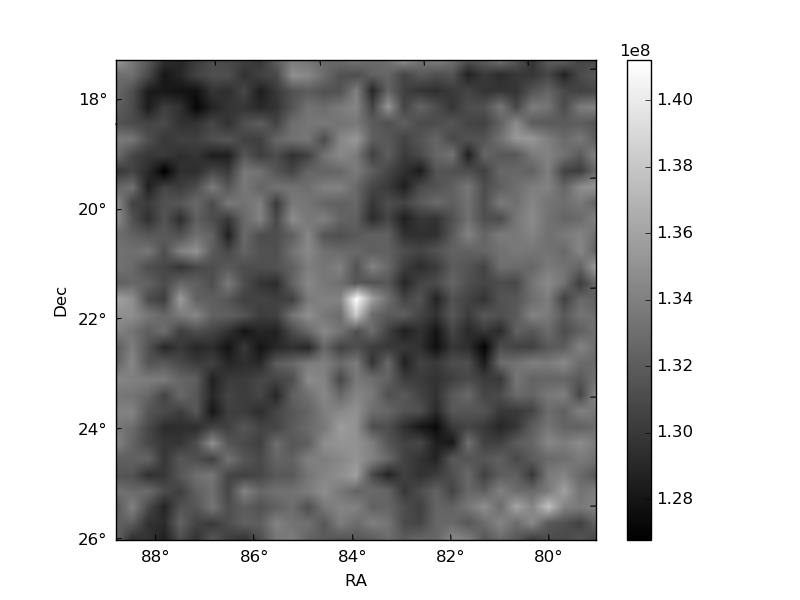
| Quadrant D | 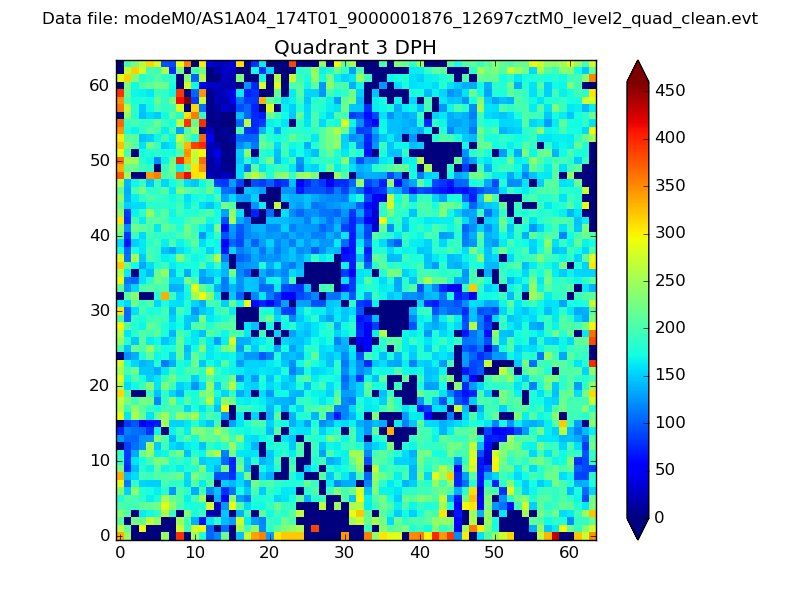 |
 |
Quadrant C |
| Plot type | Count rate plots | Images |
|---|---|---|
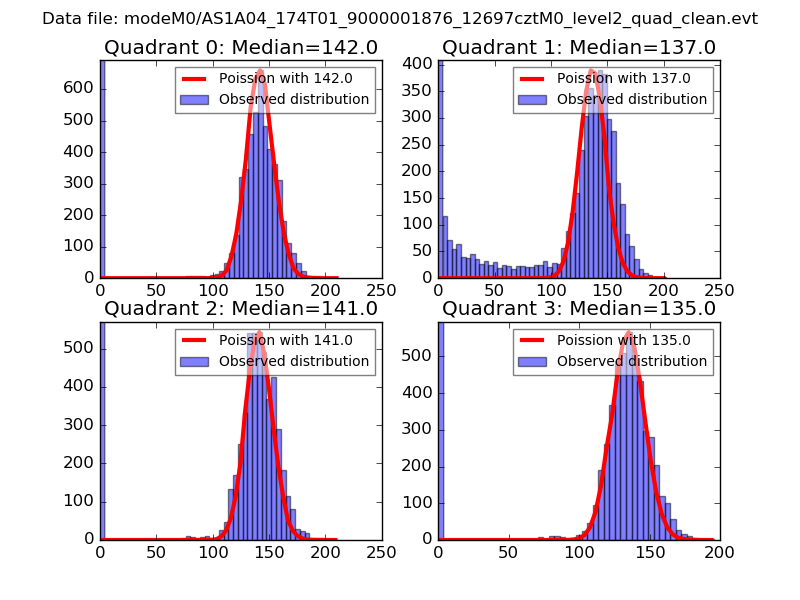
| Comparison with Poisson distribution Blue bars denote a histogram of data divided into 1 sec bins. Red curve is a Poisson curve with rate = median count rate of data. |
 |
 |
| Quadrant-wise count rates Data is divided into 100 sec bins |
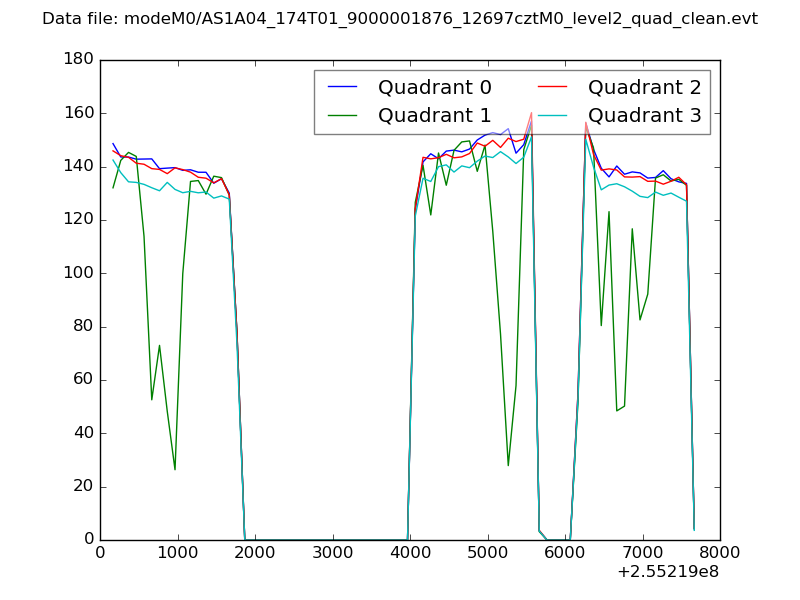 |
|
| Module-wise count rates for Quadrant A Data is divided into 100 sec bins |
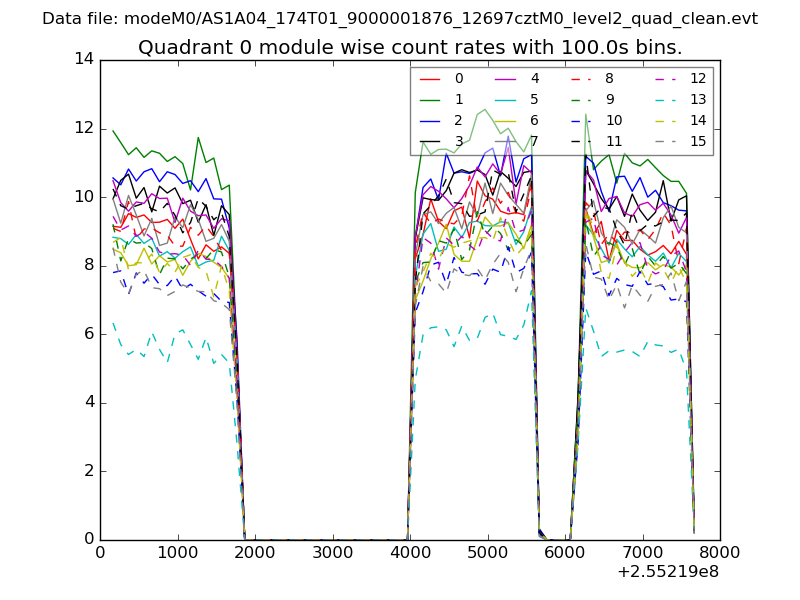 |
 |
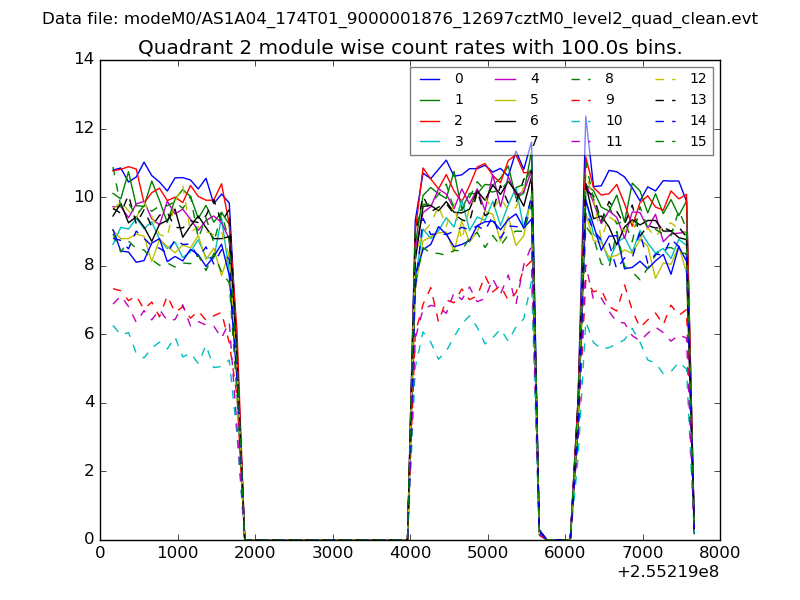
| Module-wise count rates for Quadrant B Data is divided into 100 sec bins |
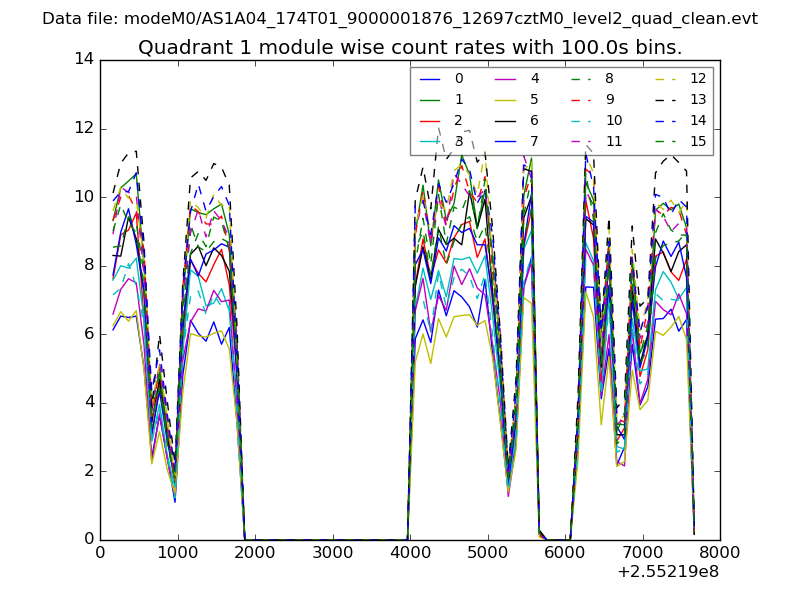 |
 |
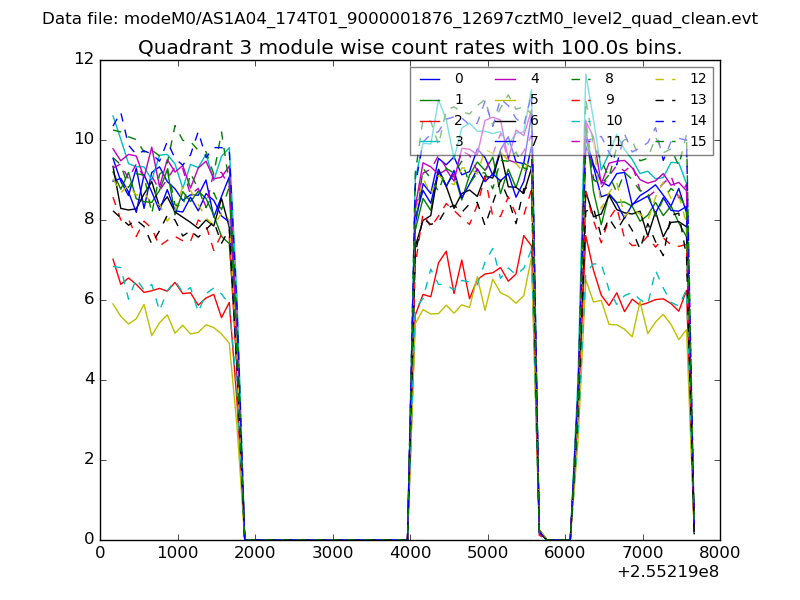
| Module-wise count rates for Quadrant C Data is divided into 100 sec bins |
 |
 |
| Module-wise count rates for Quadrant D Data is divided into 100 sec bins |
 |
 |
| Parameter | Plot |
|---|---|
| CZT HV Monitor | 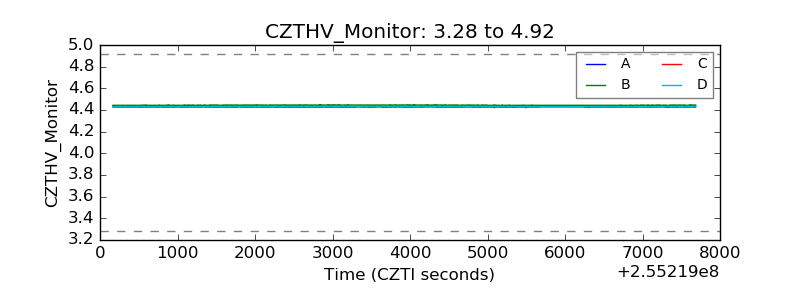 |
| D_VDD | 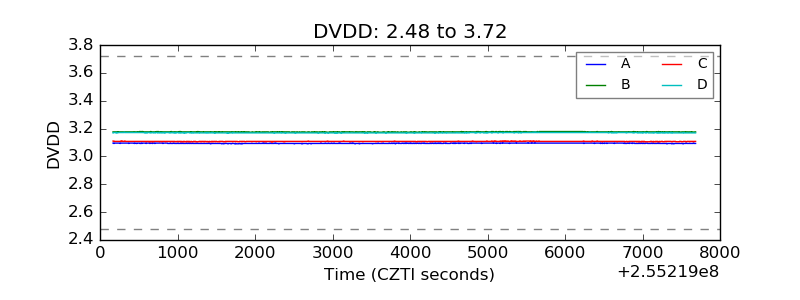 |
| Temperature 1 | 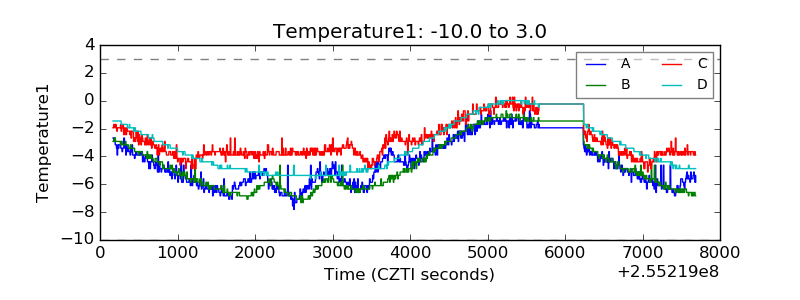 |
| Veto HV Monitor | 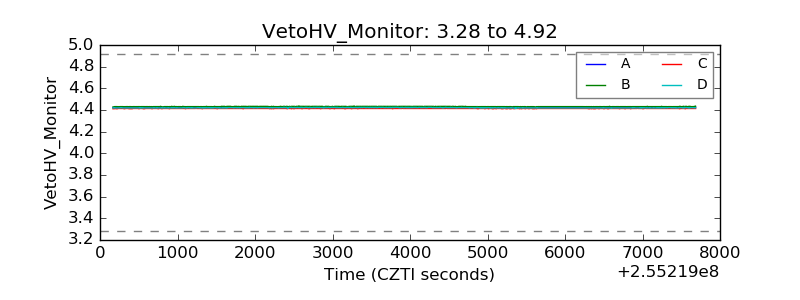 |
| Veto LLD | 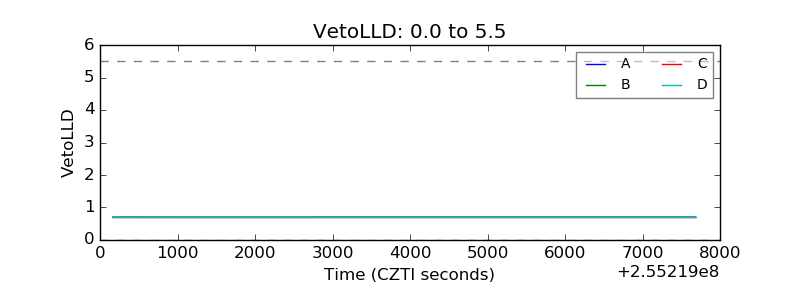 |
| Alpha Counter | 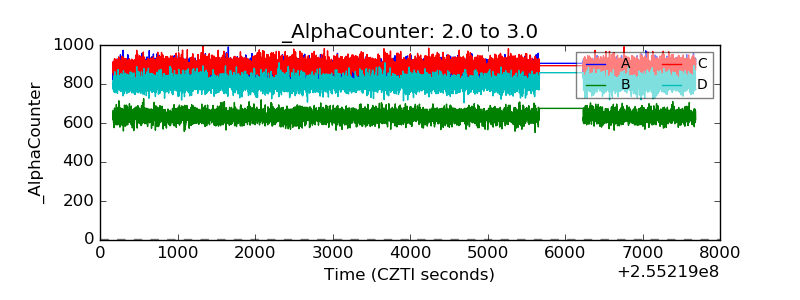 |
| _CPM_Rate | 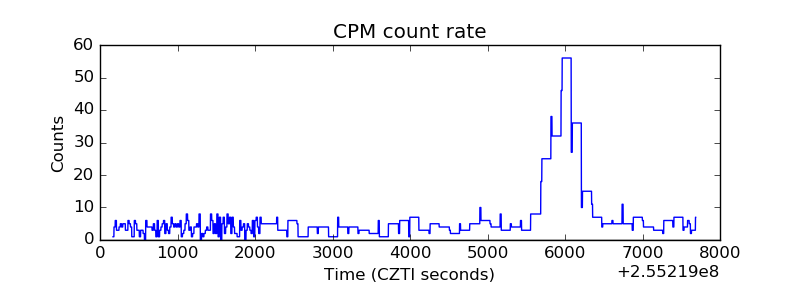 |
| CZT Counter | 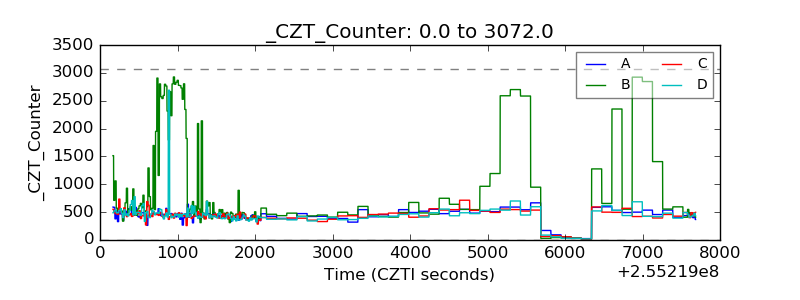 |
| +2.5 Volts monitor | 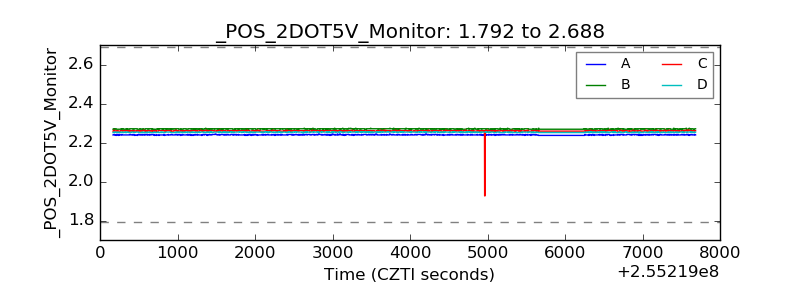 |
| +5 Volts monitor |  |
| _ROLL_ROT | 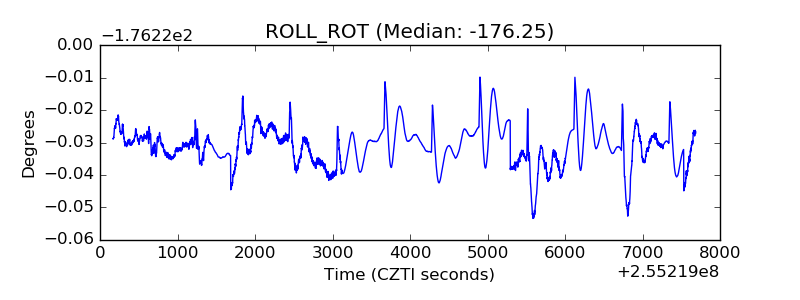 |
| _Roll_DEC | 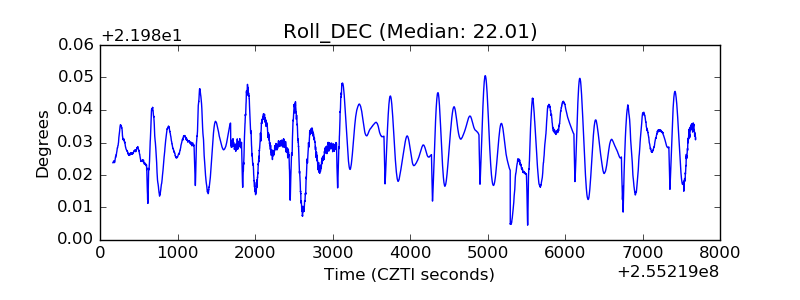 |
| _Roll_RA | 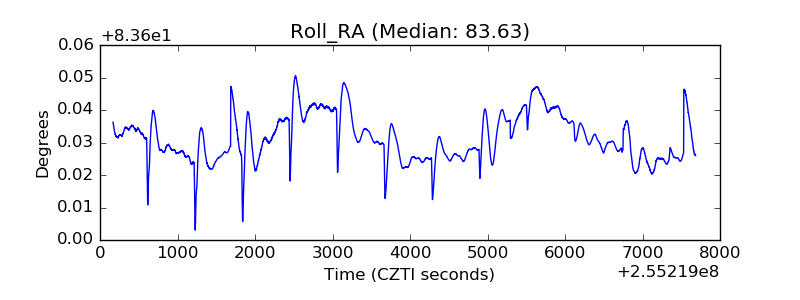 |
| Veto Counter | 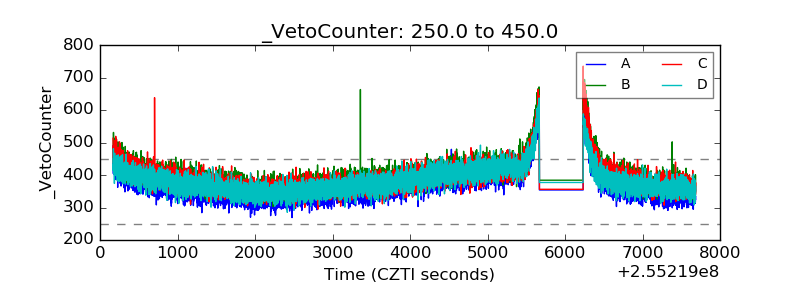 |