| Param | Original file | Final file |
|---|---|---|
| Filename | modeM0/AS1A04_174T01_9000001876_12698cztM0_level2.evt | modeM0/AS1A04_174T01_9000001876_12698cztM0_level2_quad_clean.evt |
| Size (bytes) | 590,558,400 | 104,492,160 |
| Size | 563.2 MB | 99.7 MB |
| Events in quadrant A | 3,619,739 | 692,788 |
| Events in quadrant B | 6,438,946 | 586,611 |
| Events in quadrant C | 3,631,637 | 691,707 |
| Events in quadrant D | 3,676,013 | 661,175 |
| Mode M9 | |||
|---|---|---|---|
| Quadrant | BADHDUFLAG | Total packets | Discarded packets |
| A | 0 | 10 | 0 |
| B | 0 | 10 | 0 |
| C | 0 | 10 | 0 |
| D | 0 | 10 | 0 |
| Mode M0 | |||
|---|---|---|---|
| Quadrant | BADHDUFLAG | Total packets | Discarded packets |
| A | 0 | 15884 | 2 |
| B | 0 | 24178 | 1 |
| C | 0 | 15965 | 1 |
| D | 0 | 16306 | 1 |
| Mode SS | |||
|---|---|---|---|
| Quadrant | BADHDUFLAG | Total packets | Discarded packets |
| A | 0 | 156 | 0 |
| B | 0 | 156 | 0 |
| C | 0 | 156 | 0 |
| D | 0 | 156 | 0 |
| Quadrant | Total seconds | Saturated seconds | Saturation percentage |
|---|---|---|---|
| A | 7648 | 45 | 0.588389% |
| B | 7648 | 1193 | 15.598849% |
| C | 7648 | 42 | 0.549163% |
| D | 7648 | 41 | 0.536088% |
Noise dominated data is calculated using 1-second bins in cleaned event files. If a bin has >2000 counts, and if more than 50% of those come from <1% of pixels, then it is considered to be noise-dominated and hence unusable.
| Quadrant | # 1 sec bins | Bins with >0 counts | Bins with >2000 counts | High rate bins dominated by noise | Noise dominated (total time) | Noise dominated (detector-on time) | Marked lightcurve |
|---|---|---|---|---|---|---|---|
| A | 8559 | 7651 | 0 | 0 | 0.00% | 0.00% | 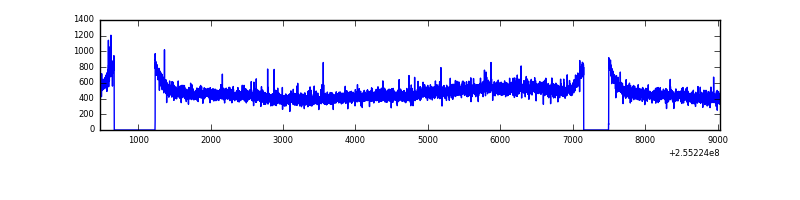 |
| B | 8559 | 7651 | 935 | 935 | 10.92% | 12.22% | 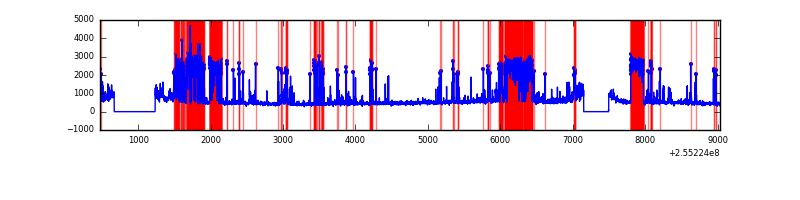 |
| C | 8559 | 7651 | 9 | 9 | 0.11% | 0.12% | 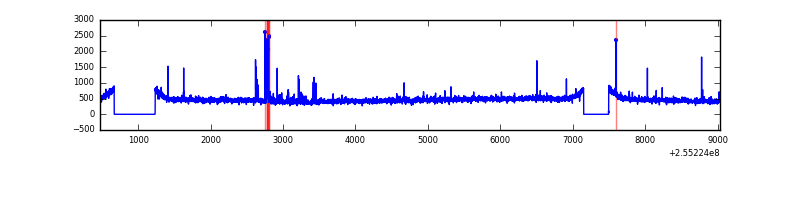 |
| D | 8559 | 7651 | 15 | 15 | 0.18% | 0.20% | 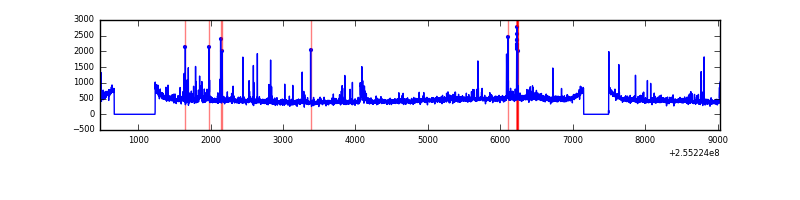 |
Top three noisy pixels from each quadrant. If the there are fewer than three noisy pixels in the level2.evt file, extra rows are filled as -1
| Pixel properties | Quadrant properties | ||||||
|---|---|---|---|---|---|---|---|
| Quadrant | DetID | PixID | Counts | Sigma | Mean | Median | Sigma |
| A | 8 | 15 | 24306 | 121.41 | 930 | 909 | 192.7 |
| A | 12 | 189 | 18413 | 90.83 | 930 | 909 | 192.7 |
| A | 15 | 174 | 8571 | 39.76 | 930 | 909 | 192.7 |
| B | 4 | 239 | 2892985 | 17729.05 | 845 | 826 | 163.1 |
| B | 3 | 209 | 88808 | 539.33 | 845 | 826 | 163.1 |
| B | 0 | 219 | 34053 | 203.68 | 845 | 826 | 163.1 |
| C | 15 | 208 | 86697 | 402.41 | 907 | 916 | 213.2 |
| C | 14 | 234 | 6524 | 26.31 | 907 | 916 | 213.2 |
| C | 13 | 61 | 6463 | 26.02 | 907 | 916 | 213.2 |
| D | 1 | 52 | 52788 | 219.43 | 894 | 877 | 236.6 |
| D | 13 | 249 | 41984 | 173.76 | 894 | 877 | 236.6 |
| D | 13 | 104 | 34540 | 142.29 | 894 | 877 | 236.6 |
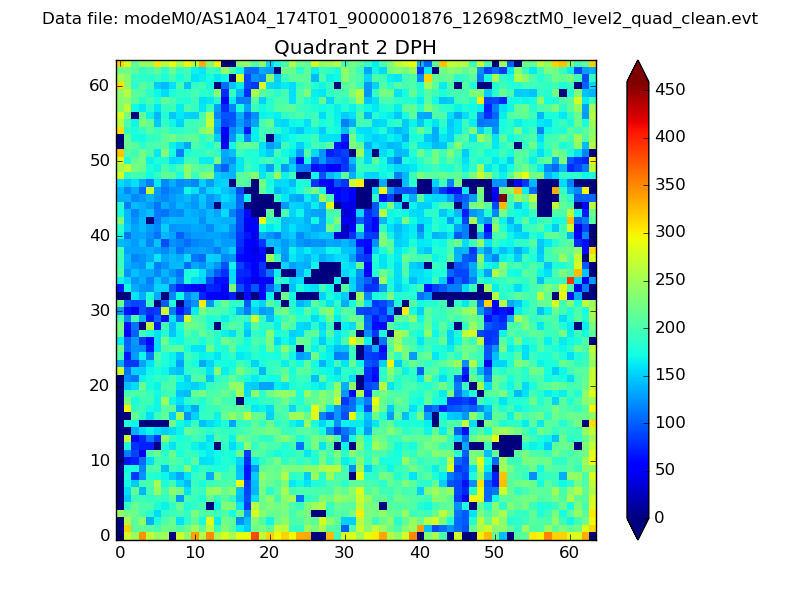
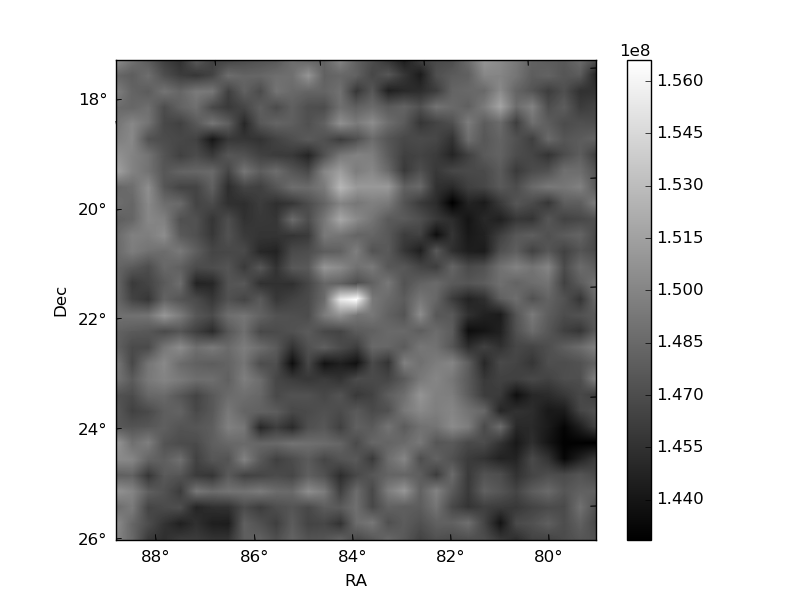
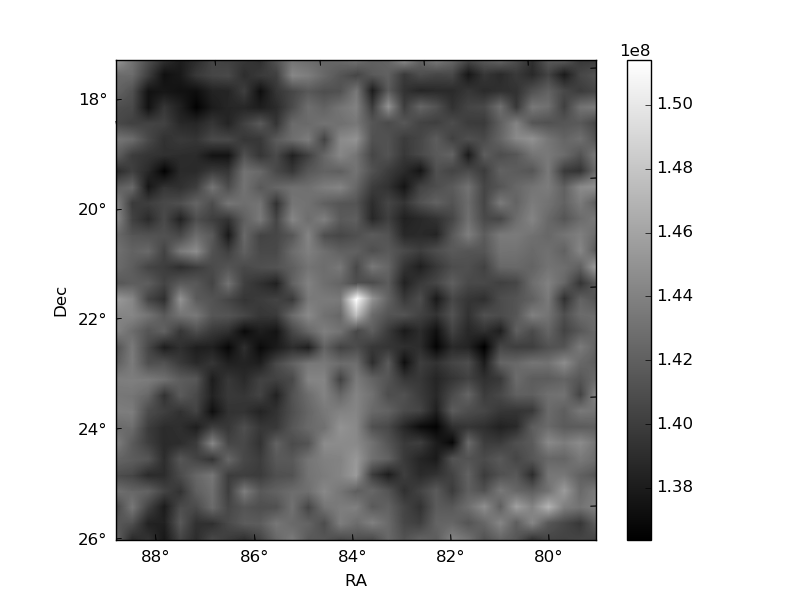
Histogram calculated using DETX and DETY for each event in the final _common_clean file
| Quadrant A | 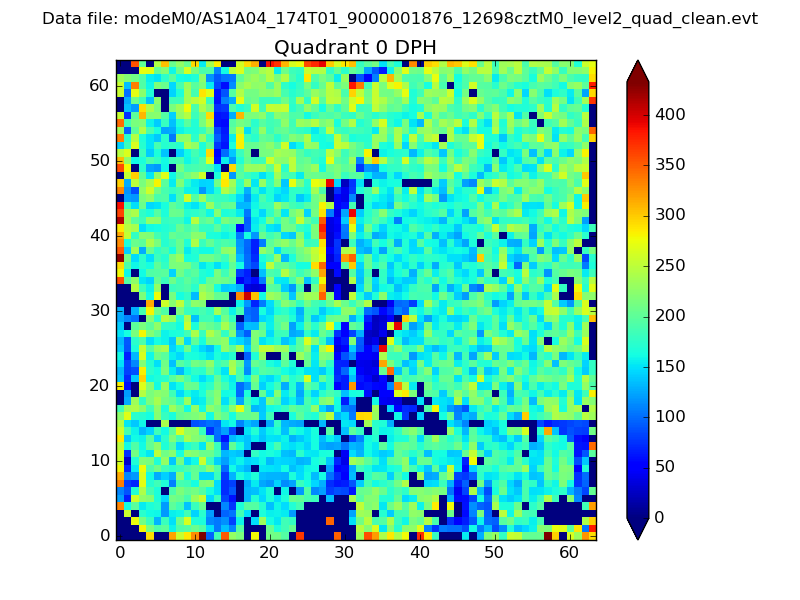 |
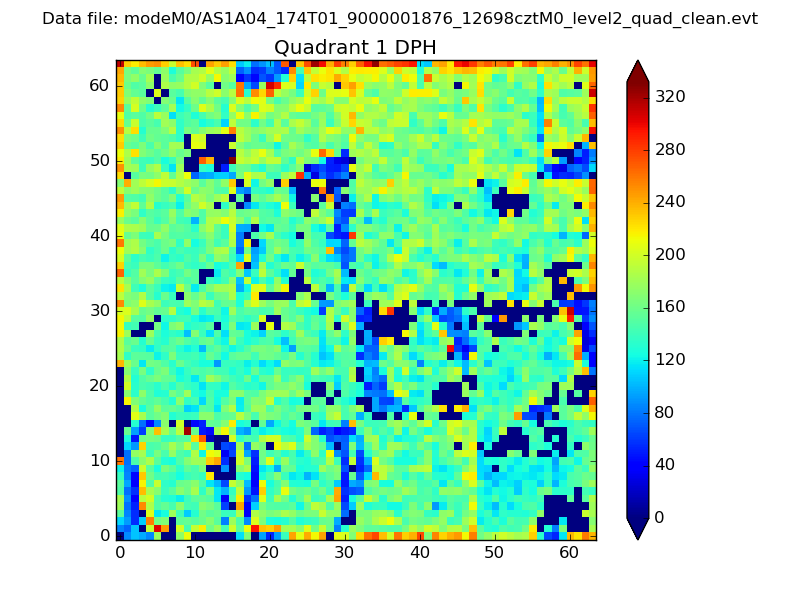 |
Quadrant B |
|---|---|---|---|
| Quadrant D | 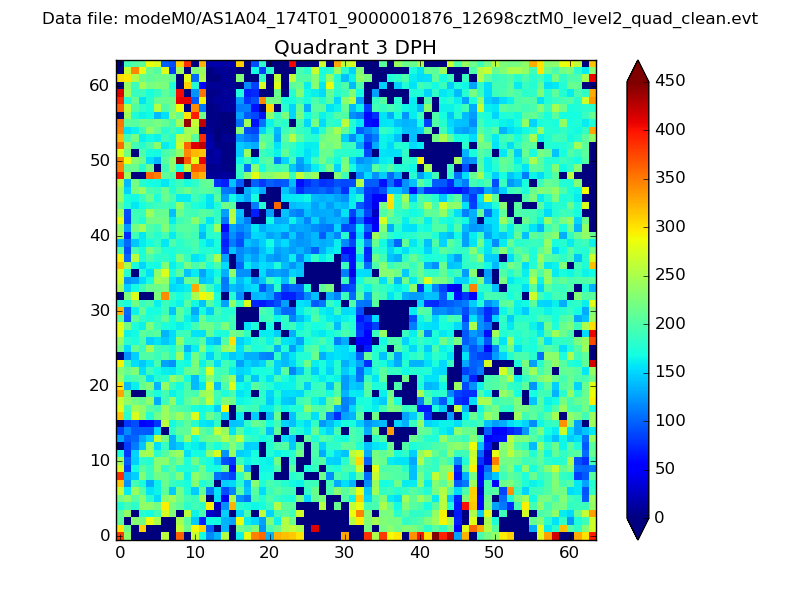 |
 |
Quadrant C |
| Plot type | Count rate plots | Images |
|---|---|---|
| Comparison with Poisson distribution Blue bars denote a histogram of data divided into 1 sec bins. Red curve is a Poisson curve with rate = median count rate of data. |
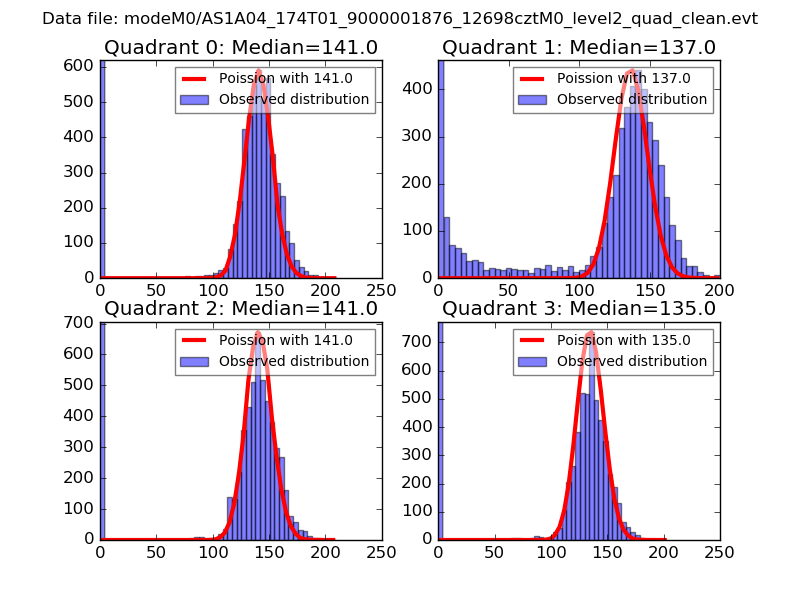 |
 |
| Quadrant-wise count rates Data is divided into 100 sec bins |
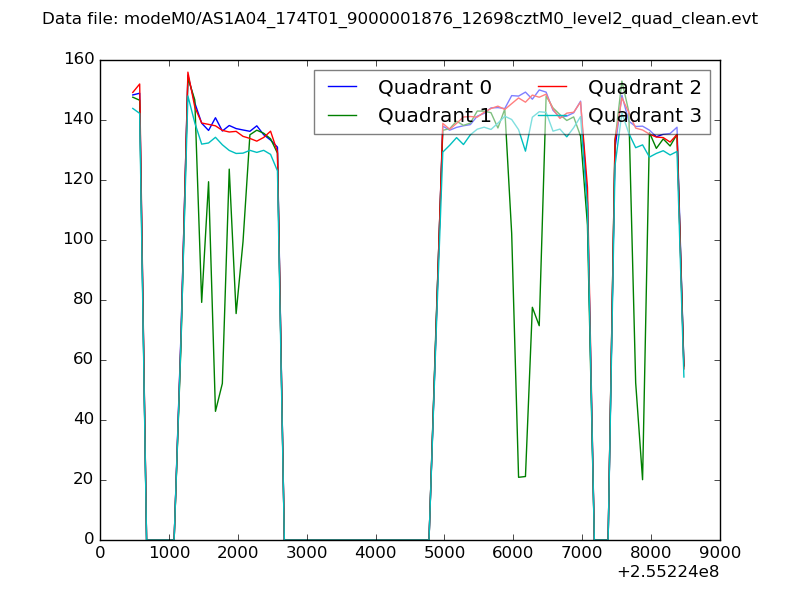 |
|
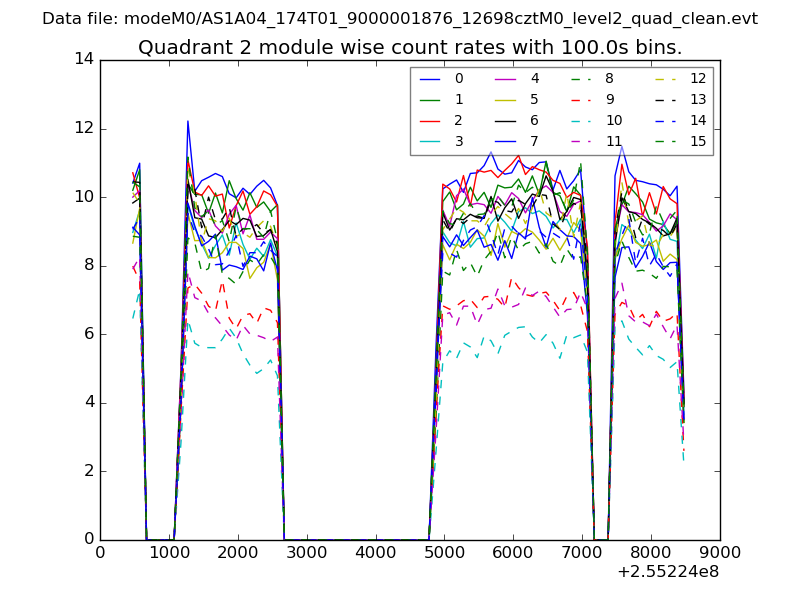
| Module-wise count rates for Quadrant A Data is divided into 100 sec bins |
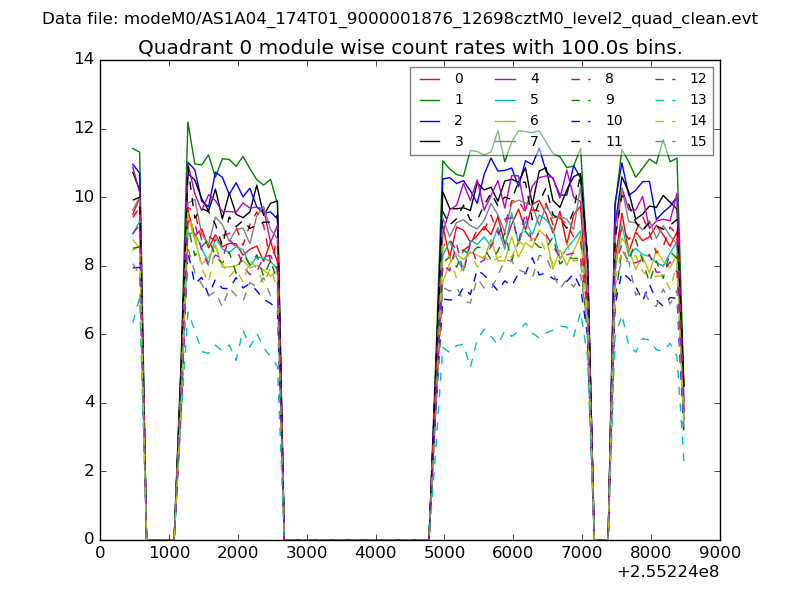 |
 |
| Module-wise count rates for Quadrant B Data is divided into 100 sec bins |
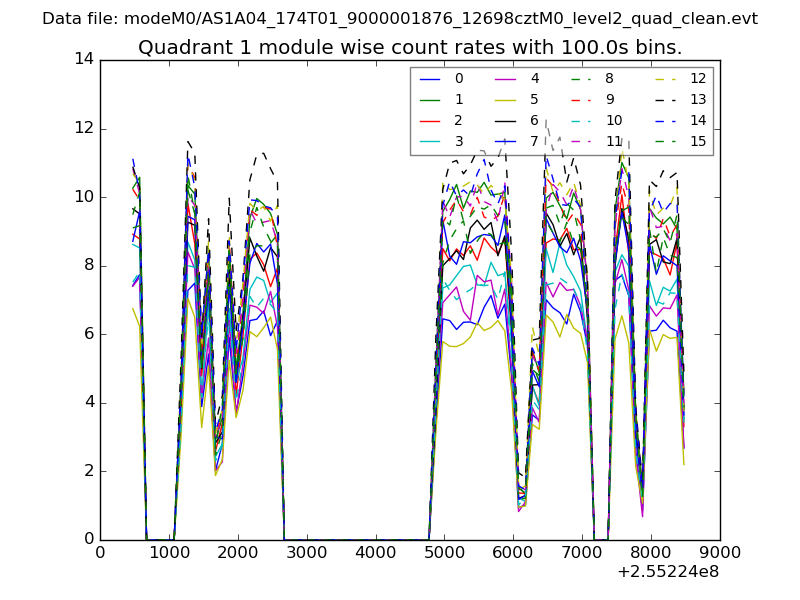 |
 |
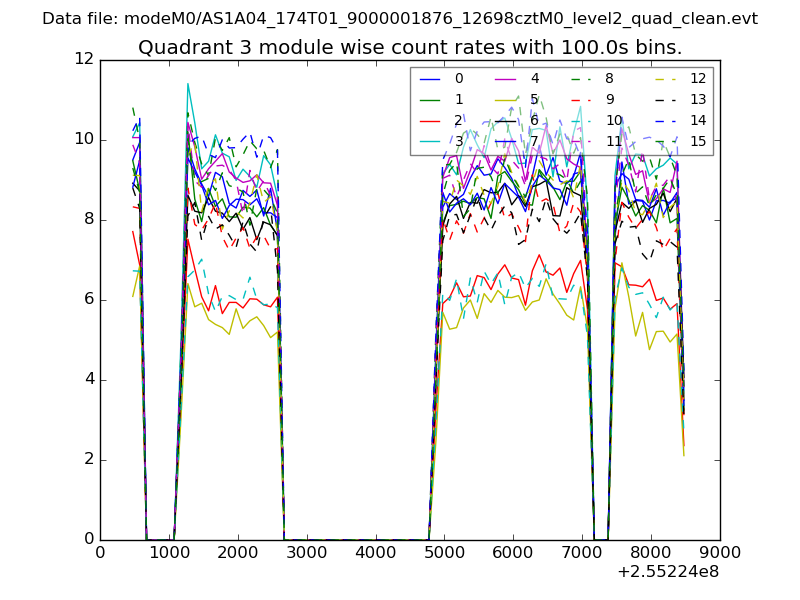
| Module-wise count rates for Quadrant C Data is divided into 100 sec bins |
 |
 |
| Module-wise count rates for Quadrant D Data is divided into 100 sec bins |
 |
 |
| Parameter | Plot |
|---|---|
| CZT HV Monitor | 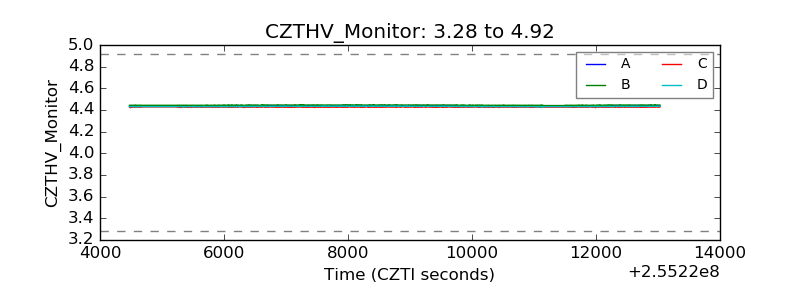 |
| D_VDD | 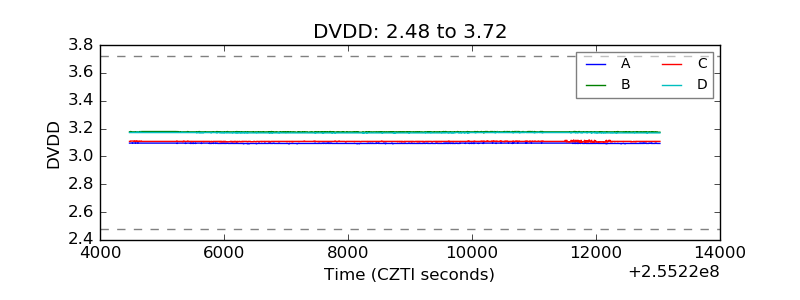 |
| Temperature 1 | 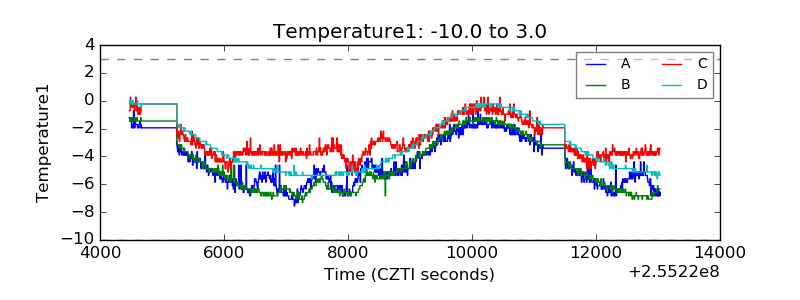 |
| Veto HV Monitor |  |
| Veto LLD | 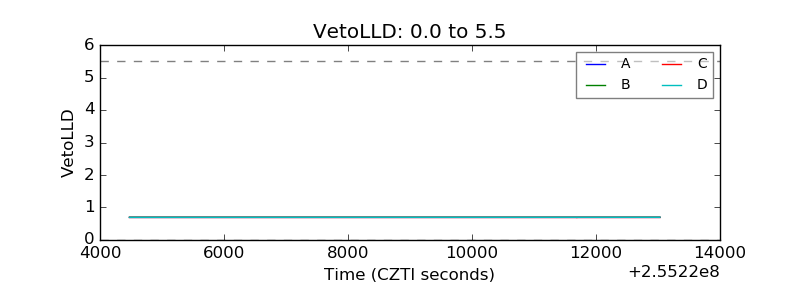 |
| Alpha Counter | 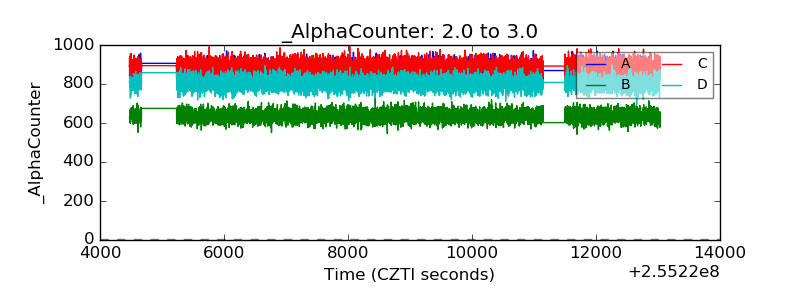 |
| _CPM_Rate | 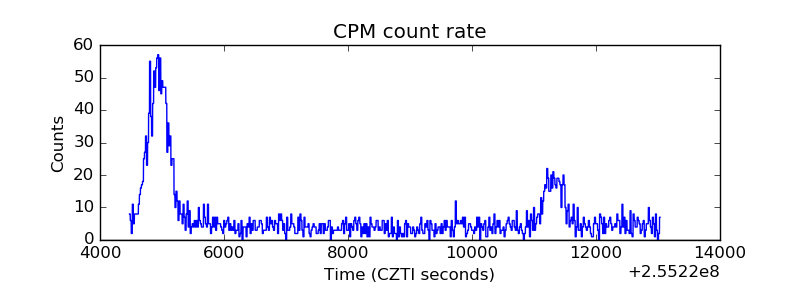 |
| CZT Counter | 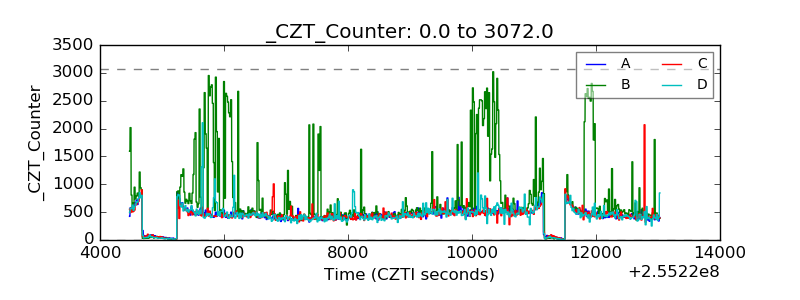 |
| +2.5 Volts monitor |  |
| +5 Volts monitor |  |
| _ROLL_ROT | 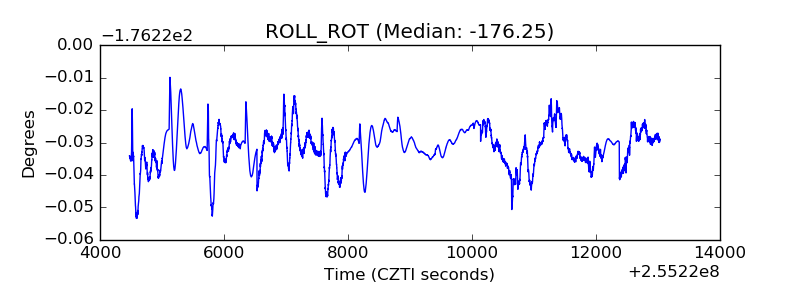 |
| _Roll_DEC | 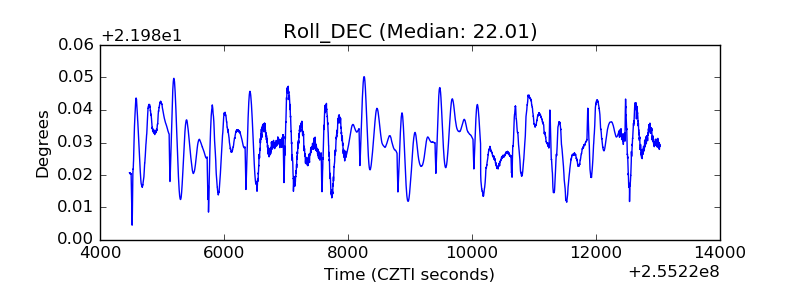 |
| _Roll_RA | 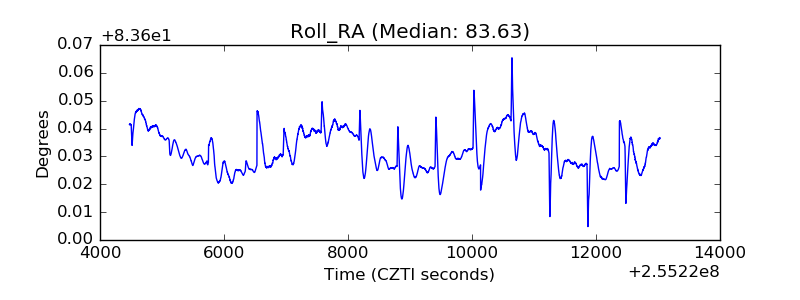 |
| Veto Counter | 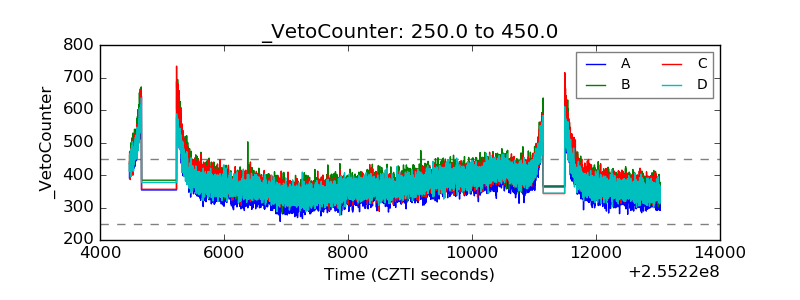 |