| Param | Original file | Final file |
|---|---|---|
| Filename | modeM0/AS1A04_174T01_9000001876_12699cztM0_level2.evt | modeM0/AS1A04_174T01_9000001876_12699cztM0_level2_quad_clean.evt |
| Size (bytes) | 555,042,240 | 92,183,040 |
| Size | 529.3 MB | 87.9 MB |
| Events in quadrant A | 3,463,436 | 597,959 |
| Events in quadrant B | 5,912,230 | 505,612 |
| Events in quadrant C | 3,459,398 | 598,747 |
| Events in quadrant D | 3,469,349 | 571,182 |
| Mode M9 | |||
|---|---|---|---|
| Quadrant | BADHDUFLAG | Total packets | Discarded packets |
| A | 0 | 4 | 0 |
| B | 0 | 4 | 0 |
| C | 0 | 4 | 0 |
| D | 0 | 5 | 0 |
| Mode M0 | |||
|---|---|---|---|
| Quadrant | BADHDUFLAG | Total packets | Discarded packets |
| A | 0 | 15293 | 2 |
| B | 0 | 22415 | 1 |
| C | 0 | 15336 | 1 |
| D | 0 | 15606 | 1 |
| Mode SS | |||
|---|---|---|---|
| Quadrant | BADHDUFLAG | Total packets | Discarded packets |
| A | 0 | 150 | 0 |
| B | 0 | 150 | 0 |
| C | 0 | 150 | 0 |
| D | 0 | 150 | 0 |
| Quadrant | Total seconds | Saturated seconds | Saturation percentage |
|---|---|---|---|
| A | 7442 | 43 | 0.577802% |
| B | 7442 | 1009 | 13.558183% |
| C | 7442 | 18 | 0.241870% |
| D | 7442 | 27 | 0.362806% |
Noise dominated data is calculated using 1-second bins in cleaned event files. If a bin has >2000 counts, and if more than 50% of those come from <1% of pixels, then it is considered to be noise-dominated and hence unusable.
| Quadrant | # 1 sec bins | Bins with >0 counts | Bins with >2000 counts | High rate bins dominated by noise | Noise dominated (total time) | Noise dominated (detector-on time) | Marked lightcurve |
|---|---|---|---|---|---|---|---|
| A | 7818 | 7445 | 1 | 1 | 0.01% | 0.01% | 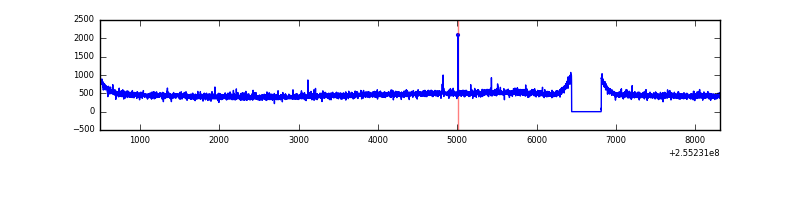 |
| B | 7818 | 7445 | 845 | 845 | 10.81% | 11.35% | 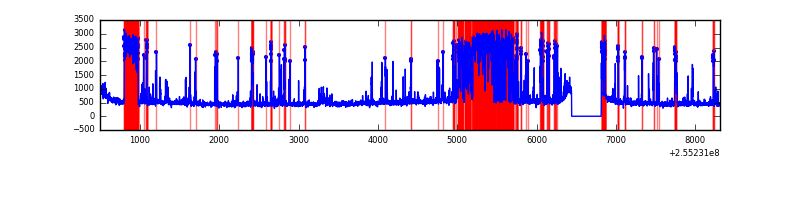 |
| C | 7818 | 7445 | 4 | 4 | 0.05% | 0.05% |  |
| D | 7818 | 7445 | 19 | 19 | 0.24% | 0.26% | 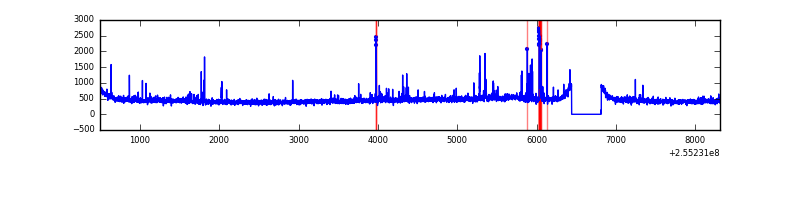 |
Top three noisy pixels from each quadrant. If the there are fewer than three noisy pixels in the level2.evt file, extra rows are filled as -1
| Pixel properties | Quadrant properties | ||||||
|---|---|---|---|---|---|---|---|
| Quadrant | DetID | PixID | Counts | Sigma | Mean | Median | Sigma |
| A | 12 | 189 | 23162 | 121.05 | 891 | 870 | 184.2 |
| A | 8 | 15 | 8422 | 41.01 | 891 | 870 | 184.2 |
| A | 0 | 226 | 7860 | 37.96 | 891 | 870 | 184.2 |
| B | 4 | 239 | 2522504 | 15995.5 | 817 | 796 | 157.7 |
| B | 3 | 209 | 52184 | 325.96 | 817 | 796 | 157.7 |
| B | 0 | 214 | 31393 | 194.08 | 817 | 796 | 157.7 |
| C | 15 | 208 | 43678 | 210.0 | 873 | 883 | 203.8 |
| C | 13 | 61 | 6373 | 26.94 | 873 | 883 | 203.8 |
| C | 8 | 128 | 6198 | 26.08 | 873 | 883 | 203.8 |
| D | 1 | 52 | 86842 | 410.91 | 864 | 841 | 209.3 |
| D | 7 | 55 | 45559 | 213.66 | 864 | 841 | 209.3 |
| D | 2 | 234 | 29380 | 136.36 | 864 | 841 | 209.3 |
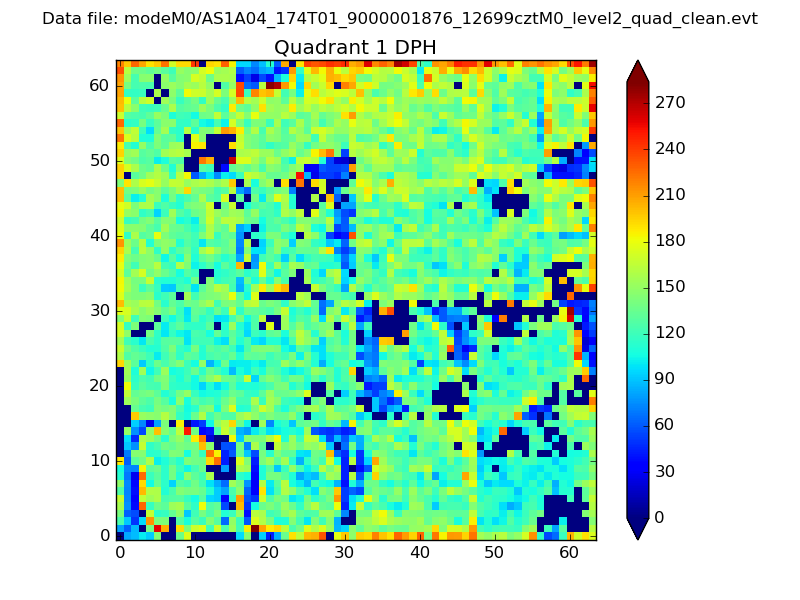
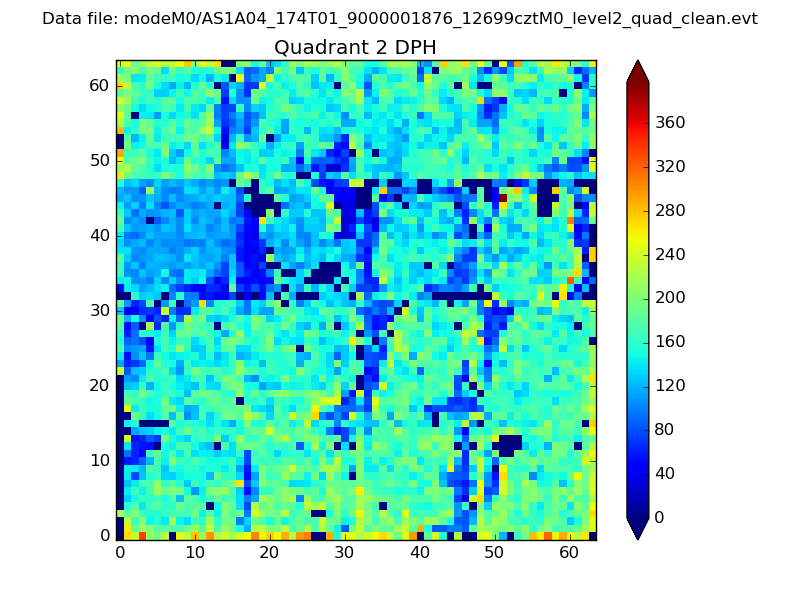
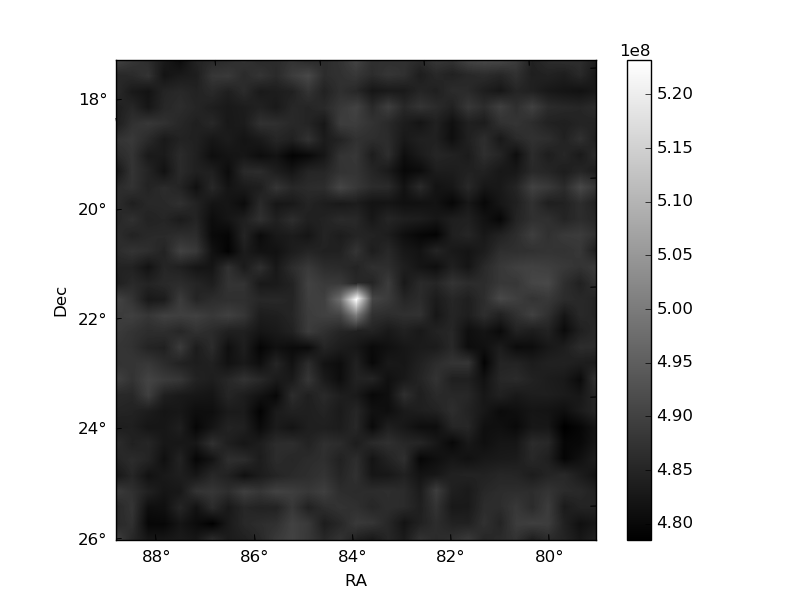
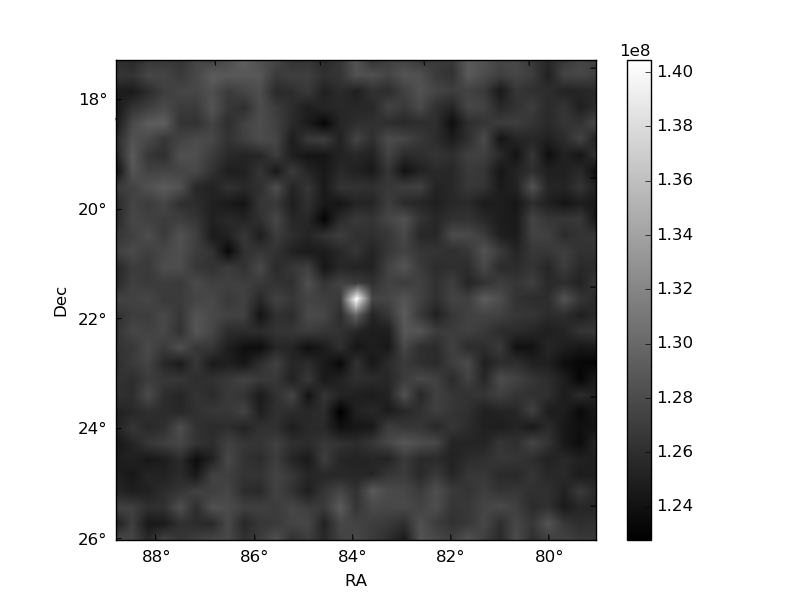
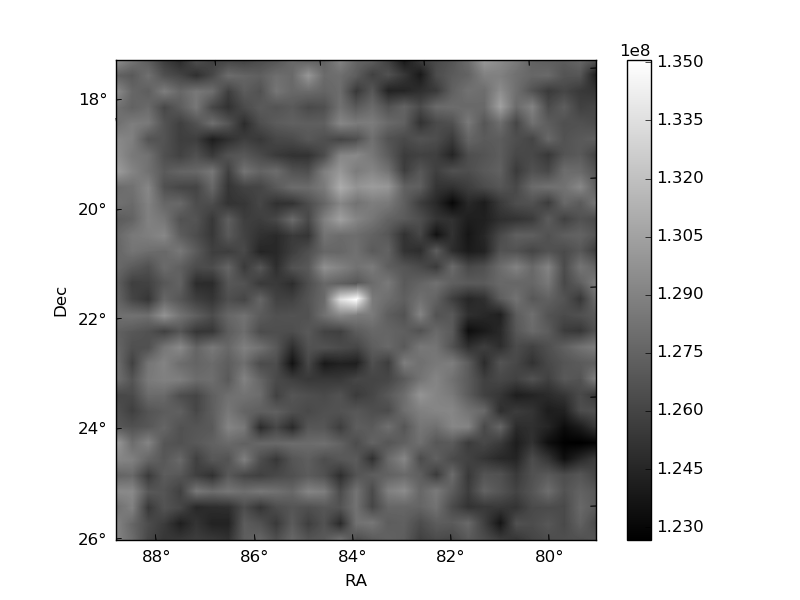
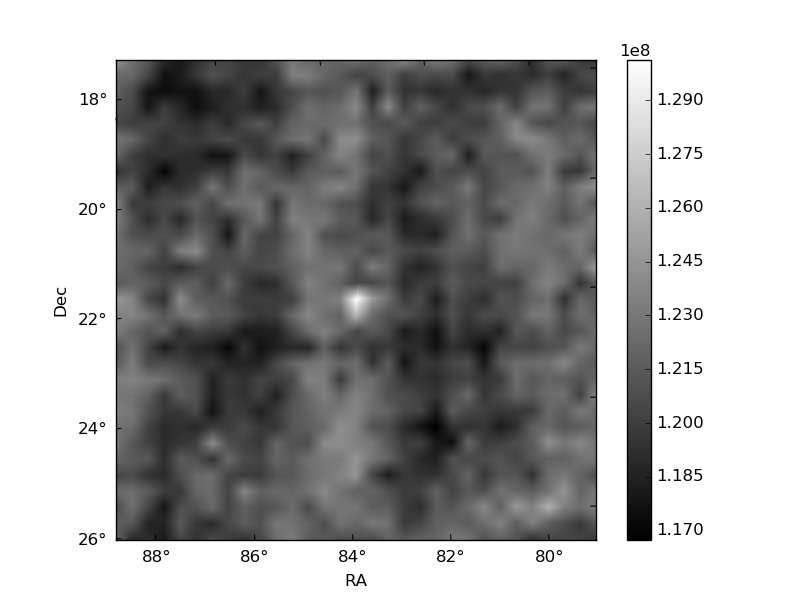
Histogram calculated using DETX and DETY for each event in the final _common_clean file
| Quadrant A | 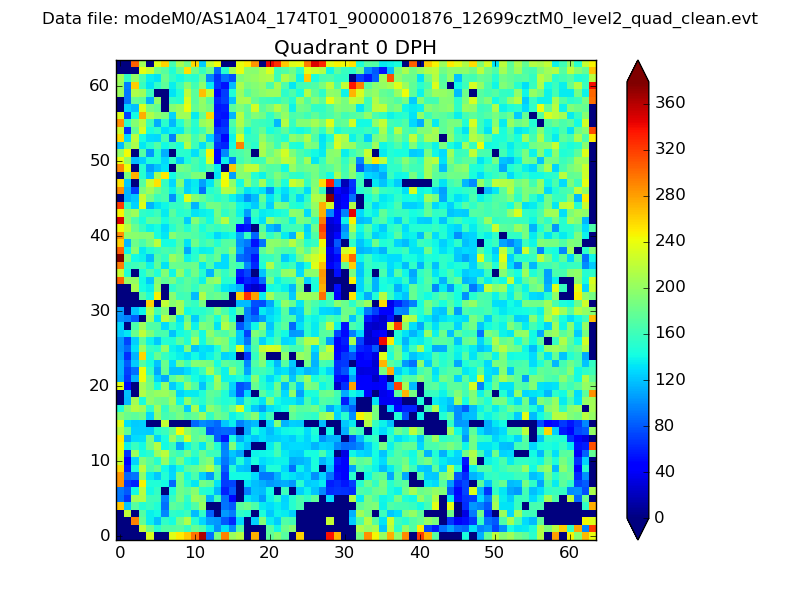 |
 |
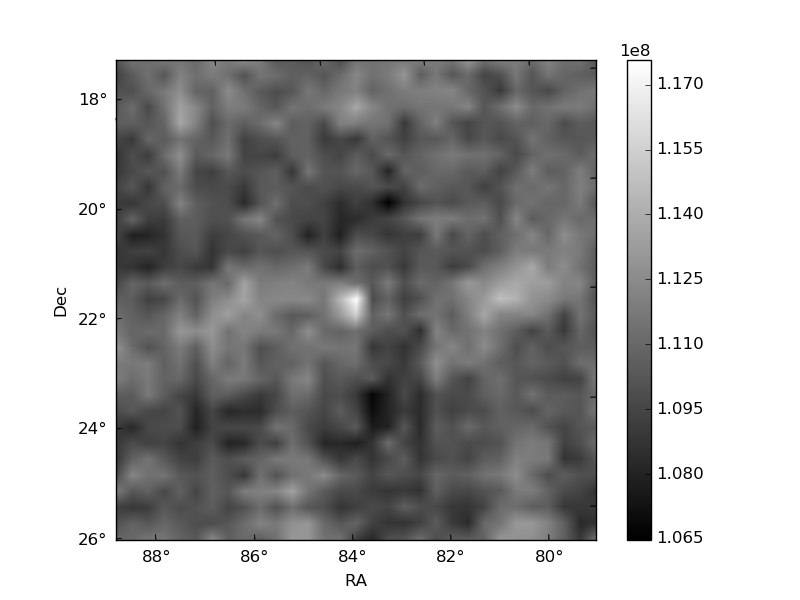
Quadrant B |
|---|---|---|---|
| Quadrant D | 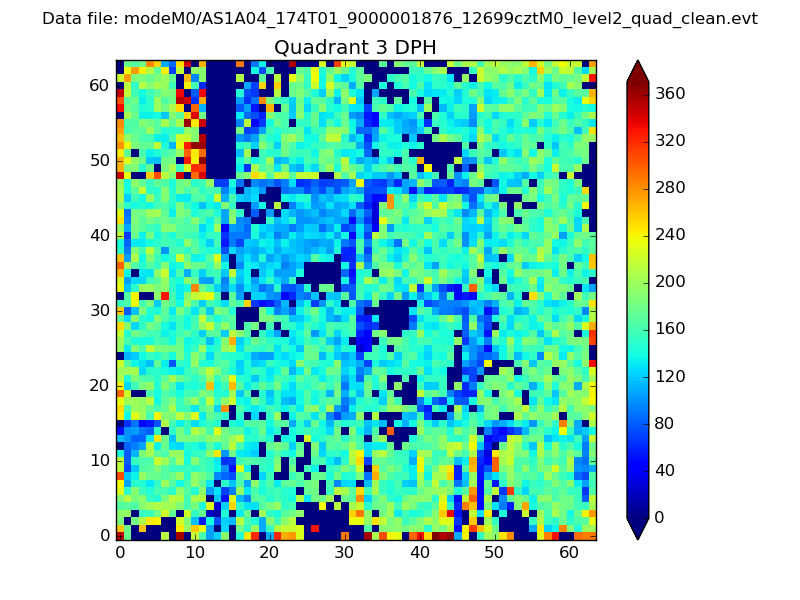 |
 |
Quadrant C |
| Plot type | Count rate plots | Images |
|---|---|---|
| Comparison with Poisson distribution Blue bars denote a histogram of data divided into 1 sec bins. Red curve is a Poisson curve with rate = median count rate of data. |
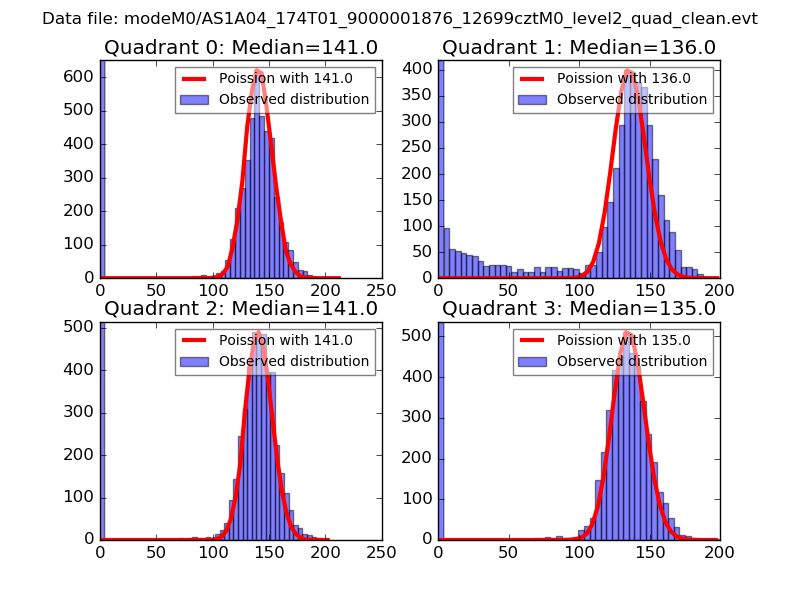 |
 |
| Quadrant-wise count rates Data is divided into 100 sec bins |
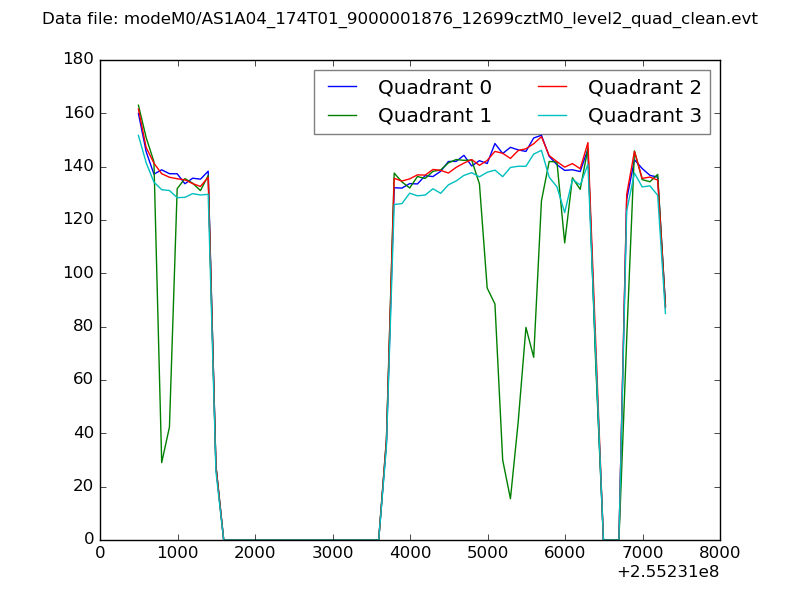 |
|
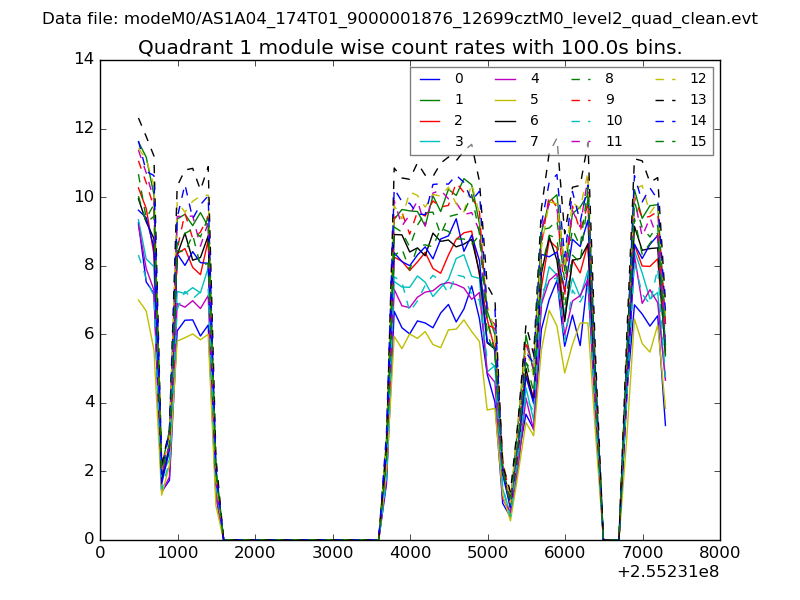
| Module-wise count rates for Quadrant A Data is divided into 100 sec bins |
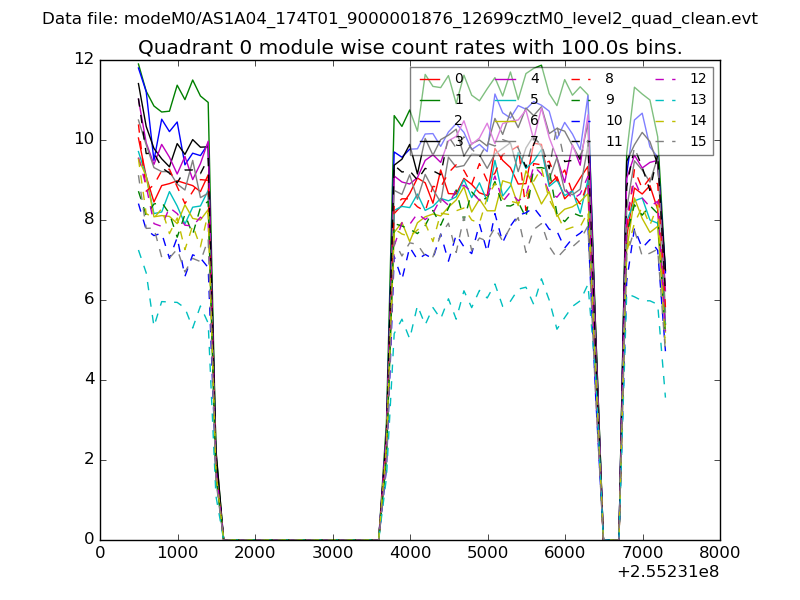 |
 |
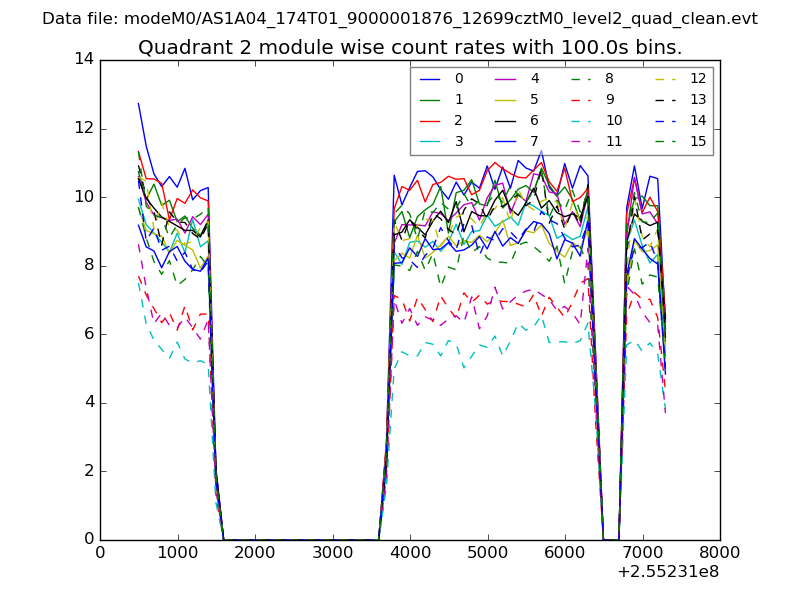
| Module-wise count rates for Quadrant B Data is divided into 100 sec bins |
 |
 |
| Module-wise count rates for Quadrant C Data is divided into 100 sec bins |
 |
 |
| Module-wise count rates for Quadrant D Data is divided into 100 sec bins |
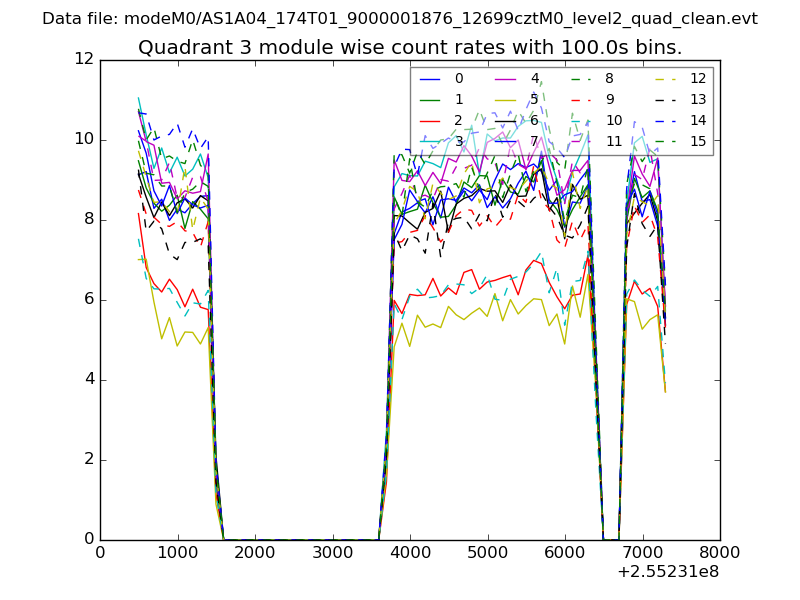 |
 |
| Parameter | Plot |
|---|---|
| CZT HV Monitor | 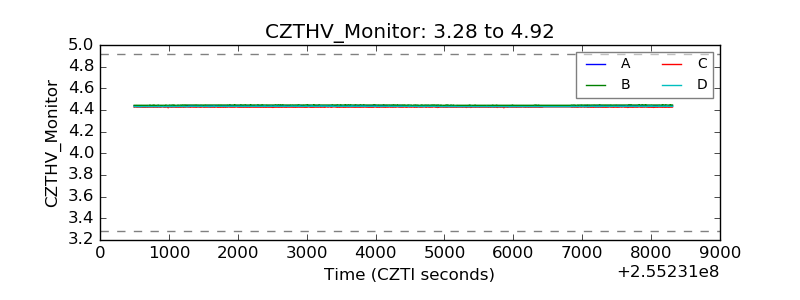 |
| D_VDD | 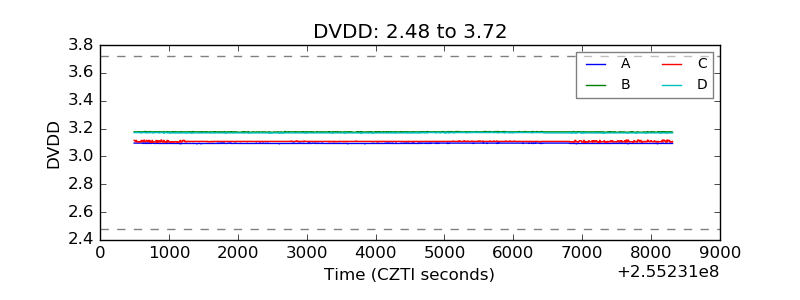 |
| Temperature 1 | 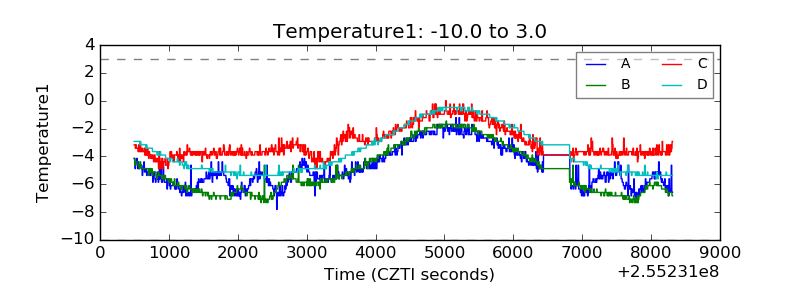 |
| Veto HV Monitor | 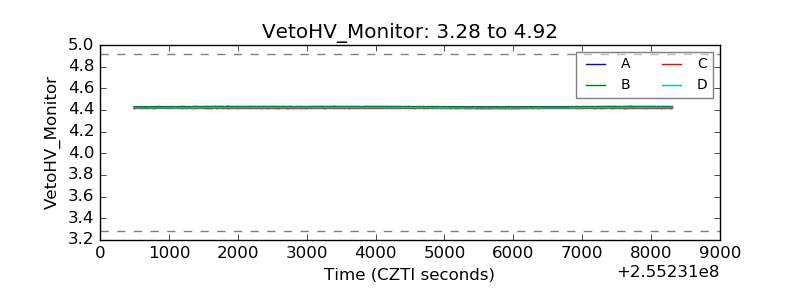 |
| Veto LLD | 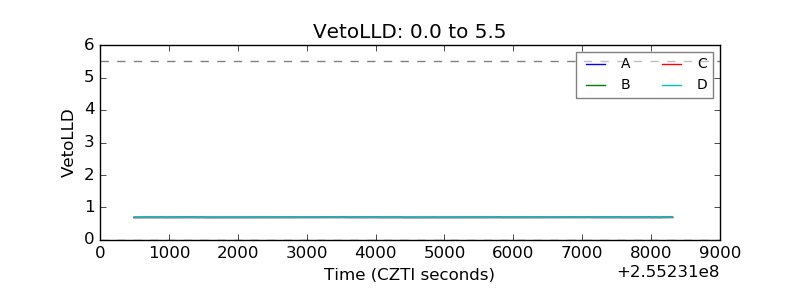 |
| Alpha Counter | 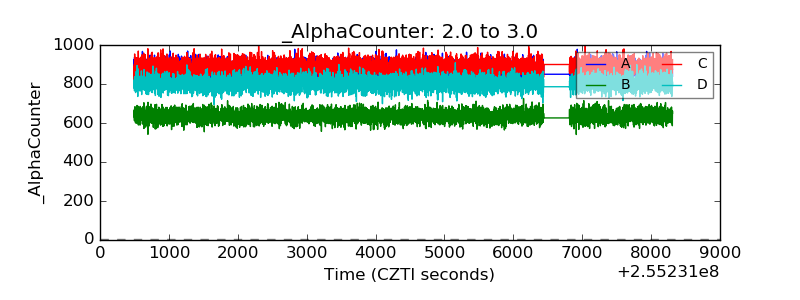 |
| _CPM_Rate | 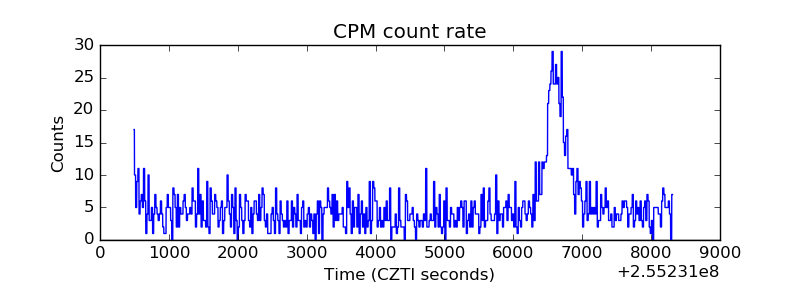 |
| CZT Counter | 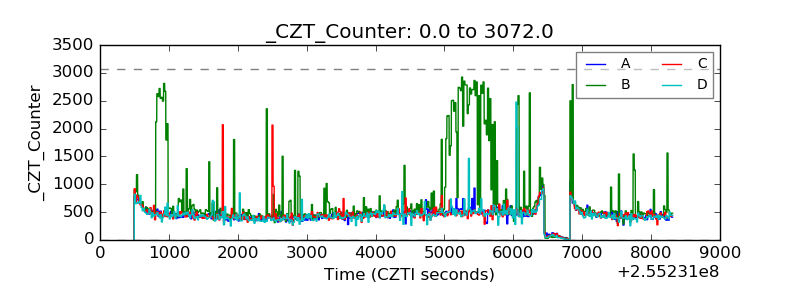 |
| +2.5 Volts monitor | 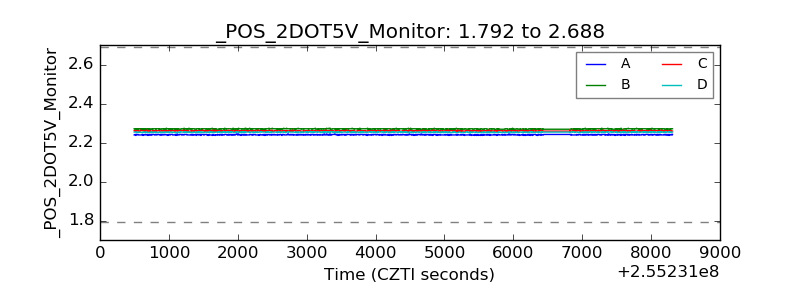 |
| +5 Volts monitor |  |
| _ROLL_ROT | 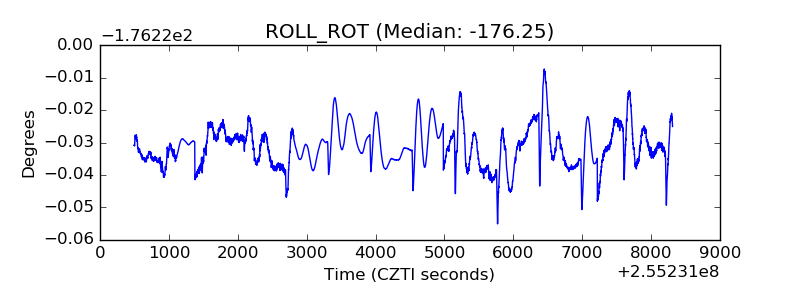 |
| _Roll_DEC | 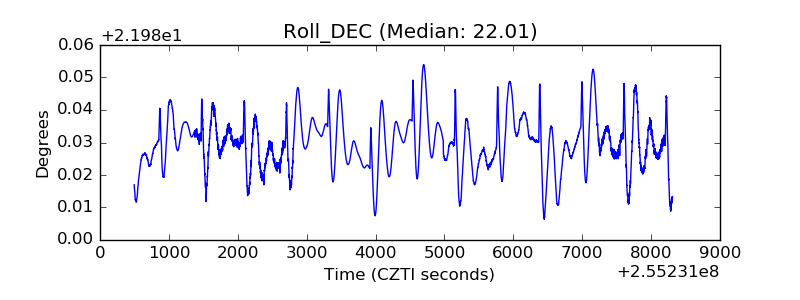 |
| _Roll_RA | 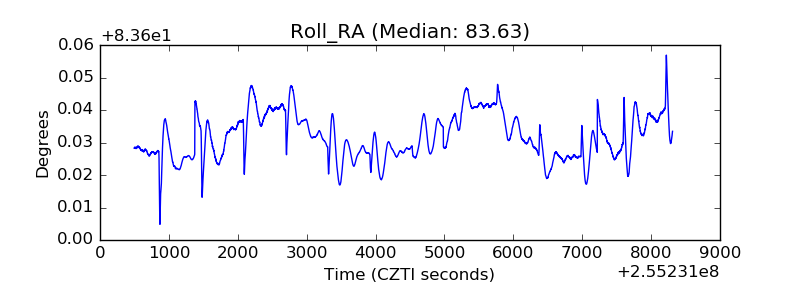 |
| Veto Counter | 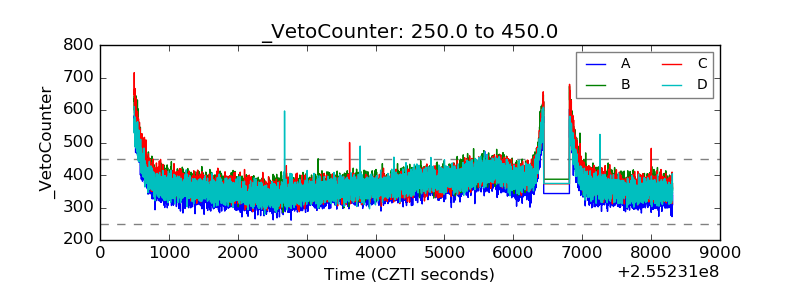 |