| Param | Original file | Final file |
|---|---|---|
| Filename | modeM0/AS1A04_174T01_9000001876_12703cztM0_level2.evt | modeM0/AS1A04_174T01_9000001876_12703cztM0_level2_quad_clean.evt |
| Size (bytes) | 507,885,120 | 86,112,000 |
| Size | 484.4 MB | 82.1 MB |
| Events in quadrant A | 3,268,617 | 552,255 |
| Events in quadrant B | 4,934,157 | 508,951 |
| Events in quadrant C | 3,211,818 | 550,610 |
| Events in quadrant D | 3,509,283 | 526,145 |
| Mode M9 | |||
|---|---|---|---|
| Quadrant | BADHDUFLAG | Total packets | Discarded packets |
| A | 0 | 13 | 0 |
| B | 0 | 13 | 0 |
| C | 0 | 13 | 0 |
| D | 0 | 14 | 0 |
| Mode M0 | |||
|---|---|---|---|
| Quadrant | BADHDUFLAG | Total packets | Discarded packets |
| A | 0 | 13791 | 3 |
| B | 0 | 18706 | 2 |
| C | 0 | 13868 | 2 |
| D | 0 | 14850 | 2 |
| Mode SS | |||
|---|---|---|---|
| Quadrant | BADHDUFLAG | Total packets | Discarded packets |
| A | 0 | 136 | 0 |
| B | 0 | 136 | 0 |
| C | 0 | 136 | 0 |
| D | 0 | 136 | 0 |
| Quadrant | Total seconds | Saturated seconds | Saturation percentage |
|---|---|---|---|
| A | 6739 | 64 | 0.949696% |
| B | 6739 | 643 | 9.541475% |
| C | 6739 | 50 | 0.741950% |
| D | 6739 | 96 | 1.424544% |
Noise dominated data is calculated using 1-second bins in cleaned event files. If a bin has >2000 counts, and if more than 50% of those come from <1% of pixels, then it is considered to be noise-dominated and hence unusable.
| Quadrant | # 1 sec bins | Bins with >0 counts | Bins with >2000 counts | High rate bins dominated by noise | Noise dominated (total time) | Noise dominated (detector-on time) | Marked lightcurve |
|---|---|---|---|---|---|---|---|
| A | 7695 | 6741 | 0 | 0 | 0.00% | 0.00% |  |
| B | 7695 | 6741 | 446 | 446 | 5.80% | 6.62% |  |
| C | 7695 | 6741 | 1 | 1 | 0.01% | 0.01% |  |
| D | 7695 | 6741 | 46 | 46 | 0.60% | 0.68% |  |
Top three noisy pixels from each quadrant. If the there are fewer than three noisy pixels in the level2.evt file, extra rows are filled as -1
| Pixel properties | Quadrant properties | ||||||
|---|---|---|---|---|---|---|---|
| Quadrant | DetID | PixID | Counts | Sigma | Mean | Median | Sigma |
| A | 8 | 15 | 18048 | 99.94 | 840 | 825 | 172.3 |
| A | 12 | 189 | 16996 | 93.84 | 840 | 825 | 172.3 |
| A | 0 | 226 | 7527 | 38.89 | 840 | 825 | 172.3 |
| B | 4 | 239 | 1629432 | 10565.15 | 802 | 783 | 154.2 |
| B | 0 | 219 | 48610 | 310.26 | 802 | 783 | 154.2 |
| B | 4 | 81 | 42699 | 271.91 | 802 | 783 | 154.2 |
| C | 15 | 208 | 41281 | 214.23 | 812 | 818 | 188.9 |
| C | 13 | 61 | 5840 | 26.59 | 812 | 818 | 188.9 |
| C | 8 | 222 | 3408 | 13.71 | 812 | 818 | 188.9 |
| D | 1 | 52 | 190761 | 961.27 | 808 | 787 | 197.6 |
| D | 1 | 255 | 122102 | 613.85 | 808 | 787 | 197.6 |
| D | 13 | 249 | 59929 | 299.26 | 808 | 787 | 197.6 |
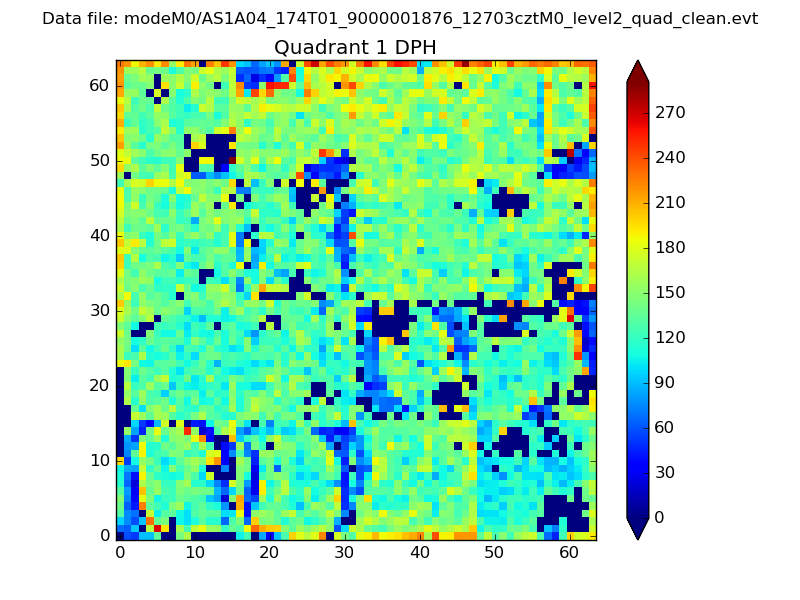
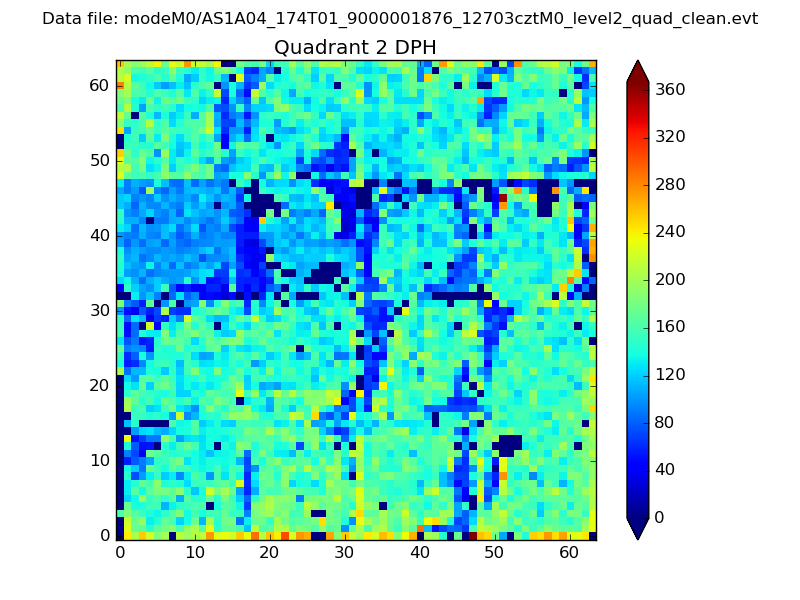
Histogram calculated using DETX and DETY for each event in the final _common_clean file
| Quadrant A | 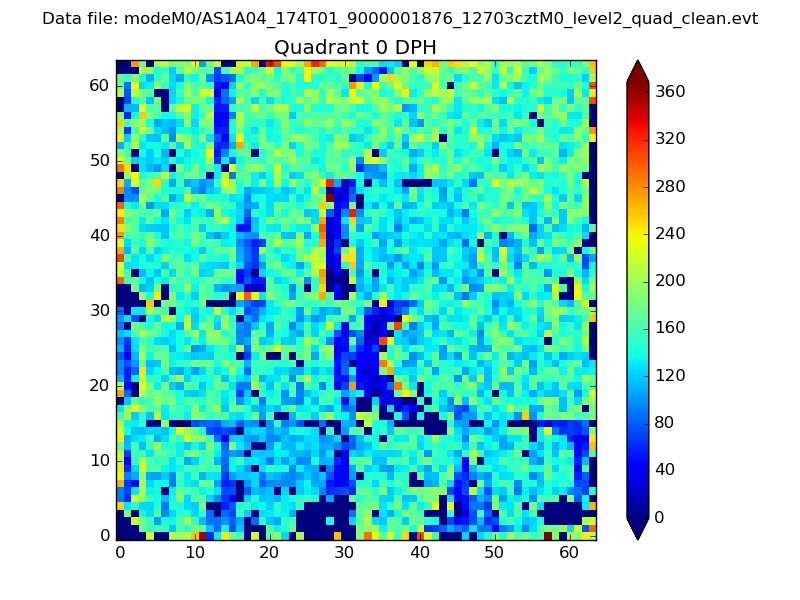 |
 |
Quadrant B |
|---|---|---|---|
| Quadrant D | 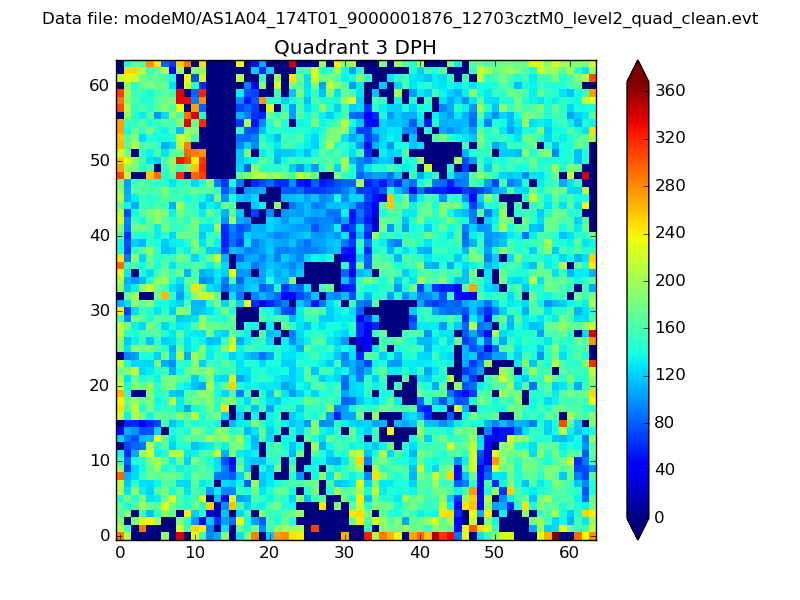 |
 |
Quadrant C |
| Plot type | Count rate plots | Images |
|---|---|---|
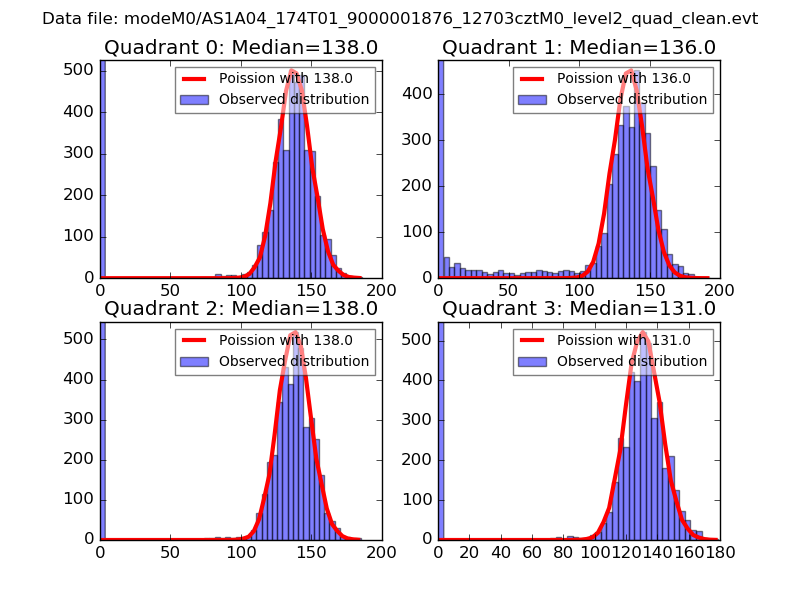
| Comparison with Poisson distribution Blue bars denote a histogram of data divided into 1 sec bins. Red curve is a Poisson curve with rate = median count rate of data. |
 |
 |
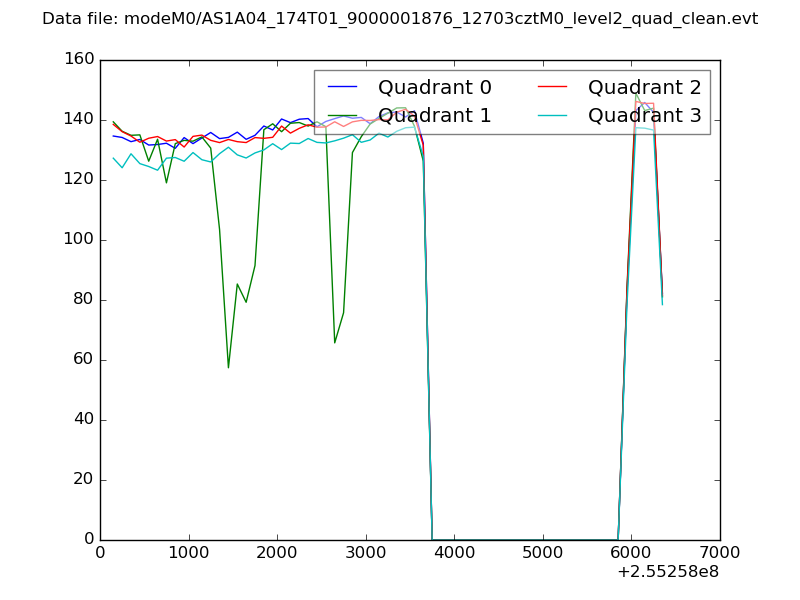
| Quadrant-wise count rates Data is divided into 100 sec bins |
 |
|
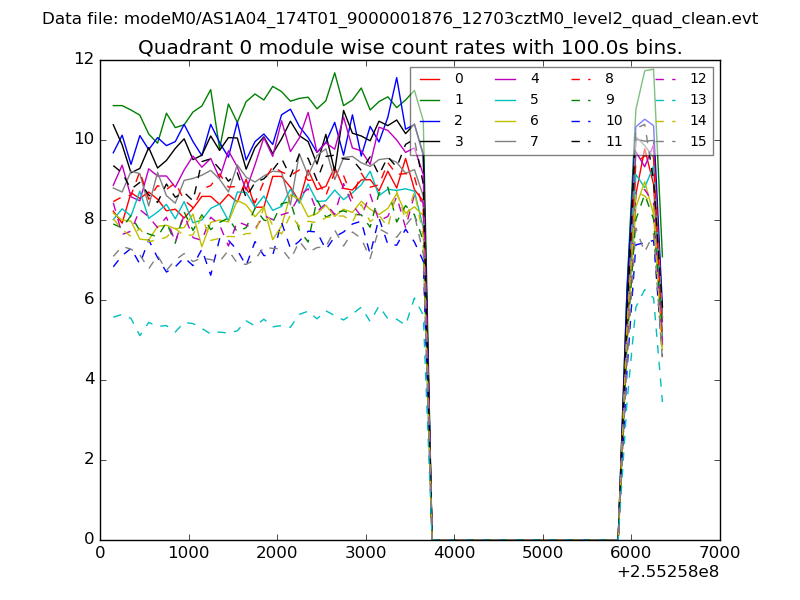
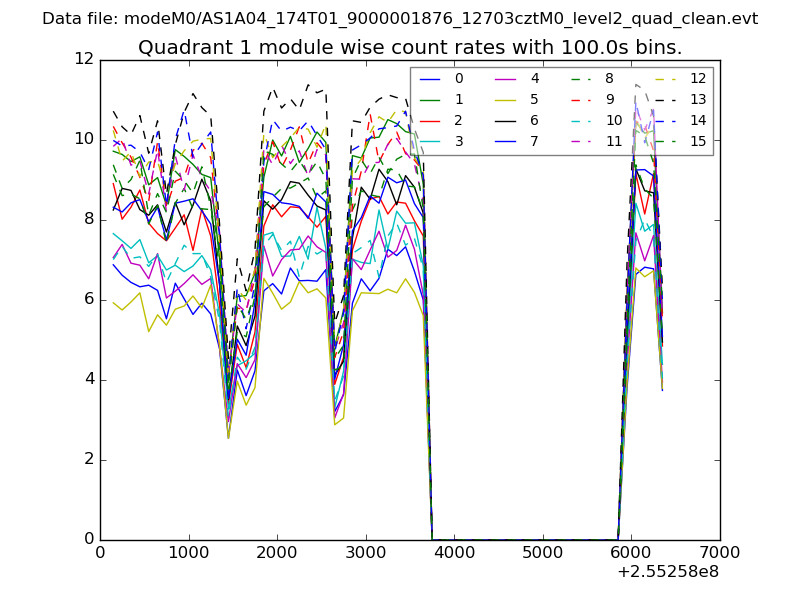
| Module-wise count rates for Quadrant A Data is divided into 100 sec bins |
 |
 |
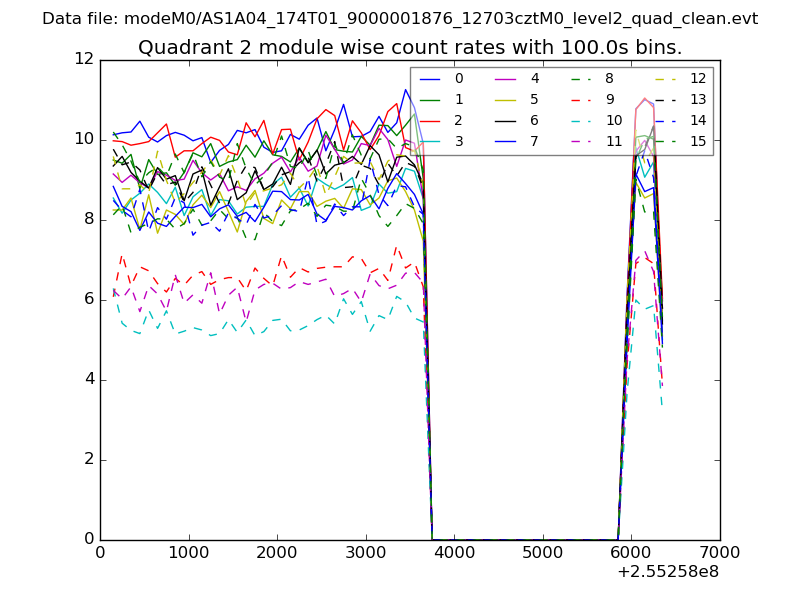
| Module-wise count rates for Quadrant B Data is divided into 100 sec bins |
 |
 |
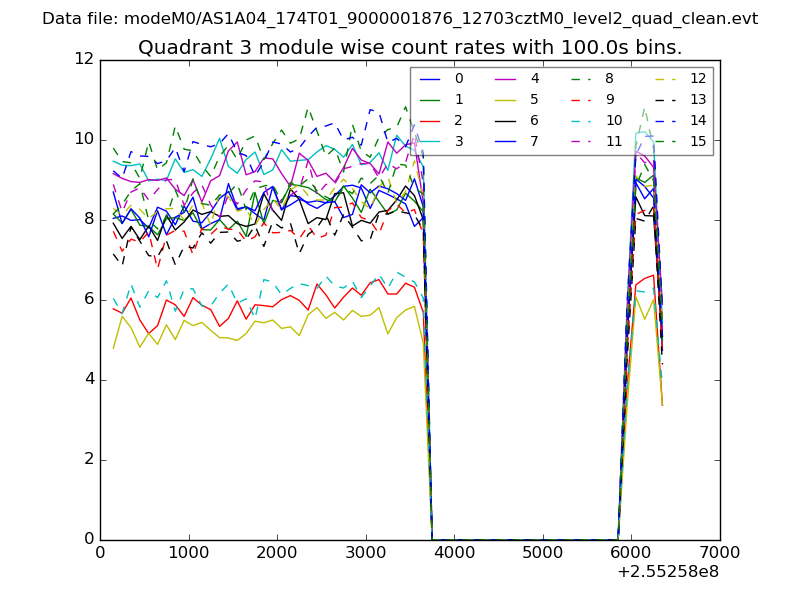
| Module-wise count rates for Quadrant C Data is divided into 100 sec bins |
 |
 |
| Module-wise count rates for Quadrant D Data is divided into 100 sec bins |
 |
 |
| Parameter | Plot |
|---|---|
| CZT HV Monitor | 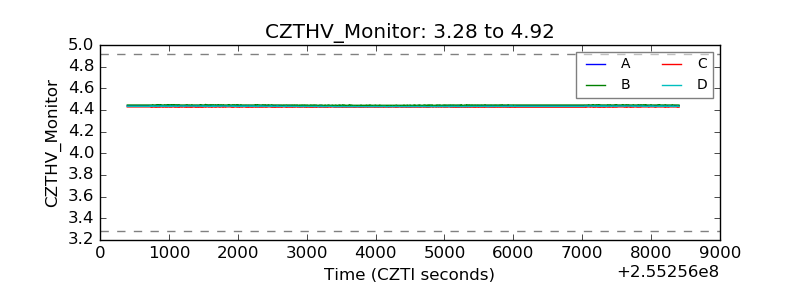 |
| D_VDD | 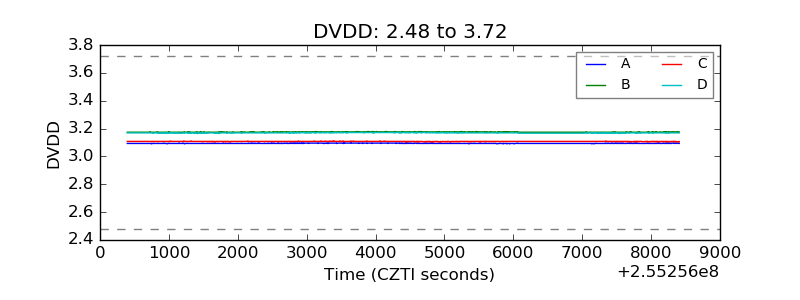 |
| Temperature 1 | 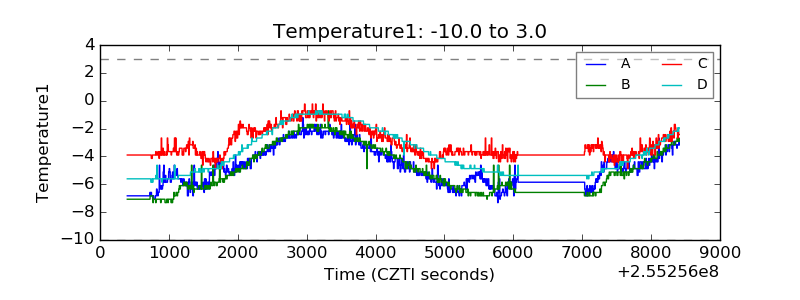 |
| Veto HV Monitor | 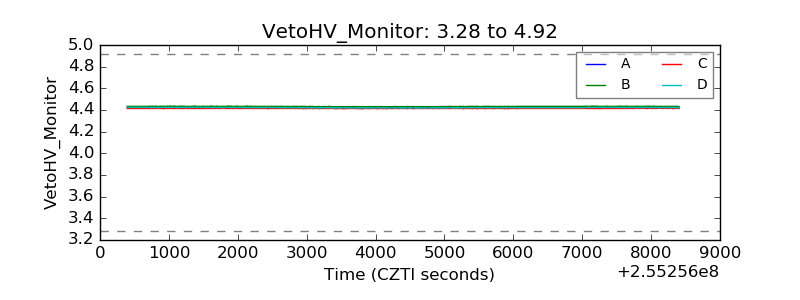 |
| Veto LLD | 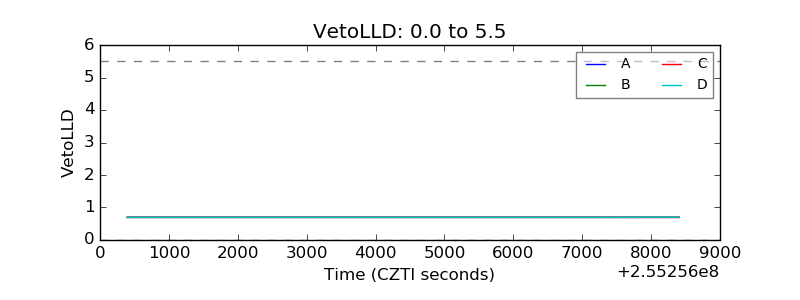 |
| Alpha Counter | 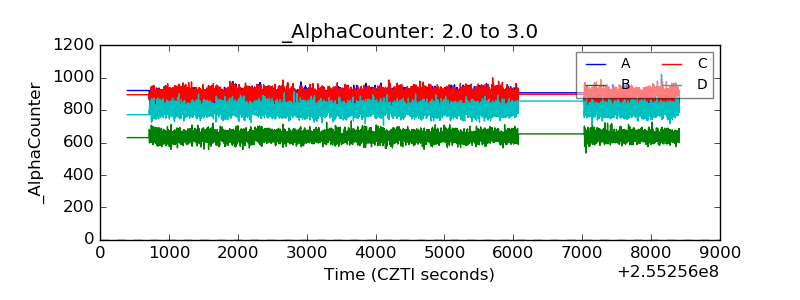 |
| _CPM_Rate | 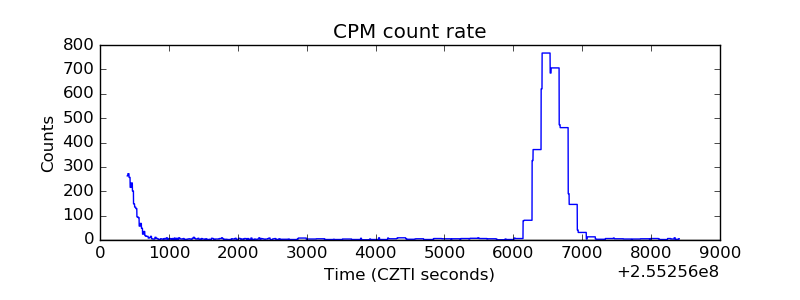 |
| CZT Counter | 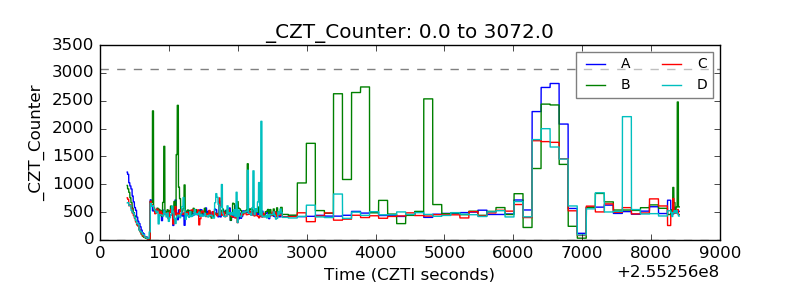 |
| +2.5 Volts monitor |  |
| +5 Volts monitor |  |
| _ROLL_ROT | 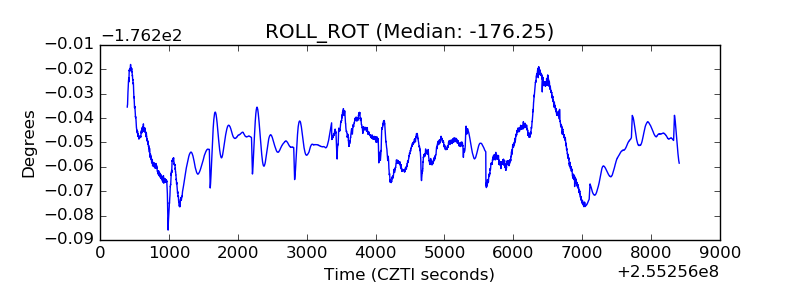 |
| _Roll_DEC | 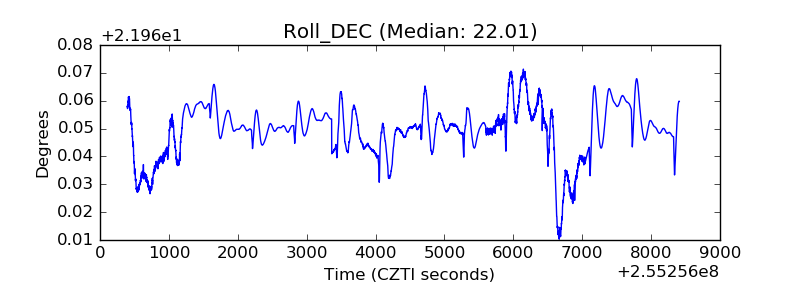 |
| _Roll_RA | 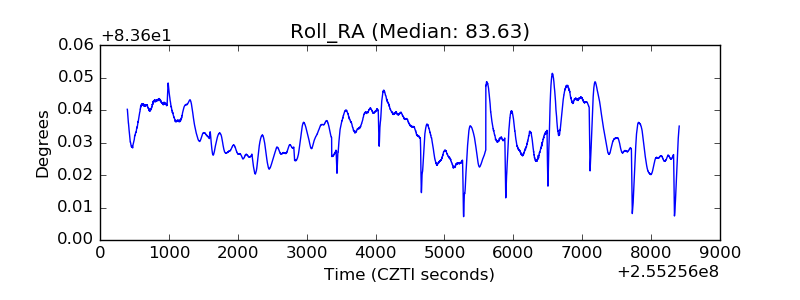 |
| Veto Counter | 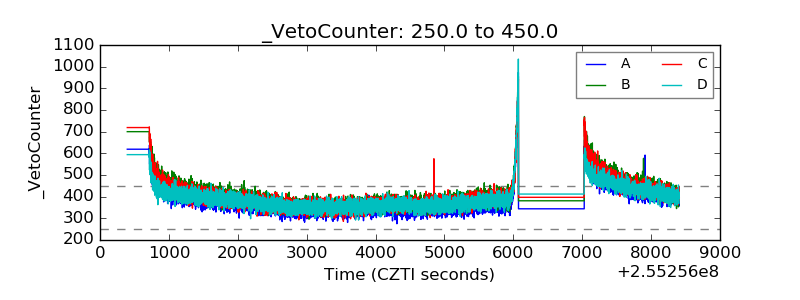 |