| Param | Original file | Final file |
|---|---|---|
| Filename | modeM0/AS1A04_174T01_9000001876_12705cztM0_level2.evt | modeM0/AS1A04_174T01_9000001876_12705cztM0_level2_quad_clean.evt |
| Size (bytes) | 548,735,040 | 94,112,640 |
| Size | 523.3 MB | 89.8 MB |
| Events in quadrant A | 3,265,132 | 631,501 |
| Events in quadrant B | 6,070,846 | 542,376 |
| Events in quadrant C | 3,497,199 | 619,519 |
| Events in quadrant D | 3,340,725 | 599,561 |
| Mode M9 | |||
|---|---|---|---|
| Quadrant | BADHDUFLAG | Total packets | Discarded packets |
| A | 0 | 14 | 0 |
| B | 0 | 14 | 0 |
| C | 0 | 14 | 0 |
| D | 0 | 15 | 0 |
| Mode M0 | |||
|---|---|---|---|
| Quadrant | BADHDUFLAG | Total packets | Discarded packets |
| A | 0 | 13722 | 3 |
| B | 0 | 22269 | 2 |
| C | 0 | 14540 | 2 |
| D | 0 | 14126 | 2 |
| Mode SS | |||
|---|---|---|---|
| Quadrant | BADHDUFLAG | Total packets | Discarded packets |
| A | 0 | 132 | 0 |
| B | 0 | 132 | 0 |
| C | 0 | 132 | 0 |
| D | 0 | 132 | 0 |
| Quadrant | Total seconds | Saturated seconds | Saturation percentage |
|---|---|---|---|
| A | 6554 | 77 | 1.174855% |
| B | 6554 | 1120 | 17.088801% |
| C | 6554 | 125 | 1.907232% |
| D | 6554 | 94 | 1.434239% |
Noise dominated data is calculated using 1-second bins in cleaned event files. If a bin has >2000 counts, and if more than 50% of those come from <1% of pixels, then it is considered to be noise-dominated and hence unusable.
| Quadrant | # 1 sec bins | Bins with >0 counts | Bins with >2000 counts | High rate bins dominated by noise | Noise dominated (total time) | Noise dominated (detector-on time) | Marked lightcurve |
|---|---|---|---|---|---|---|---|
| A | 7615 | 6556 | 0 | 0 | 0.00% | 0.00% | 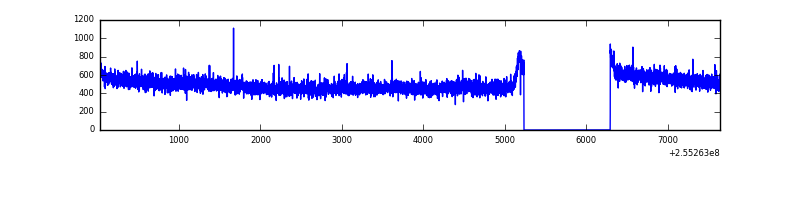 |
| B | 7615 | 6556 | 823 | 823 | 10.81% | 12.55% | 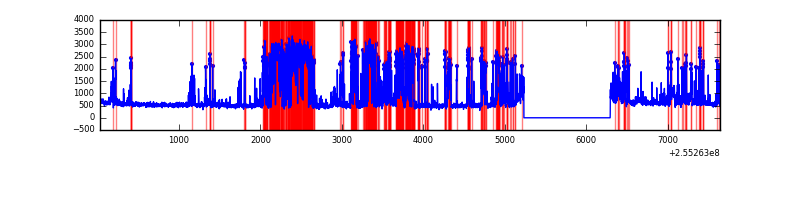 |
| C | 7615 | 6556 | 73 | 73 | 0.96% | 1.11% | 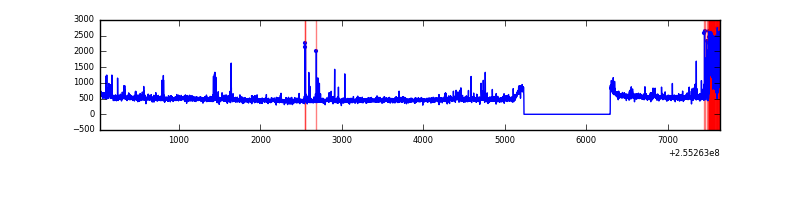 |
| D | 7615 | 6556 | 29 | 29 | 0.38% | 0.44% | 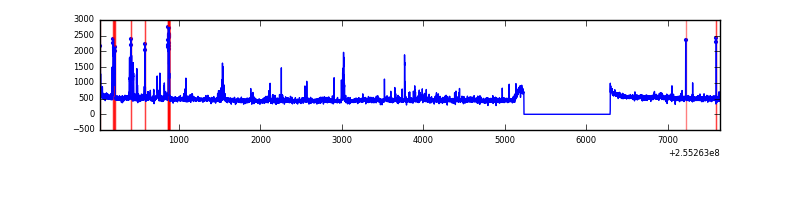 |
Top three noisy pixels from each quadrant. If the there are fewer than three noisy pixels in the level2.evt file, extra rows are filled as -1
| Pixel properties | Quadrant properties | ||||||
|---|---|---|---|---|---|---|---|
| Quadrant | DetID | PixID | Counts | Sigma | Mean | Median | Sigma |
| A | 8 | 15 | 13065 | 70.66 | 843 | 826 | 173.2 |
| A | 12 | 189 | 10426 | 55.43 | 843 | 826 | 173.2 |
| A | 0 | 226 | 7401 | 37.96 | 843 | 826 | 173.2 |
| B | 4 | 239 | 2480994 | 17038.09 | 760 | 744 | 145.6 |
| B | 3 | 64 | 392417 | 2690.6 | 760 | 744 | 145.6 |
| B | 4 | 81 | 76991 | 523.78 | 760 | 744 | 145.6 |
| C | 15 | 208 | 356361 | 1926.27 | 804 | 813 | 184.6 |
| C | 13 | 61 | 5952 | 27.84 | 804 | 813 | 184.6 |
| C | 8 | 222 | 2547 | 9.39 | 804 | 813 | 184.6 |
| D | 1 | 255 | 122373 | 569.75 | 801 | 788 | 213.4 |
| D | 8 | 195 | 33190 | 151.84 | 801 | 788 | 213.4 |
| D | 13 | 238 | 26739 | 121.61 | 801 | 788 | 213.4 |
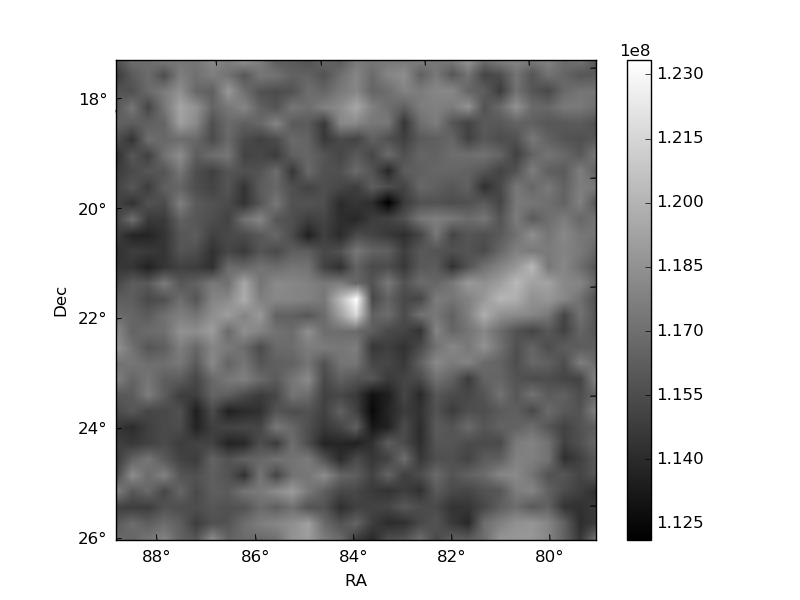
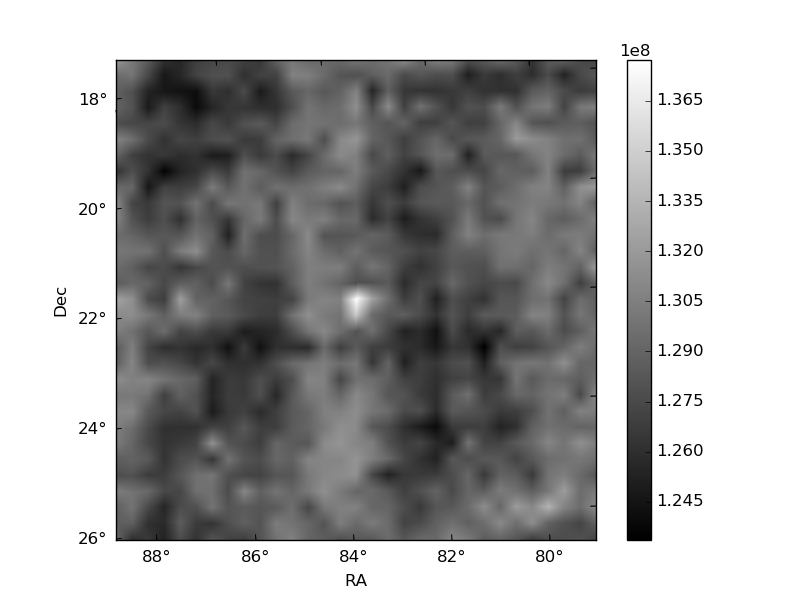
Histogram calculated using DETX and DETY for each event in the final _common_clean file
| Quadrant A |  |
 |
Quadrant B |
|---|---|---|---|
| Quadrant D |  |
 |
Quadrant C |
| Plot type | Count rate plots | Images |
|---|---|---|
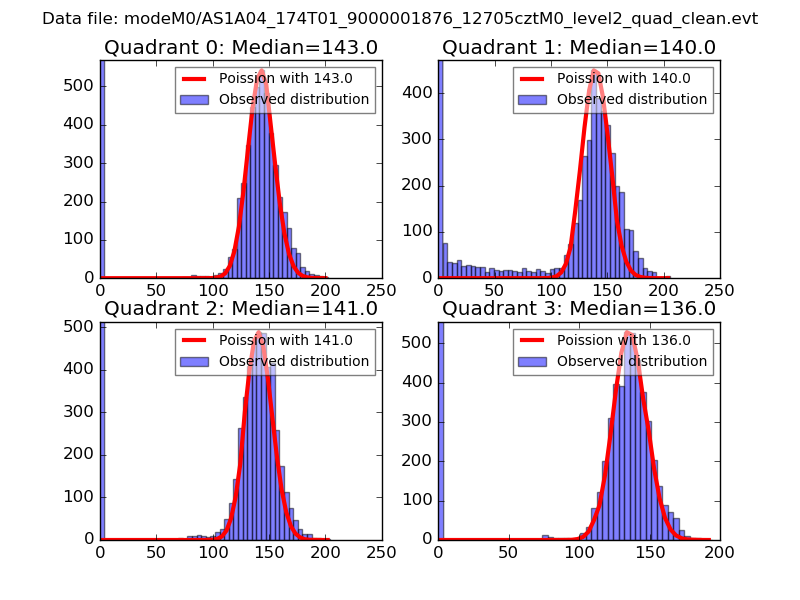
| Comparison with Poisson distribution Blue bars denote a histogram of data divided into 1 sec bins. Red curve is a Poisson curve with rate = median count rate of data. |
 |
 |
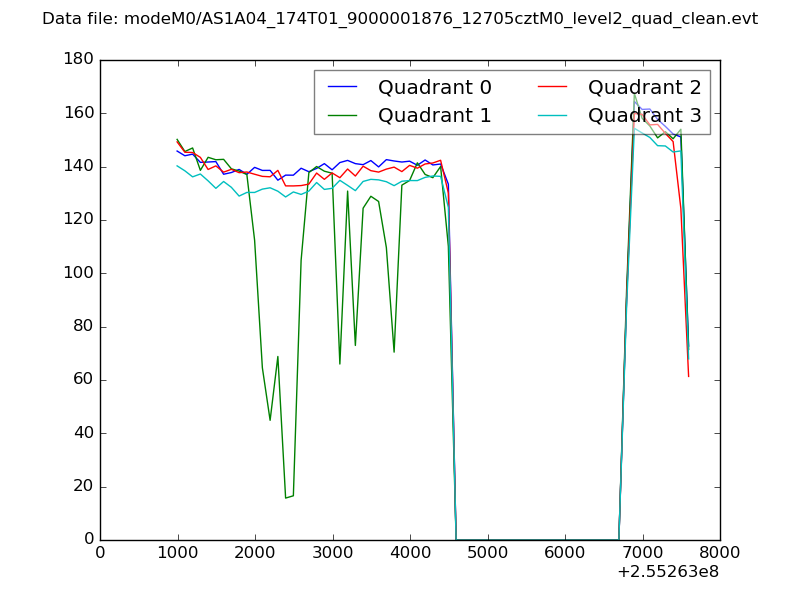
| Quadrant-wise count rates Data is divided into 100 sec bins |
 |
|
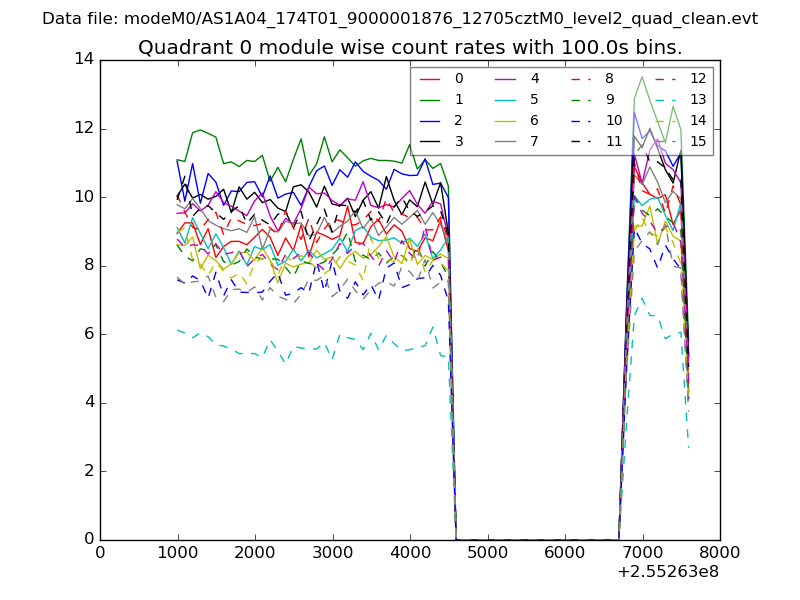
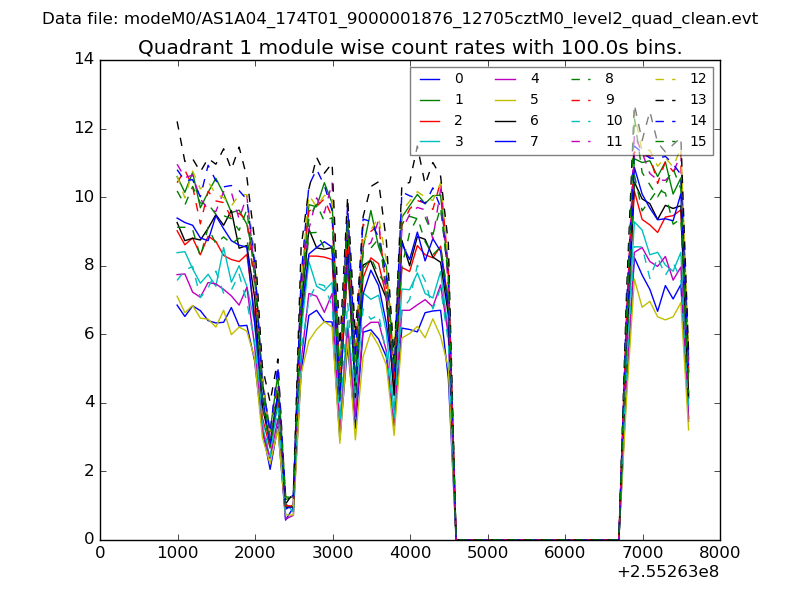
| Module-wise count rates for Quadrant A Data is divided into 100 sec bins |
 |
 |
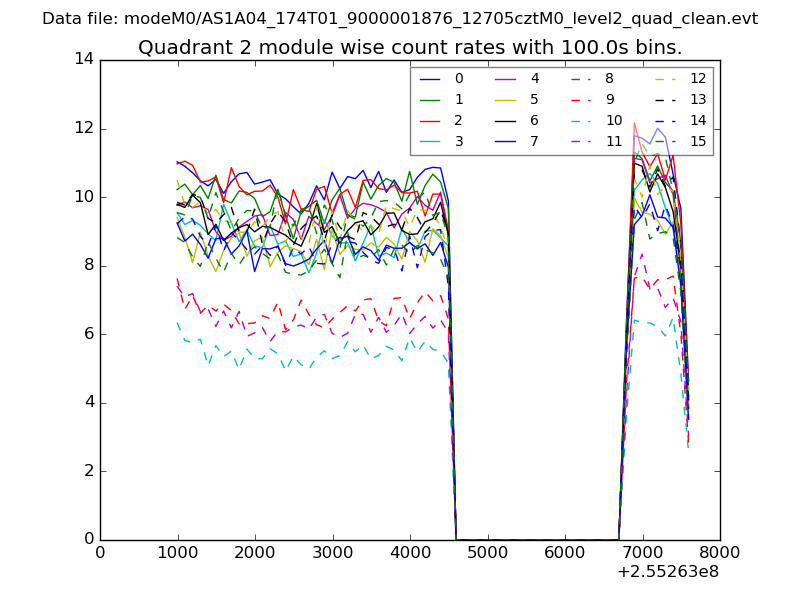
| Module-wise count rates for Quadrant B Data is divided into 100 sec bins |
 |
 |
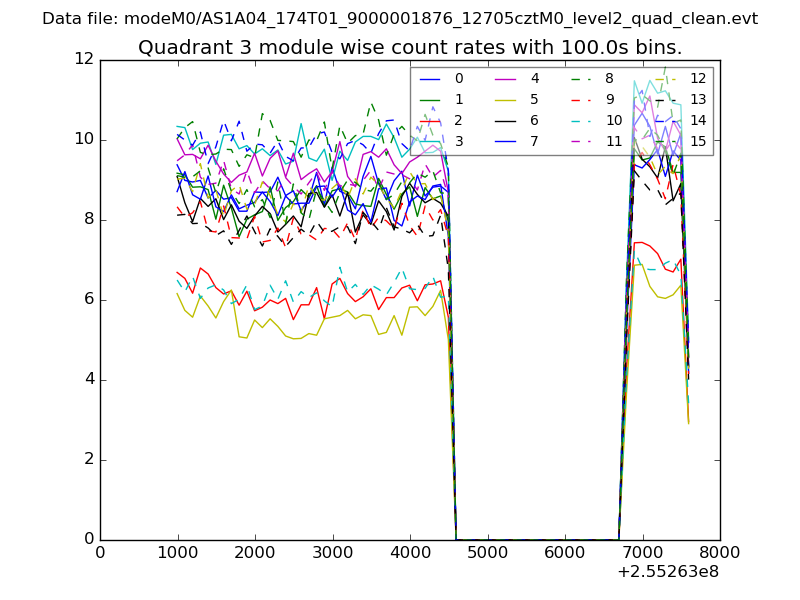
| Module-wise count rates for Quadrant C Data is divided into 100 sec bins |
 |
 |
| Module-wise count rates for Quadrant D Data is divided into 100 sec bins |
 |
 |
| Parameter | Plot |
|---|---|
| CZT HV Monitor | 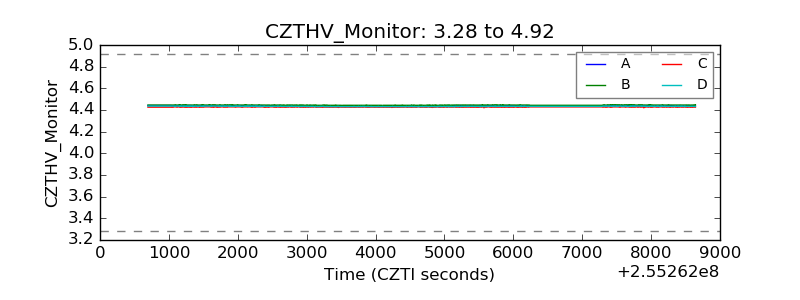 |
| D_VDD | 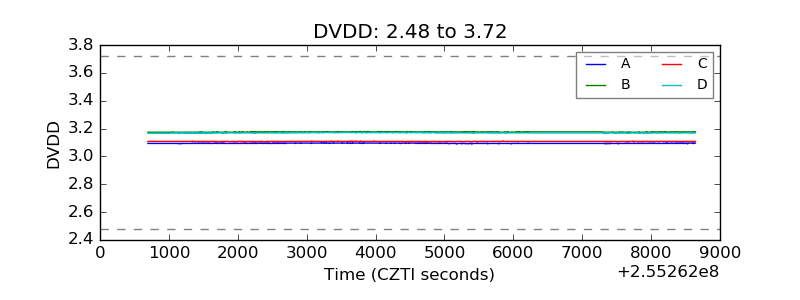 |
| Temperature 1 | 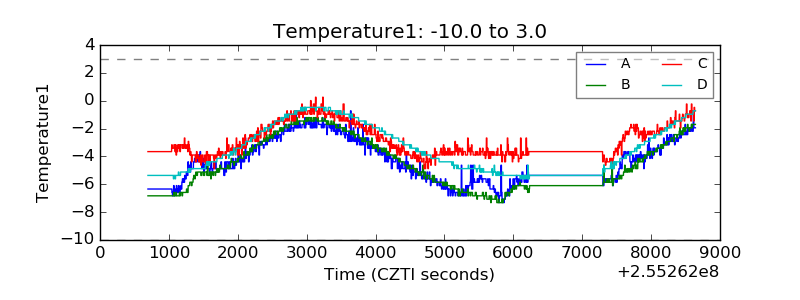 |
| Veto HV Monitor | 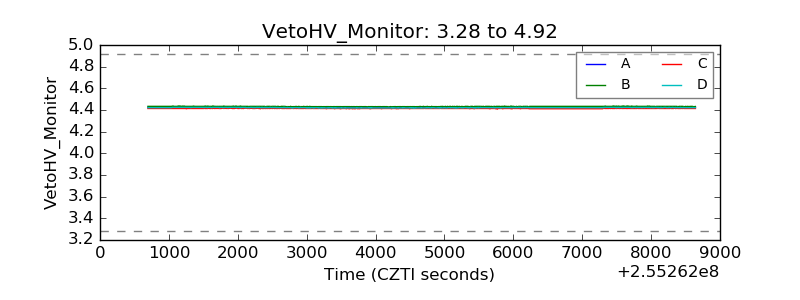 |
| Veto LLD | 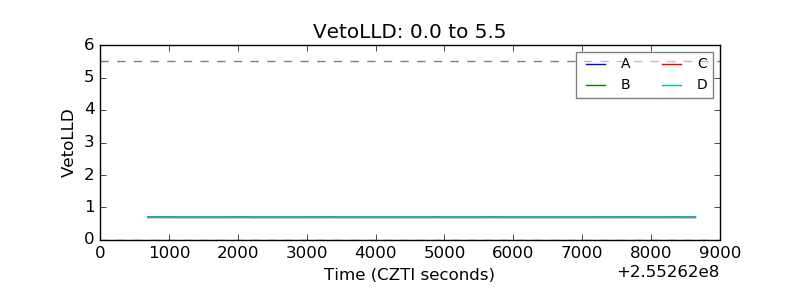 |
| Alpha Counter | 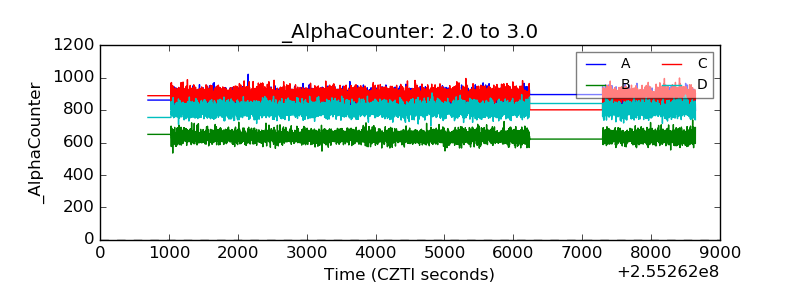 |
| _CPM_Rate | 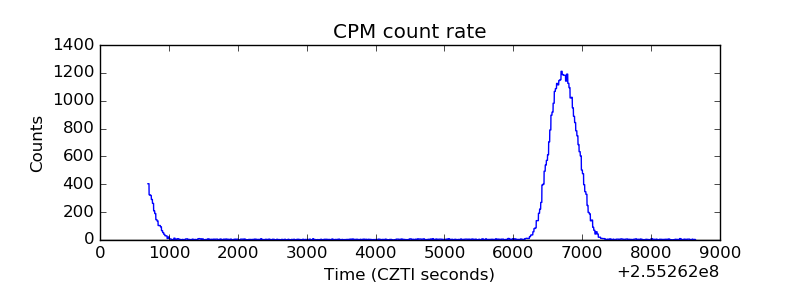 |
| CZT Counter |  |
| +2.5 Volts monitor |  |
| +5 Volts monitor |  |
| _ROLL_ROT | 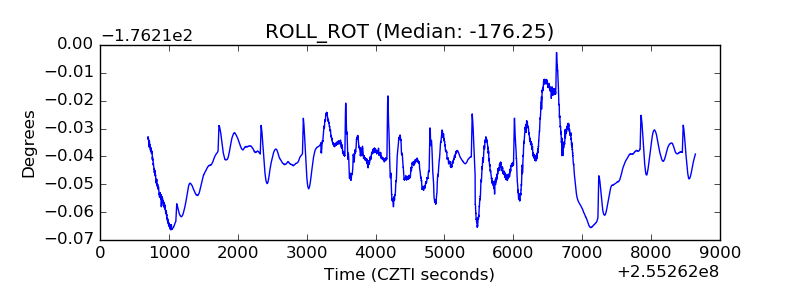 |
| _Roll_DEC | 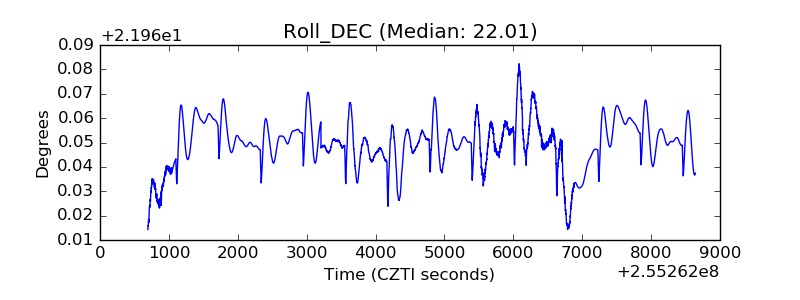 |
| _Roll_RA | 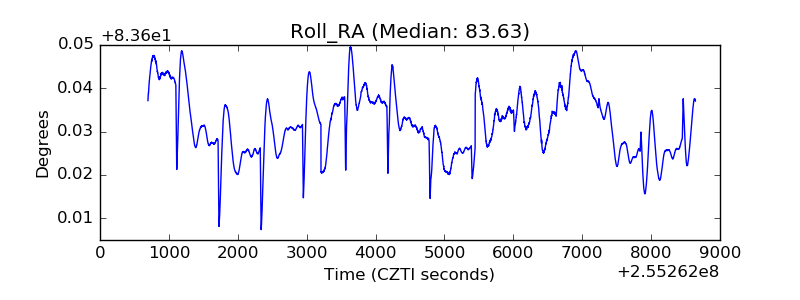 |
| Veto Counter | 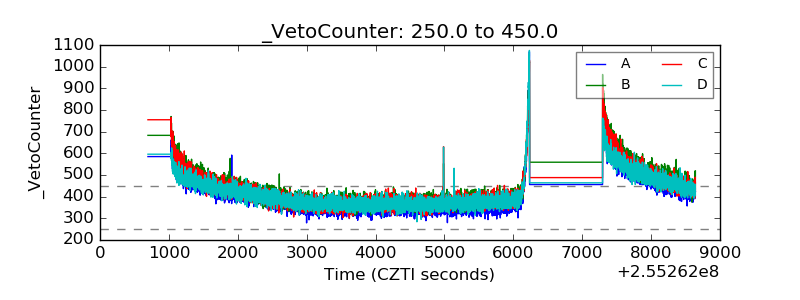 |