| Param | Original file | Final file |
|---|---|---|
| Filename | modeM0/AS1A04_174T01_9000001876_12708cztM0_level2.evt | modeM0/AS1A04_174T01_9000001876_12708cztM0_level2_quad_clean.evt |
| Size (bytes) | 615,136,320 | 97,729,920 |
| Size | 586.6 MB | 93.2 MB |
| Events in quadrant A | 3,084,768 | 693,742 |
| Events in quadrant B | 5,884,667 | 553,529 |
| Events in quadrant C | 2,951,673 | 674,708 |
| Events in quadrant D | 6,301,639 | 617,743 |
| Mode M9 | |||
|---|---|---|---|
| Quadrant | BADHDUFLAG | Total packets | Discarded packets |
| A | 0 | 13 | 0 |
| B | 0 | 13 | 0 |
| C | 0 | 13 | 0 |
| D | 0 | 13 | 0 |
| Mode M0 | |||
|---|---|---|---|
| Quadrant | BADHDUFLAG | Total packets | Discarded packets |
| A | 0 | 12769 | 2 |
| B | 0 | 21340 | 1 |
| C | 0 | 12487 | 1 |
| D | 0 | 22694 | 1 |
| Mode SS | |||
|---|---|---|---|
| Quadrant | BADHDUFLAG | Total packets | Discarded packets |
| A | 0 | 122 | 0 |
| B | 0 | 122 | 0 |
| C | 0 | 122 | 0 |
| D | 0 | 122 | 0 |
| Quadrant | Total seconds | Saturated seconds | Saturation percentage |
|---|---|---|---|
| A | 6002 | 90 | 1.499500% |
| B | 6002 | 1322 | 22.025991% |
| C | 6002 | 50 | 0.833056% |
| D | 6002 | 1145 | 19.076974% |
Noise dominated data is calculated using 1-second bins in cleaned event files. If a bin has >2000 counts, and if more than 50% of those come from <1% of pixels, then it is considered to be noise-dominated and hence unusable.
| Quadrant | # 1 sec bins | Bins with >0 counts | Bins with >2000 counts | High rate bins dominated by noise | Noise dominated (total time) | Noise dominated (detector-on time) | Marked lightcurve |
|---|---|---|---|---|---|---|---|
| A | 7288 | 6004 | 0 | 0 | 0.00% | 0.00% | 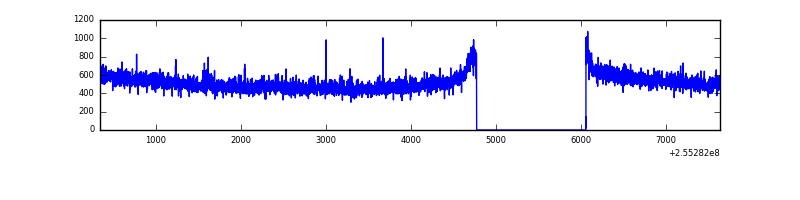 |
| B | 7288 | 6004 | 1006 | 1006 | 13.80% | 16.76% | 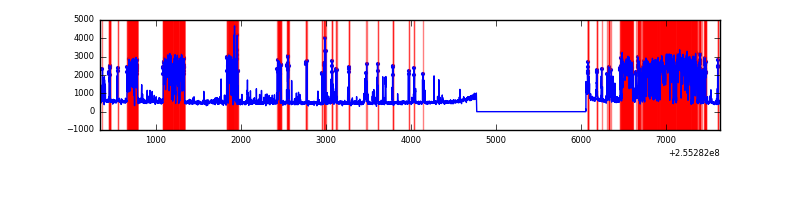 |
| C | 7288 | 6004 | 0 | 0 | 0.00% | 0.00% | 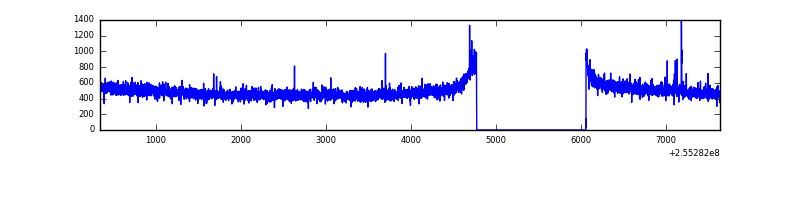 |
| D | 7288 | 6004 | 1115 | 1115 | 15.30% | 18.57% | 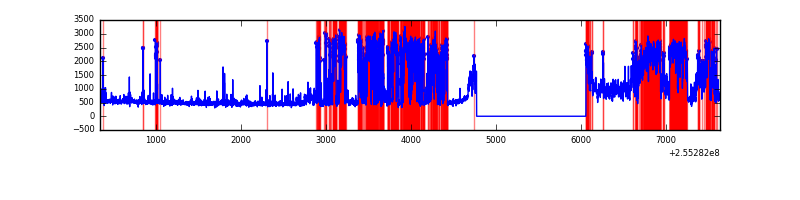 |
Top three noisy pixels from each quadrant. If the there are fewer than three noisy pixels in the level2.evt file, extra rows are filled as -1
| Pixel properties | Quadrant properties | ||||||
|---|---|---|---|---|---|---|---|
| Quadrant | DetID | PixID | Counts | Sigma | Mean | Median | Sigma |
| A | 12 | 189 | 34460 | 210.95 | 785 | 771 | 159.7 |
| A | 8 | 15 | 26326 | 160.02 | 785 | 771 | 159.7 |
| A | 15 | 239 | 10370 | 60.11 | 785 | 771 | 159.7 |
| B | 4 | 239 | 3147968 | 24926.67 | 675 | 662 | 126.3 |
| B | 3 | 209 | 31997 | 248.17 | 675 | 662 | 126.3 |
| B | 0 | 197 | 23257 | 178.95 | 675 | 662 | 126.3 |
| C | 15 | 208 | 19746 | 110.18 | 751 | 758 | 172.3 |
| C | 13 | 61 | 5668 | 28.49 | 751 | 758 | 172.3 |
| C | 14 | 234 | 4097 | 19.37 | 751 | 758 | 172.3 |
| D | 1 | 52 | 3433069 | 19386.92 | 702 | 687 | 177.0 |
| D | 10 | 157 | 126270 | 709.32 | 702 | 687 | 177.0 |
| D | 8 | 195 | 42445 | 235.86 | 702 | 687 | 177.0 |
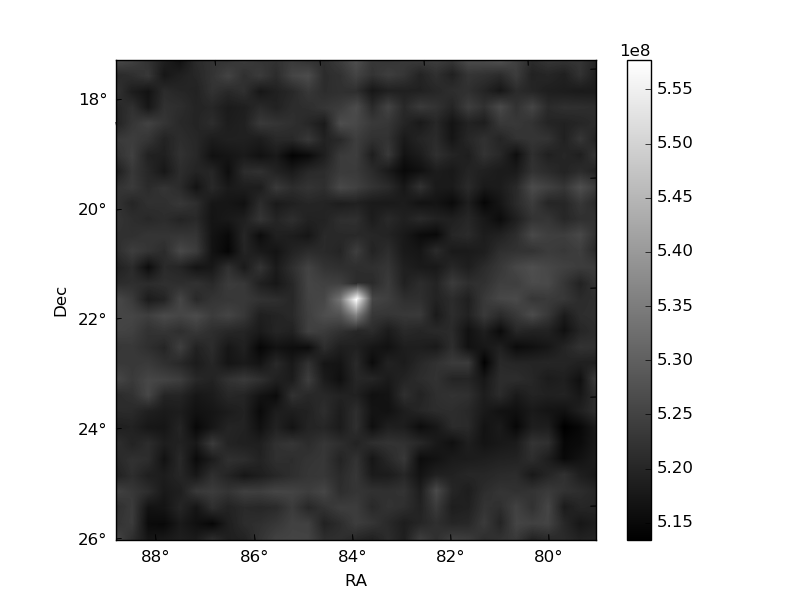
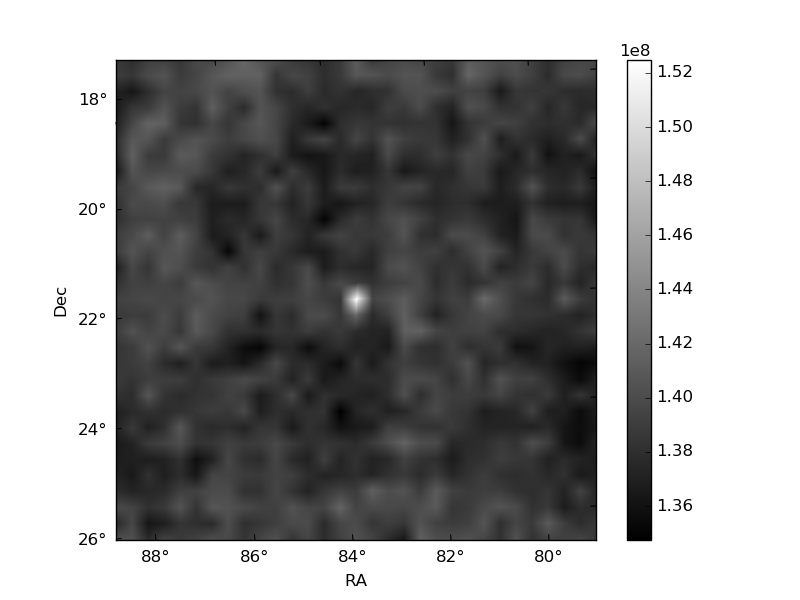
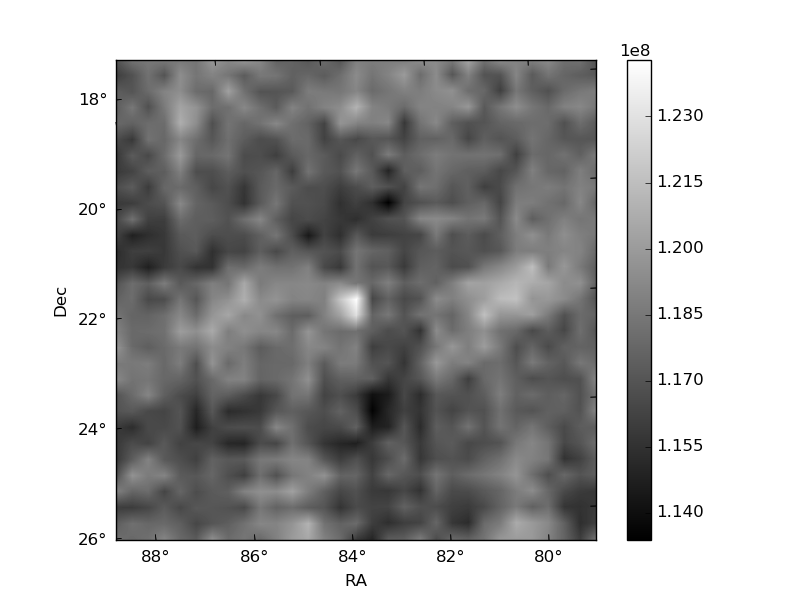
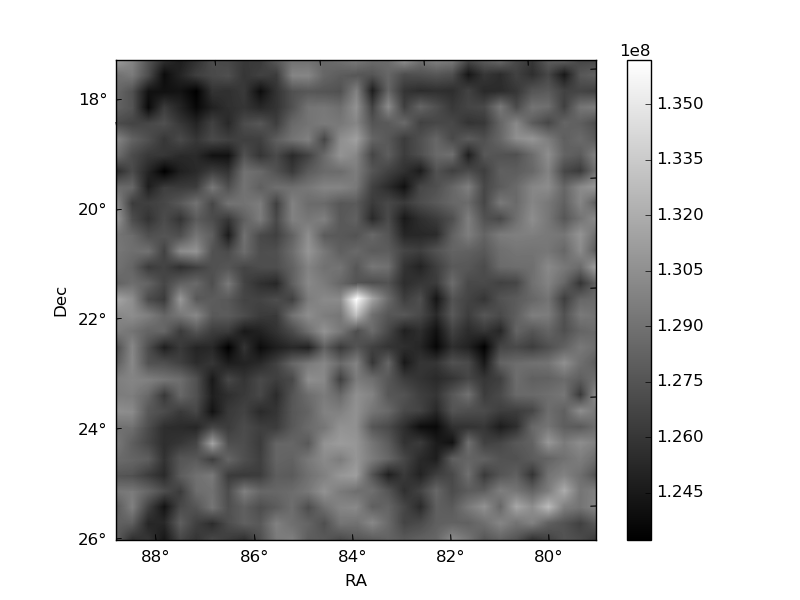
Histogram calculated using DETX and DETY for each event in the final _common_clean file
| Quadrant A | 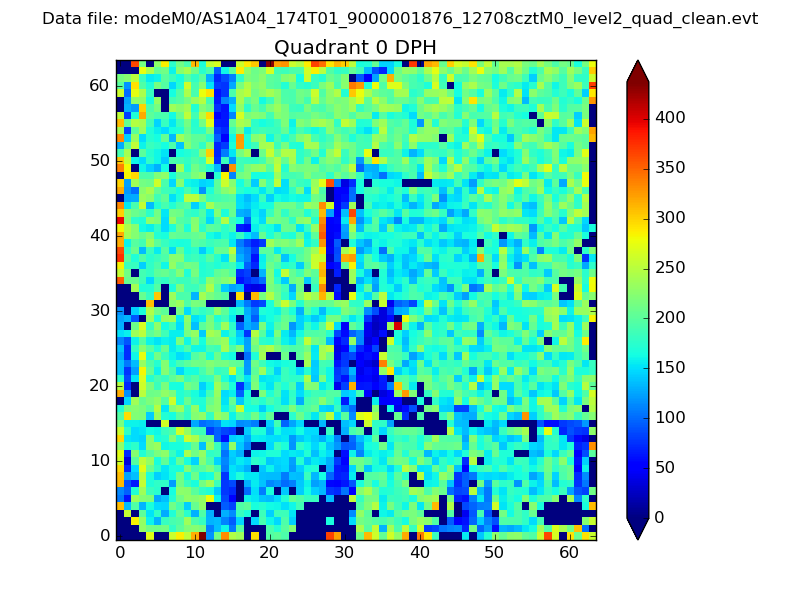 |
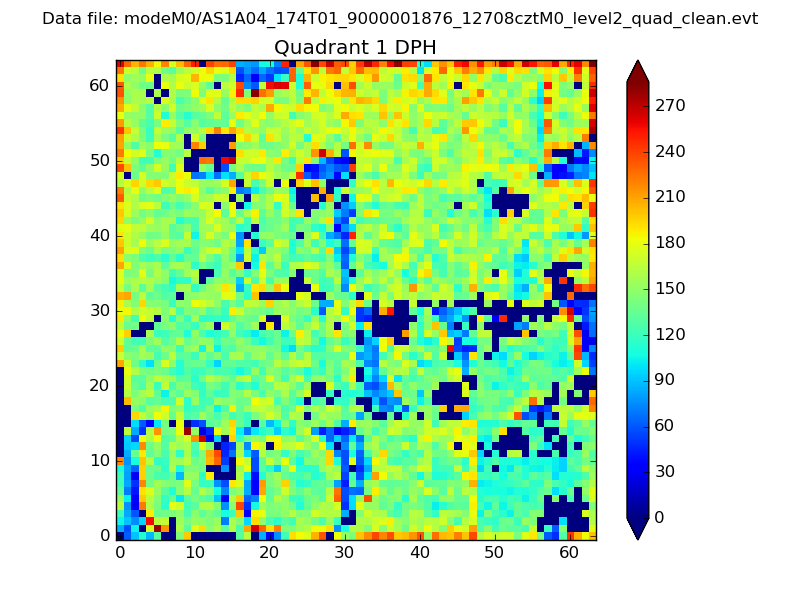 |
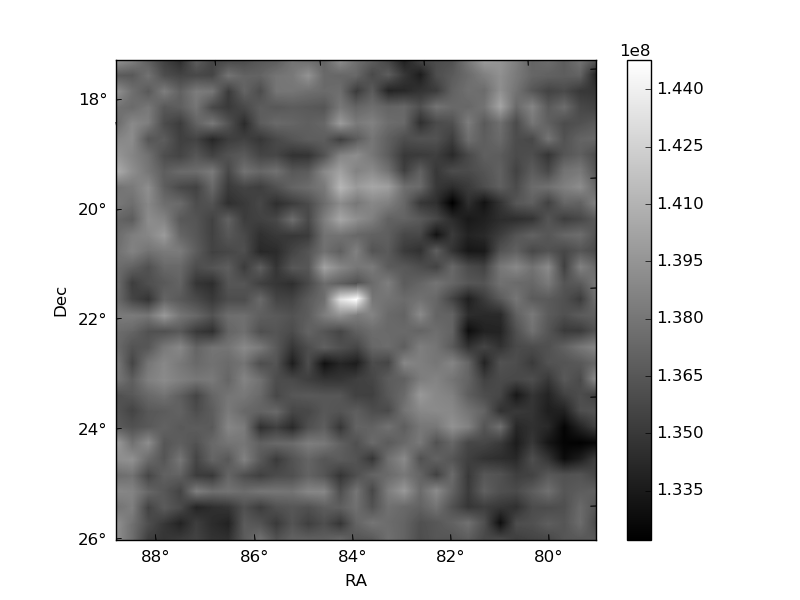
Quadrant B |
|---|---|---|---|
| Quadrant D | 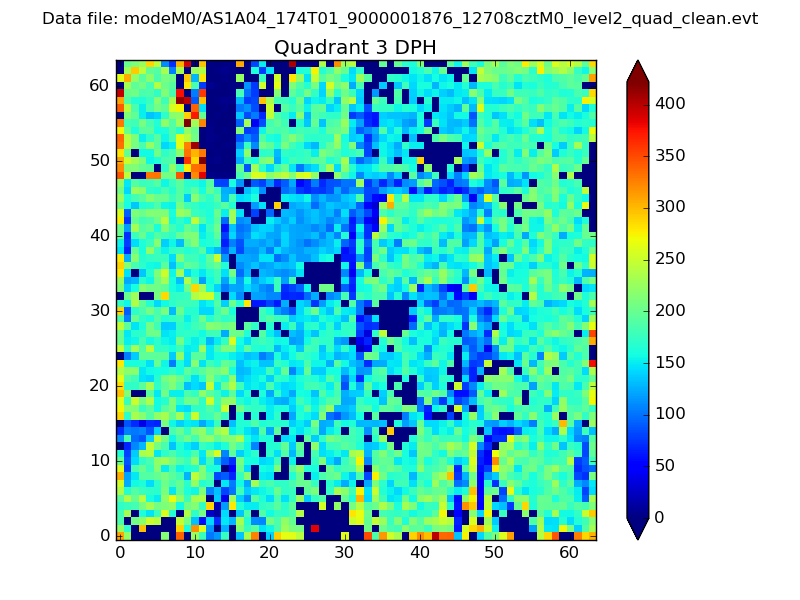 |
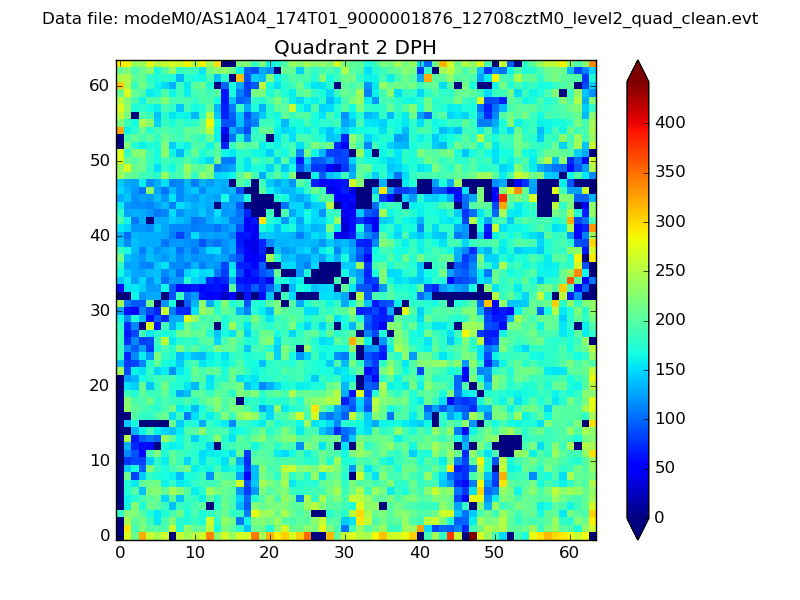 |
Quadrant C |
| Plot type | Count rate plots | Images |
|---|---|---|
| Comparison with Poisson distribution Blue bars denote a histogram of data divided into 1 sec bins. Red curve is a Poisson curve with rate = median count rate of data. |
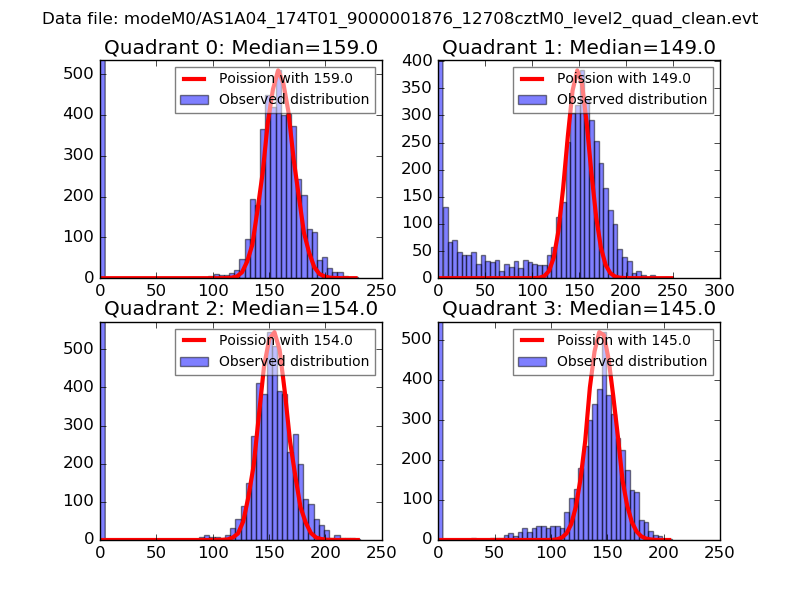 |
 |
| Quadrant-wise count rates Data is divided into 100 sec bins |
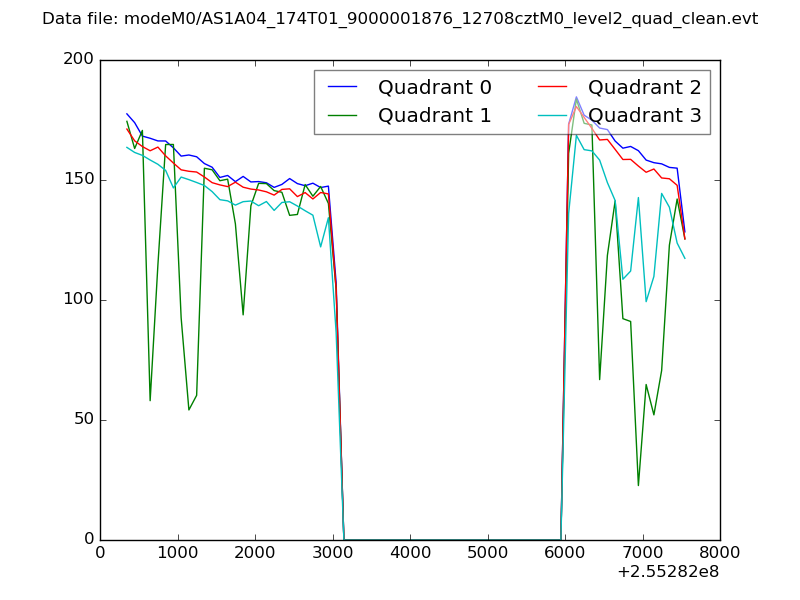 |
|
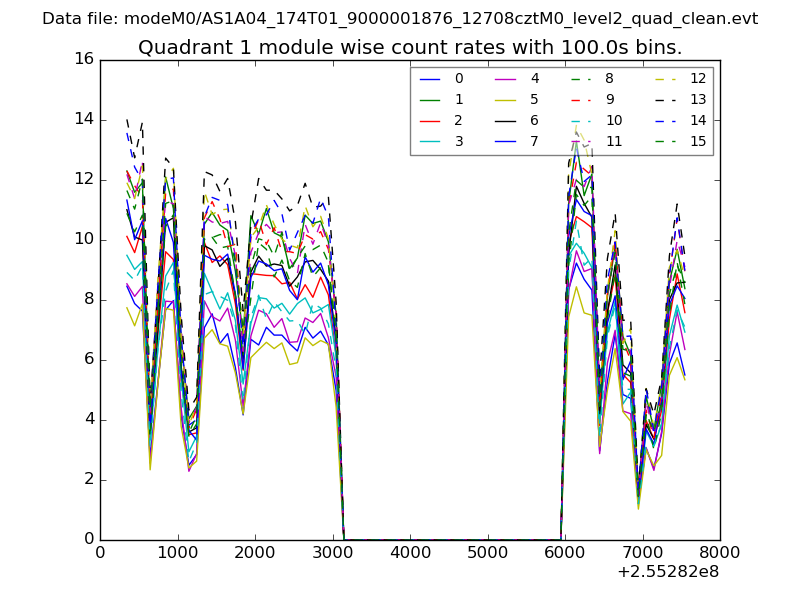
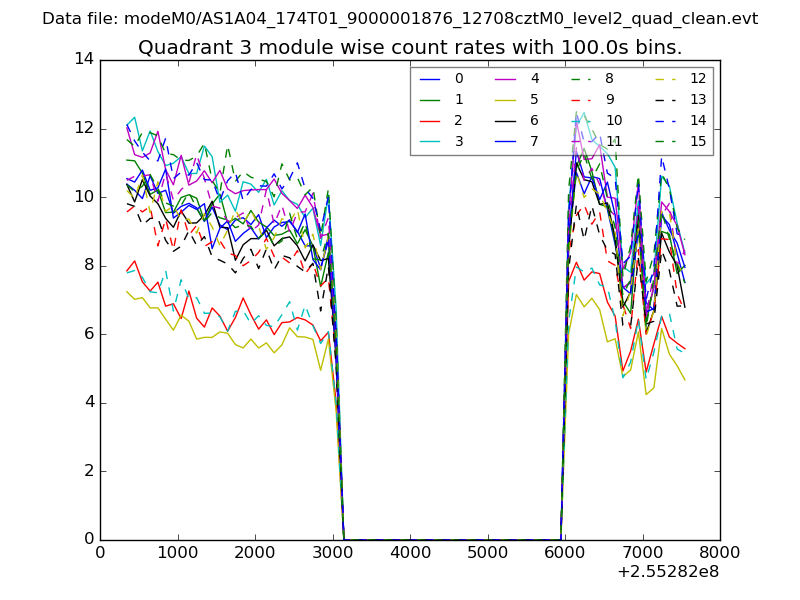
| Module-wise count rates for Quadrant A Data is divided into 100 sec bins |
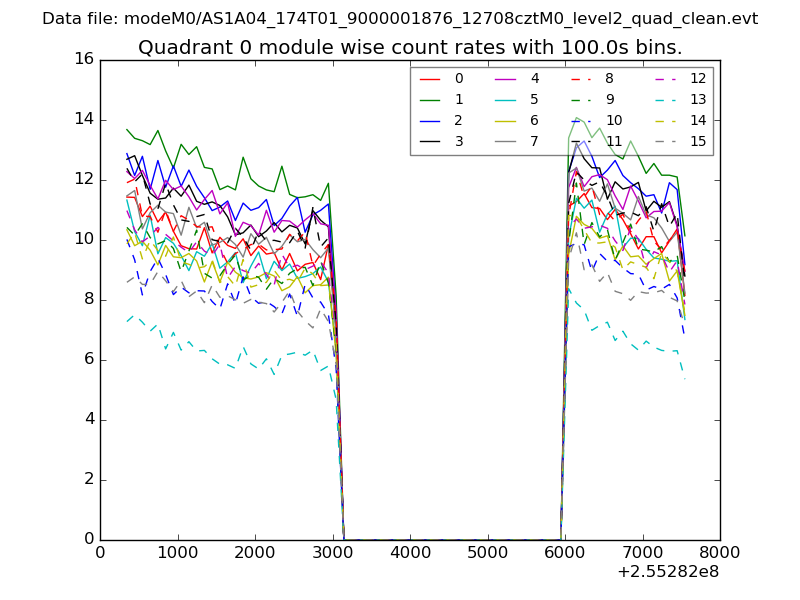 |
 |
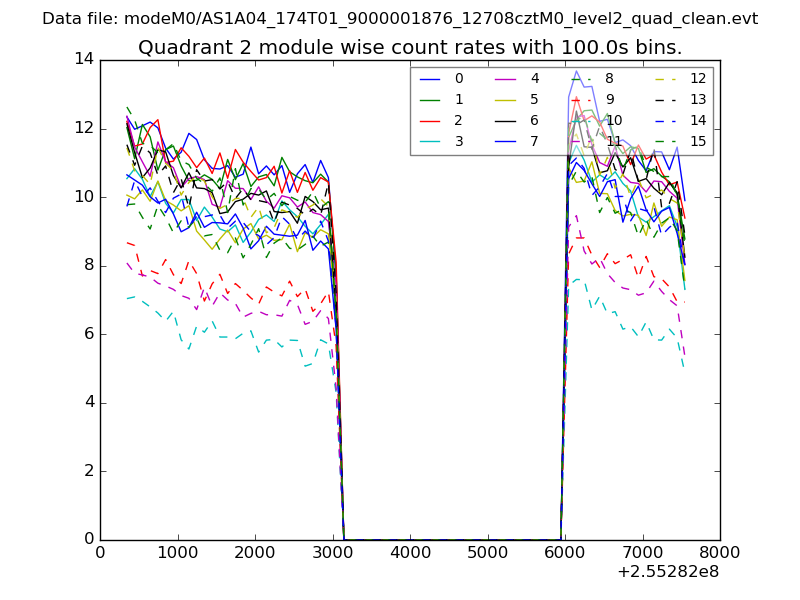
| Module-wise count rates for Quadrant B Data is divided into 100 sec bins |
 |
 |
| Module-wise count rates for Quadrant C Data is divided into 100 sec bins |
 |
 |
| Module-wise count rates for Quadrant D Data is divided into 100 sec bins |
 |
 |
| Parameter | Plot |
|---|---|
| CZT HV Monitor | 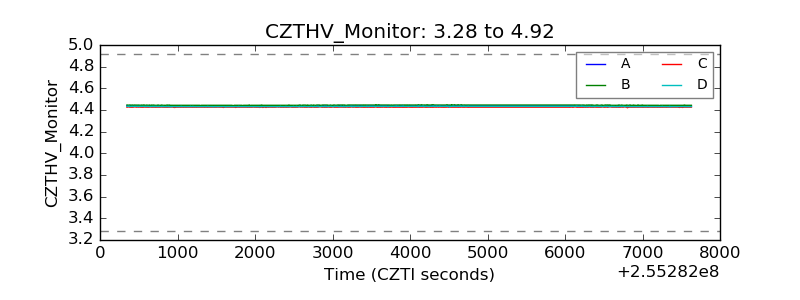 |
| D_VDD | 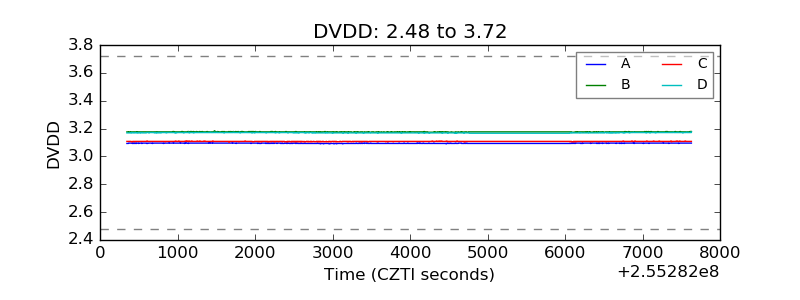 |
| Temperature 1 | 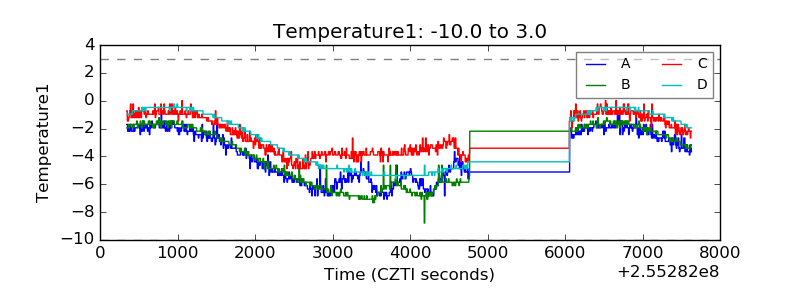 |
| Veto HV Monitor | 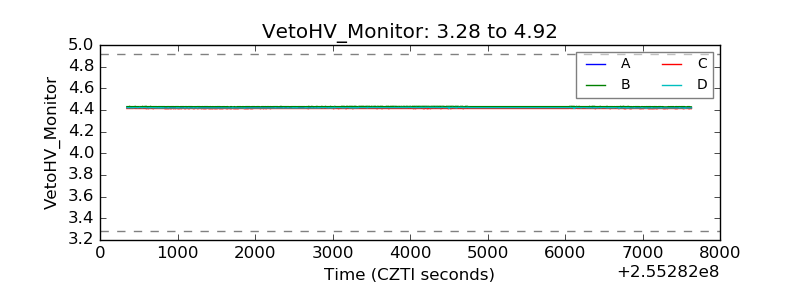 |
| Veto LLD | 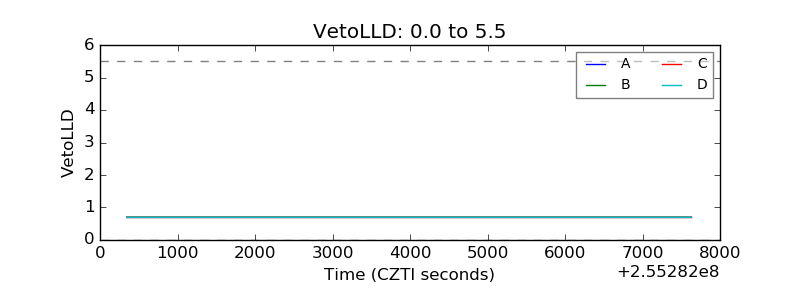 |
| Alpha Counter | 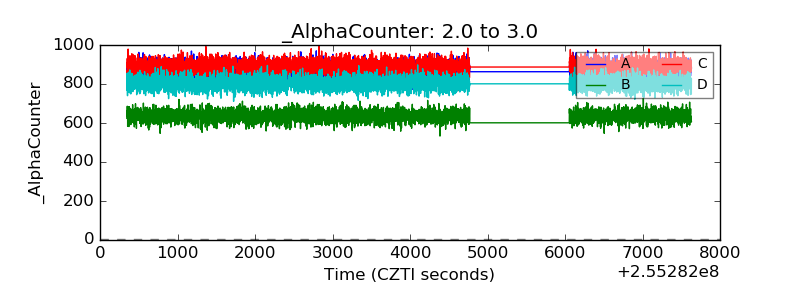 |
| _CPM_Rate | 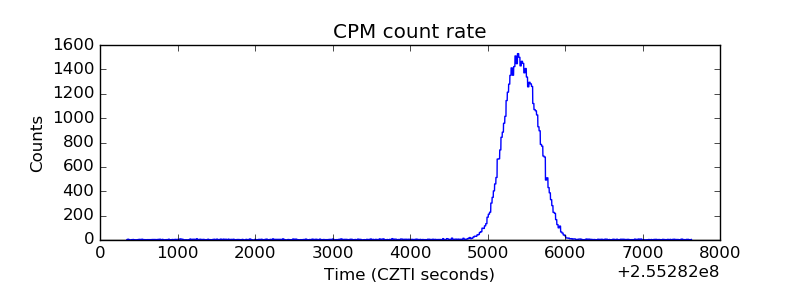 |
| CZT Counter | 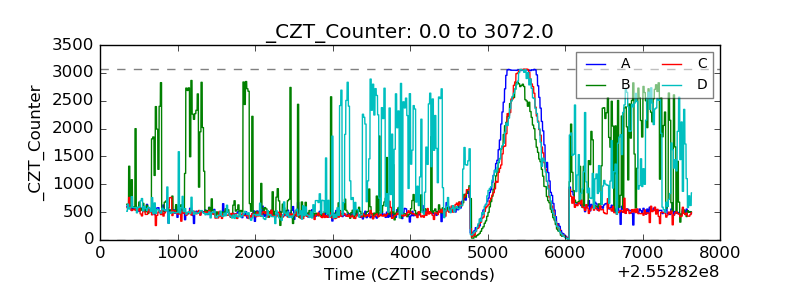 |
| +2.5 Volts monitor |  |
| +5 Volts monitor |  |
| _ROLL_ROT | 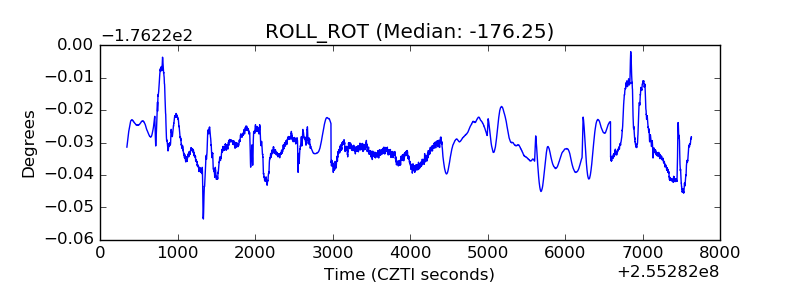 |
| _Roll_DEC | 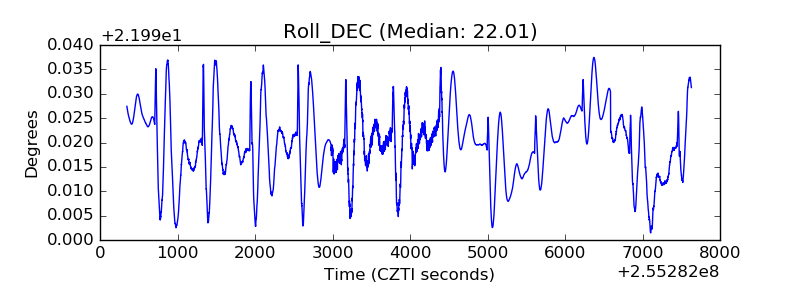 |
| _Roll_RA | 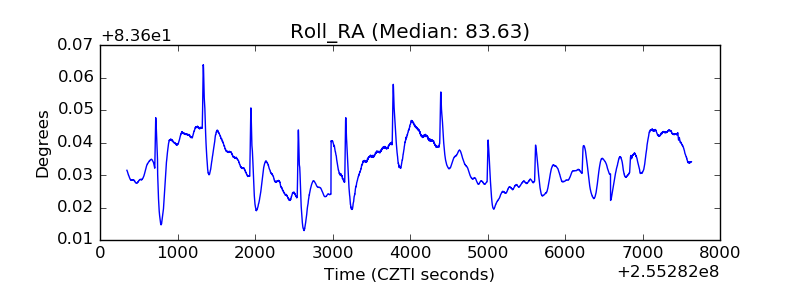 |
| Veto Counter | 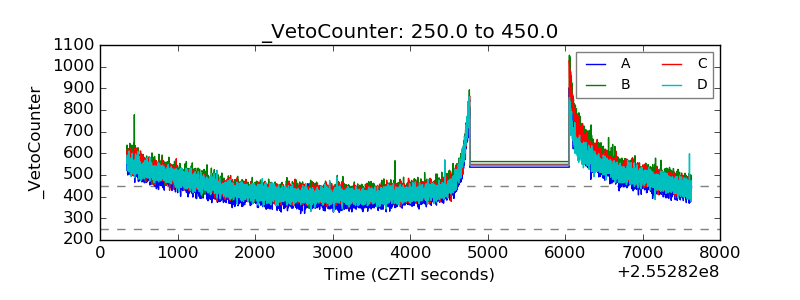 |