| Param | Original file | Final file |
|---|---|---|
| Filename | modeM0/AS1A04_174T01_9000001876_12709cztM0_level2.evt | modeM0/AS1A04_174T01_9000001876_12709cztM0_level2_quad_clean.evt |
| Size (bytes) | 633,562,560 | 81,129,600 |
| Size | 604.2 MB | 77.4 MB |
| Events in quadrant A | 2,967,555 | 568,979 |
| Events in quadrant B | 5,447,691 | 462,556 |
| Events in quadrant C | 2,824,375 | 555,061 |
| Events in quadrant D | 7,555,767 | 464,121 |
| Mode M9 | |||
|---|---|---|---|
| Quadrant | BADHDUFLAG | Total packets | Discarded packets |
| A | 0 | 13 | 0 |
| B | 0 | 13 | 0 |
| C | 0 | 13 | 0 |
| D | 0 | 13 | 0 |
| Mode M0 | |||
|---|---|---|---|
| Quadrant | BADHDUFLAG | Total packets | Discarded packets |
| A | 0 | 12337 | 2 |
| B | 0 | 19935 | 1 |
| C | 0 | 12104 | 1 |
| D | 0 | 26418 | 1 |
| Mode SS | |||
|---|---|---|---|
| Quadrant | BADHDUFLAG | Total packets | Discarded packets |
| A | 0 | 116 | 0 |
| B | 0 | 116 | 0 |
| C | 0 | 116 | 0 |
| D | 0 | 116 | 0 |
| Quadrant | Total seconds | Saturated seconds | Saturation percentage |
|---|---|---|---|
| A | 5802 | 96 | 1.654602% |
| B | 5802 | 1106 | 19.062392% |
| C | 5802 | 56 | 0.965184% |
| D | 5802 | 1328 | 22.888659% |
Noise dominated data is calculated using 1-second bins in cleaned event files. If a bin has >2000 counts, and if more than 50% of those come from <1% of pixels, then it is considered to be noise-dominated and hence unusable.
| Quadrant | # 1 sec bins | Bins with >0 counts | Bins with >2000 counts | High rate bins dominated by noise | Noise dominated (total time) | Noise dominated (detector-on time) | Marked lightcurve |
|---|---|---|---|---|---|---|---|
| A | 7048 | 5804 | 12 | 12 | 0.17% | 0.21% | 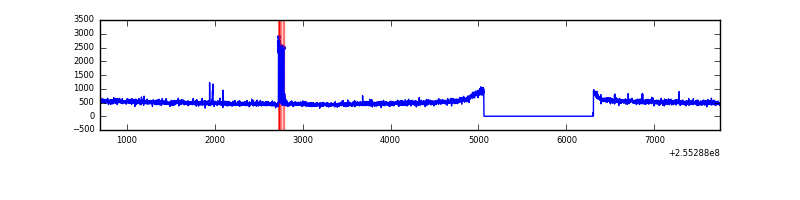 |
| B | 7048 | 5804 | 915 | 915 | 12.98% | 15.76% | 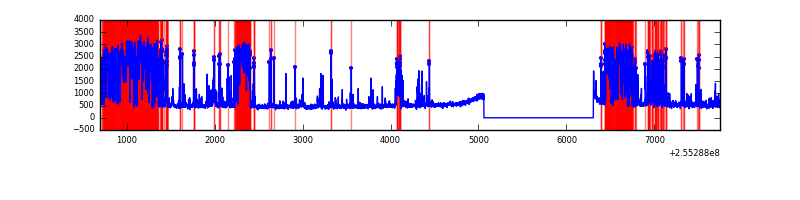 |
| C | 7048 | 5804 | 2 | 2 | 0.03% | 0.03% | 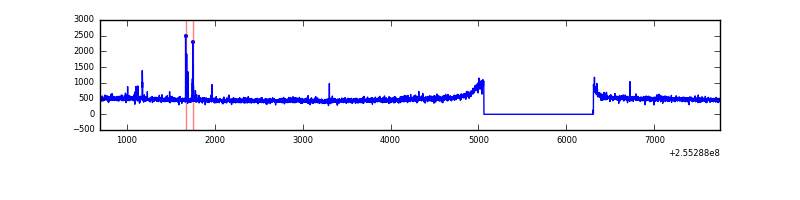 |
| D | 7048 | 5804 | 1441 | 1441 | 20.45% | 24.83% | 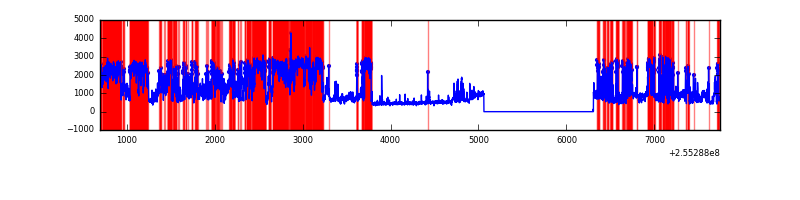 |
Top three noisy pixels from each quadrant. If the there are fewer than three noisy pixels in the level2.evt file, extra rows are filled as -1
| Pixel properties | Quadrant properties | ||||||
|---|---|---|---|---|---|---|---|
| Quadrant | DetID | PixID | Counts | Sigma | Mean | Median | Sigma |
| A | 15 | 174 | 59223 | 391.52 | 738 | 723 | 149.4 |
| A | 15 | 239 | 32937 | 215.6 | 738 | 723 | 149.4 |
| A | 12 | 189 | 20881 | 134.91 | 738 | 723 | 149.4 |
| B | 4 | 239 | 2760677 | 22181.22 | 658 | 644 | 124.4 |
| B | 3 | 209 | 37721 | 297.97 | 658 | 644 | 124.4 |
| B | 4 | 81 | 20559 | 160.05 | 658 | 644 | 124.4 |
| C | 15 | 208 | 42089 | 249.47 | 713 | 720 | 165.8 |
| C | 13 | 61 | 5172 | 26.84 | 713 | 720 | 165.8 |
| C | 8 | 222 | 2799 | 12.53 | 713 | 720 | 165.8 |
| D | 1 | 52 | 4707346 | 26900.66 | 654 | 644 | 175.0 |
| D | 10 | 157 | 260602 | 1485.76 | 654 | 644 | 175.0 |
| D | 13 | 104 | 48969 | 276.2 | 654 | 644 | 175.0 |
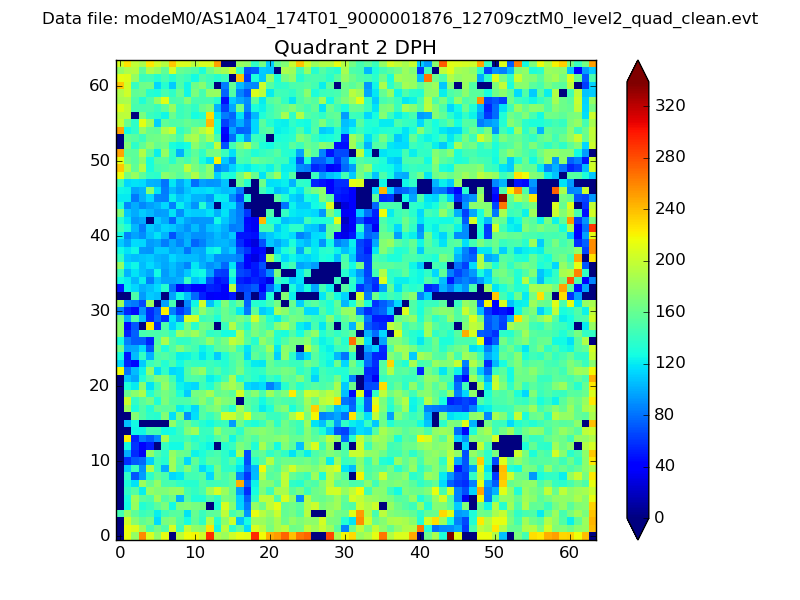
Histogram calculated using DETX and DETY for each event in the final _common_clean file
| Quadrant A | 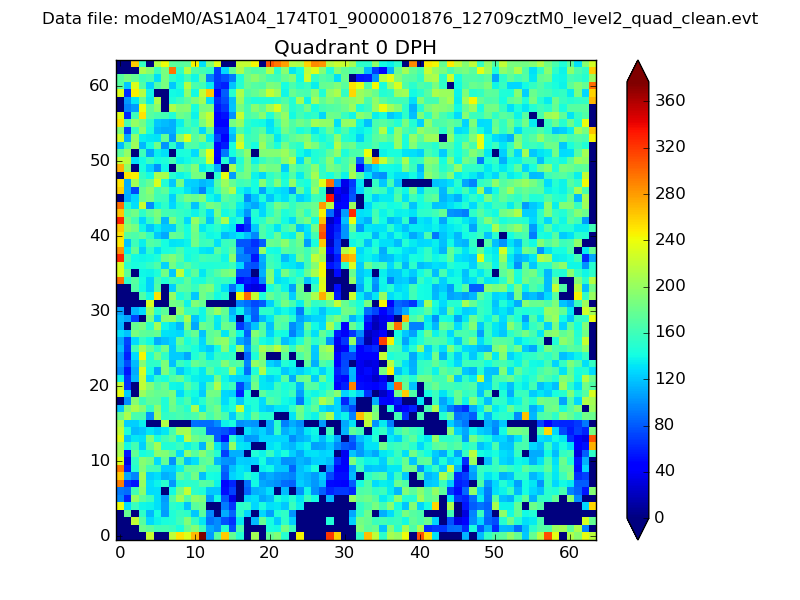 |
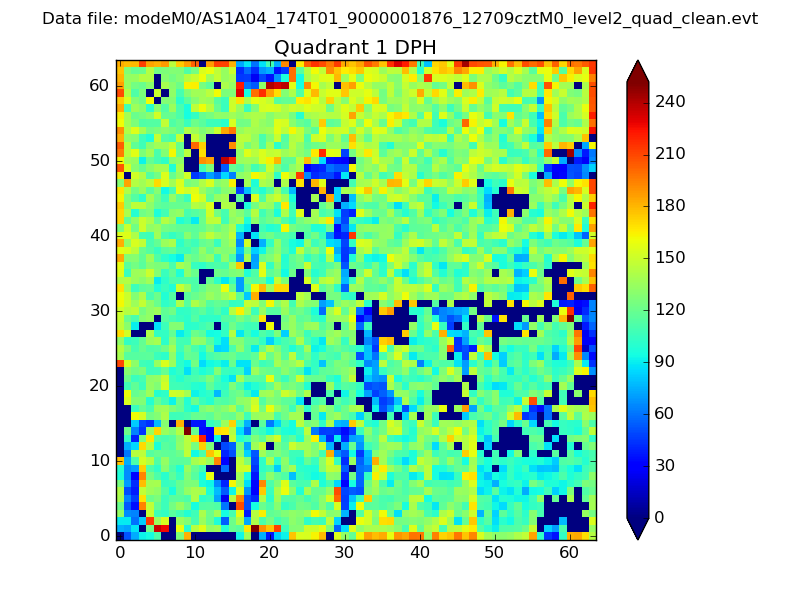 |
Quadrant B |
|---|---|---|---|
| Quadrant D | 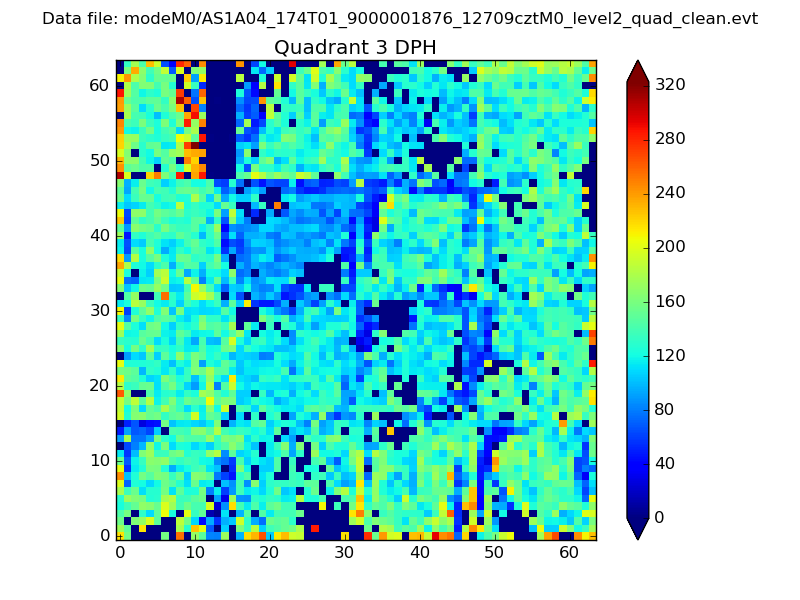 |
 |
Quadrant C |
| Plot type | Count rate plots | Images |
|---|---|---|
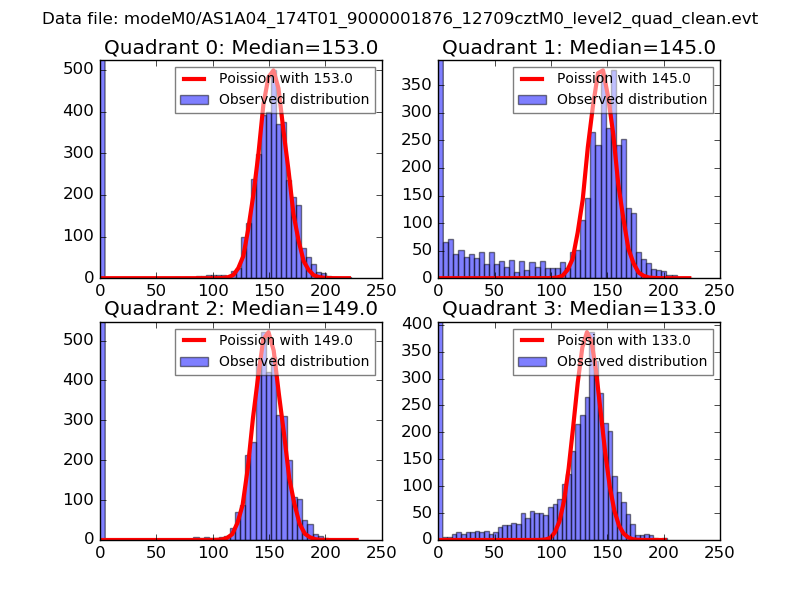
| Comparison with Poisson distribution Blue bars denote a histogram of data divided into 1 sec bins. Red curve is a Poisson curve with rate = median count rate of data. |
 |
 |
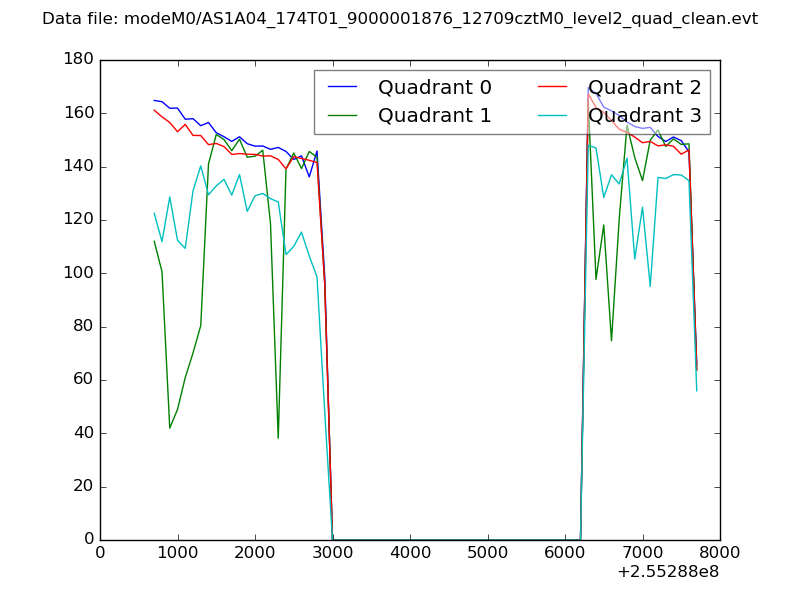
| Quadrant-wise count rates Data is divided into 100 sec bins |
 |
|
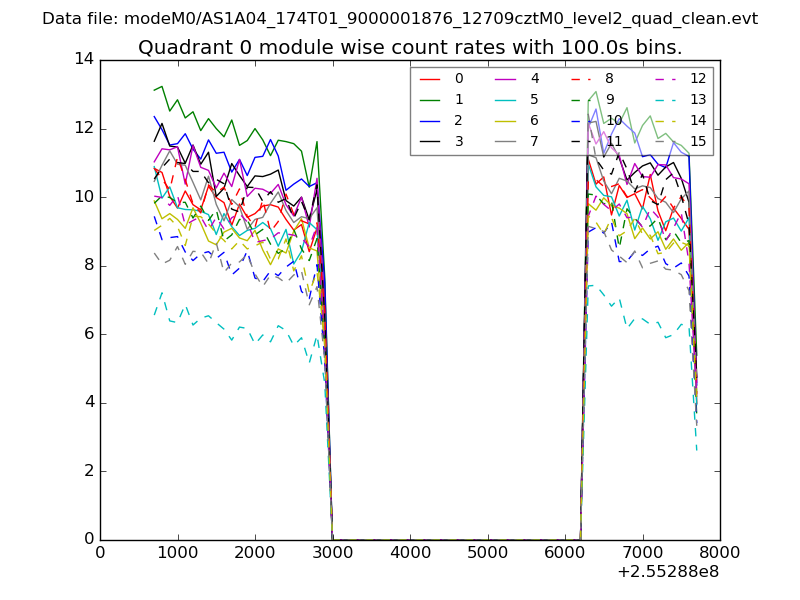
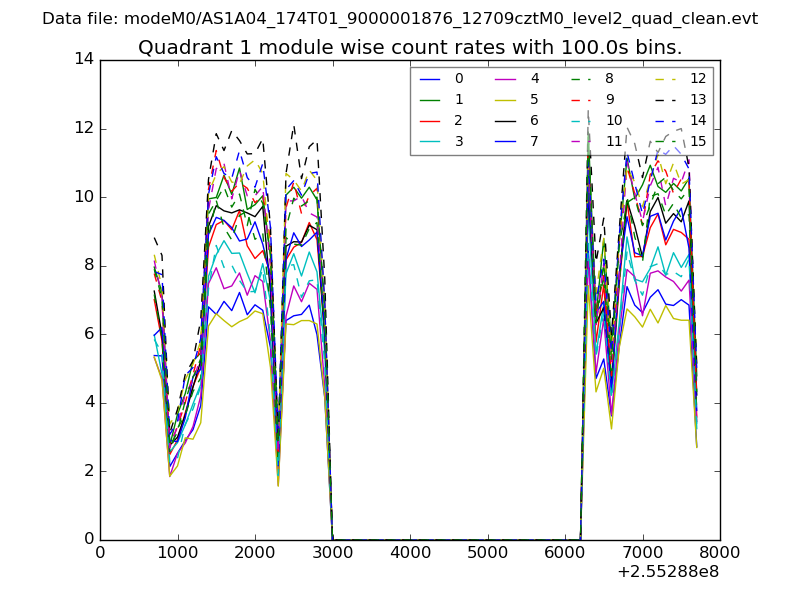
| Module-wise count rates for Quadrant A Data is divided into 100 sec bins |
 |
 |
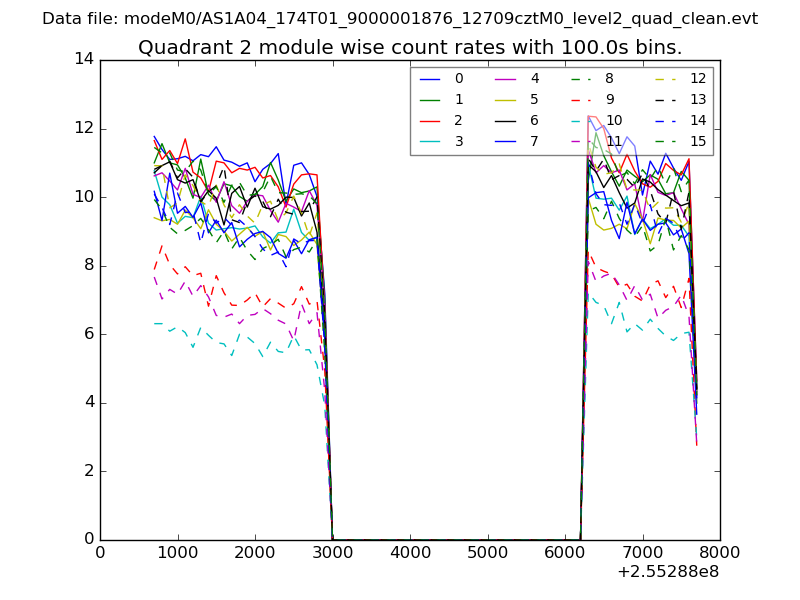
| Module-wise count rates for Quadrant B Data is divided into 100 sec bins |
 |
 |
| Module-wise count rates for Quadrant C Data is divided into 100 sec bins |
 |
 |
| Module-wise count rates for Quadrant D Data is divided into 100 sec bins |
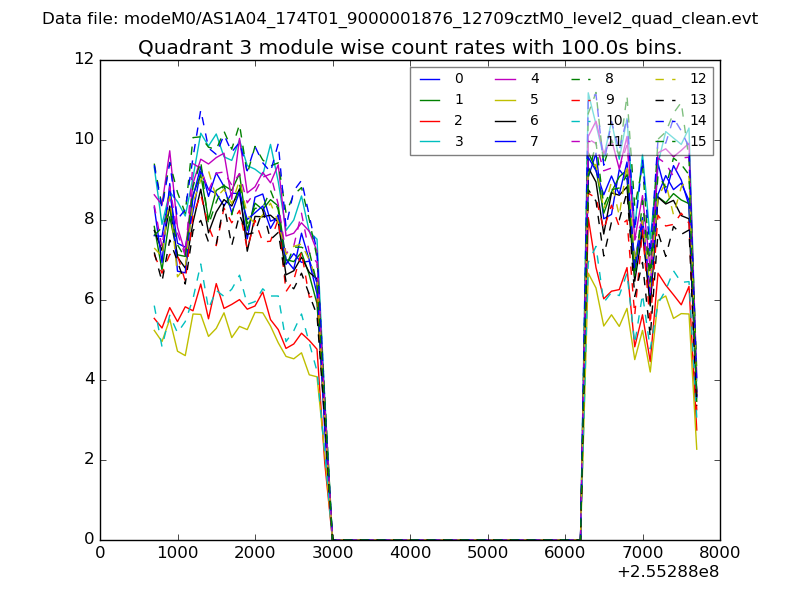 |
 |
| Parameter | Plot |
|---|---|
| CZT HV Monitor | 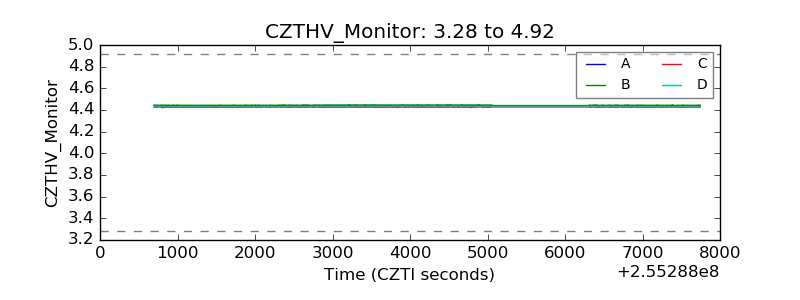 |
| D_VDD | 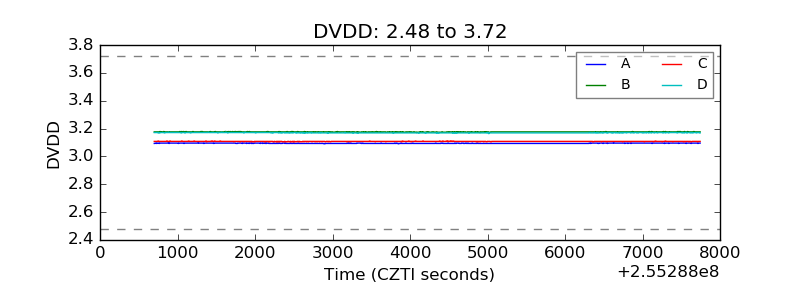 |
| Temperature 1 | 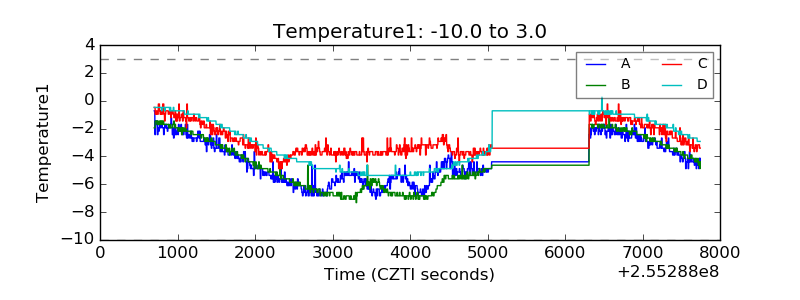 |
| Veto HV Monitor | 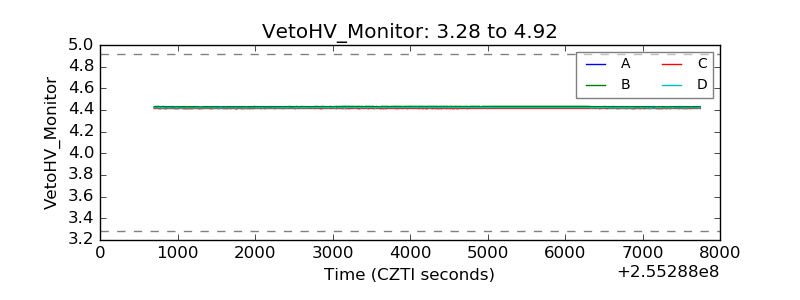 |
| Veto LLD | 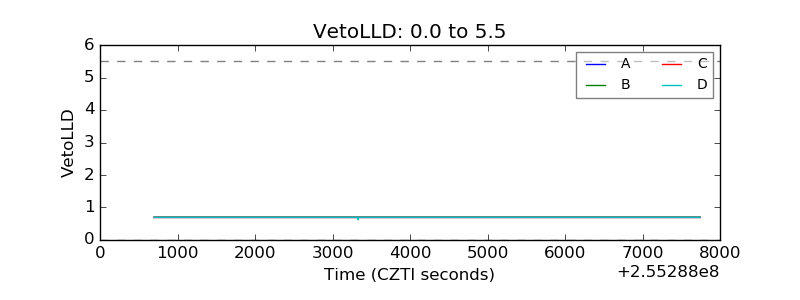 |
| Alpha Counter | 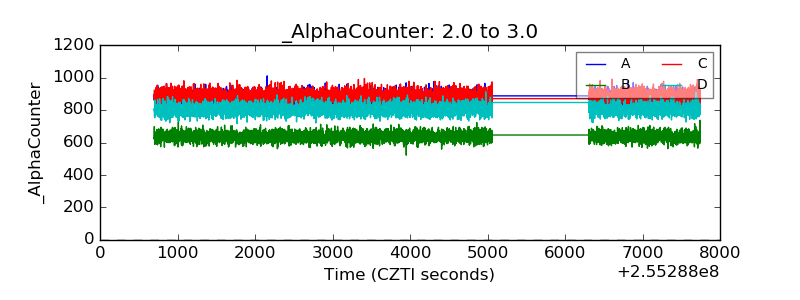 |
| _CPM_Rate | 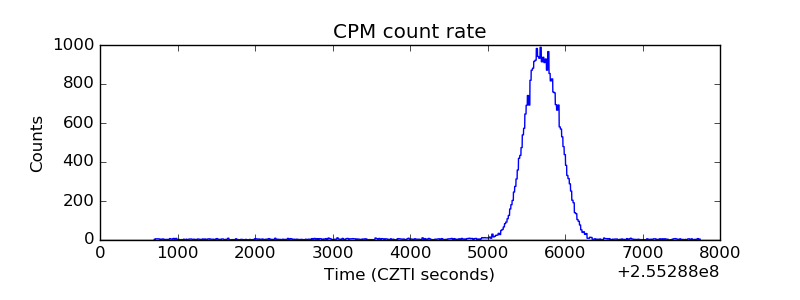 |
| CZT Counter | 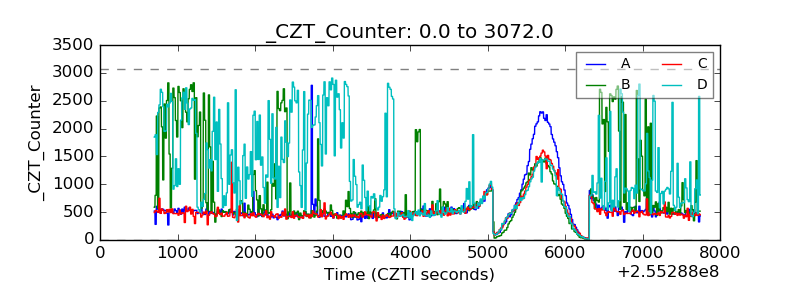 |
| +2.5 Volts monitor |  |
| +5 Volts monitor | 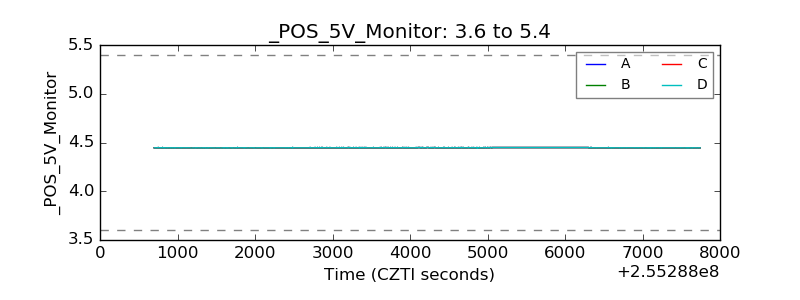 |
| _ROLL_ROT | 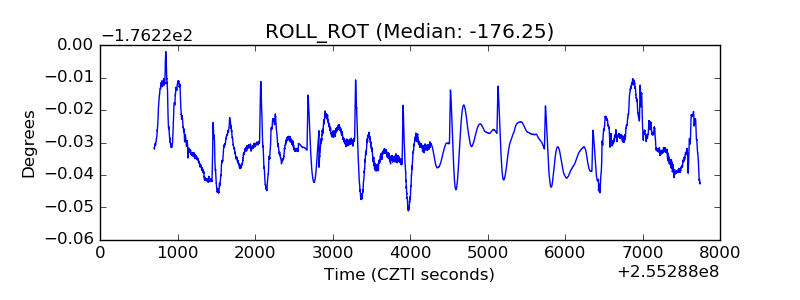 |
| _Roll_DEC | 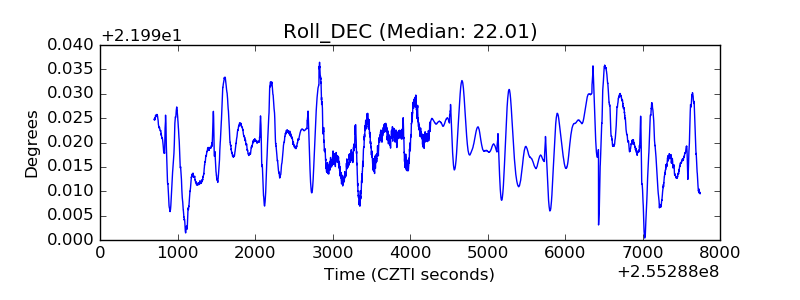 |
| _Roll_RA | 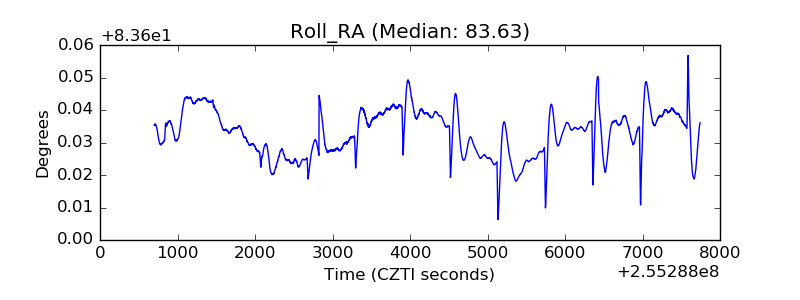 |
| Veto Counter | 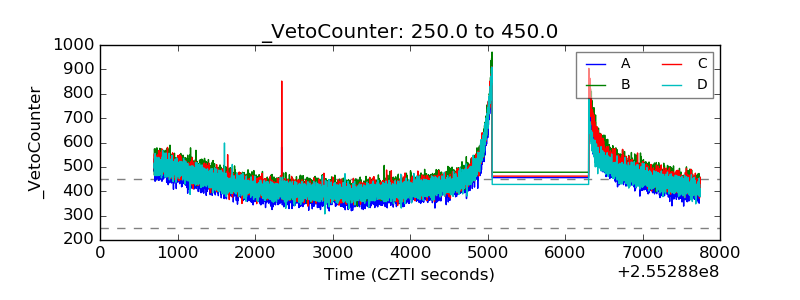 |