| Param | Original file | Final file |
|---|---|---|
| Filename | modeM0/AS1A04_174T01_9000001876_12711cztM0_level2.evt | modeM0/AS1A04_174T01_9000001876_12711cztM0_level2_quad_clean.evt |
| Size (bytes) | 589,783,680 | 99,115,200 |
| Size | 562.5 MB | 94.5 MB |
| Events in quadrant A | 3,323,506 | 658,213 |
| Events in quadrant B | 4,747,934 | 615,086 |
| Events in quadrant C | 3,987,552 | 645,169 |
| Events in quadrant D | 5,340,282 | 607,497 |
| Mode M9 | |||
|---|---|---|---|
| Quadrant | BADHDUFLAG | Total packets | Discarded packets |
| A | 0 | 8 | 0 |
| B | 0 | 8 | 0 |
| C | 0 | 8 | 0 |
| D | 0 | 9 | 0 |
| Mode M0 | |||
|---|---|---|---|
| Quadrant | BADHDUFLAG | Total packets | Discarded packets |
| A | 0 | 14333 | 3 |
| B | 0 | 18597 | 2 |
| C | 0 | 16362 | 2 |
| D | 0 | 20424 | 2 |
| Mode SS | |||
|---|---|---|---|
| Quadrant | BADHDUFLAG | Total packets | Discarded packets |
| A | 0 | 140 | 0 |
| B | 0 | 140 | 0 |
| C | 0 | 140 | 0 |
| D | 0 | 140 | 0 |
| Quadrant | Total seconds | Saturated seconds | Saturation percentage |
|---|---|---|---|
| A | 6817 | 43 | 0.630776% |
| B | 6817 | 593 | 8.698841% |
| C | 6817 | 152 | 2.229720% |
| D | 6817 | 557 | 8.170750% |
Noise dominated data is calculated using 1-second bins in cleaned event files. If a bin has >2000 counts, and if more than 50% of those come from <1% of pixels, then it is considered to be noise-dominated and hence unusable.
| Quadrant | # 1 sec bins | Bins with >0 counts | Bins with >2000 counts | High rate bins dominated by noise | Noise dominated (total time) | Noise dominated (detector-on time) | Marked lightcurve |
|---|---|---|---|---|---|---|---|
| A | 7543 | 6820 | 2 | 2 | 0.03% | 0.03% | 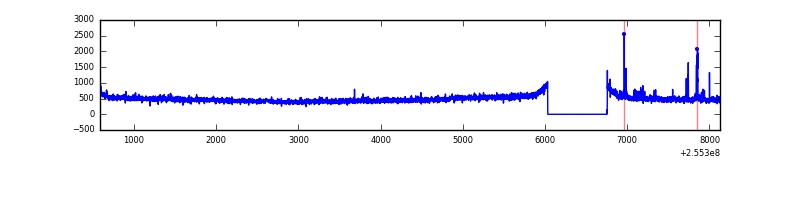 |
| B | 7543 | 6820 | 400 | 400 | 5.30% | 5.87% | 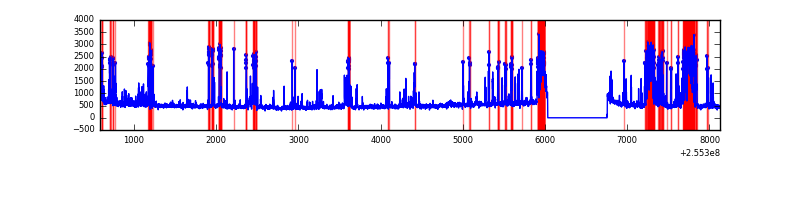 |
| C | 7543 | 6820 | 148 | 148 | 1.96% | 2.17% | 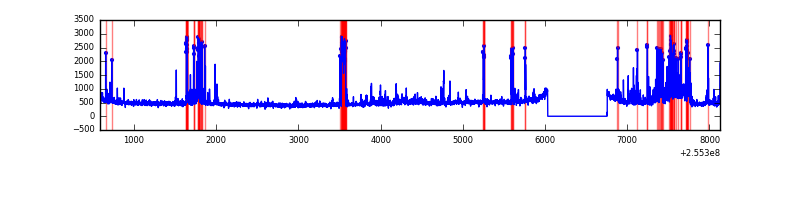 |
| D | 7543 | 6820 | 553 | 553 | 7.33% | 8.11% | 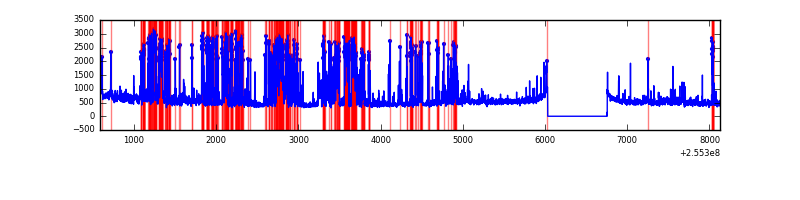 |
Top three noisy pixels from each quadrant. If the there are fewer than three noisy pixels in the level2.evt file, extra rows are filled as -1
| Pixel properties | Quadrant properties | ||||||
|---|---|---|---|---|---|---|---|
| Quadrant | DetID | PixID | Counts | Sigma | Mean | Median | Sigma |
| A | 15 | 239 | 37107 | 213.39 | 834 | 818 | 170.1 |
| A | 11 | 29 | 29586 | 169.16 | 834 | 818 | 170.1 |
| A | 7 | 16 | 22999 | 130.43 | 834 | 818 | 170.1 |
| B | 4 | 239 | 1487240 | 9891.25 | 796 | 777 | 150.3 |
| B | 4 | 81 | 43256 | 282.66 | 796 | 777 | 150.3 |
| B | 0 | 214 | 30011 | 194.53 | 796 | 777 | 150.3 |
| C | 15 | 208 | 845650 | 4532.04 | 803 | 811 | 186.4 |
| C | 14 | 234 | 8635 | 41.97 | 803 | 811 | 186.4 |
| C | 13 | 61 | 5934 | 27.48 | 803 | 811 | 186.4 |
| D | 1 | 52 | 2187375 | 11710.48 | 777 | 760 | 186.7 |
| D | 10 | 157 | 152782 | 814.16 | 777 | 760 | 186.7 |
| D | 13 | 104 | 31294 | 163.53 | 777 | 760 | 186.7 |
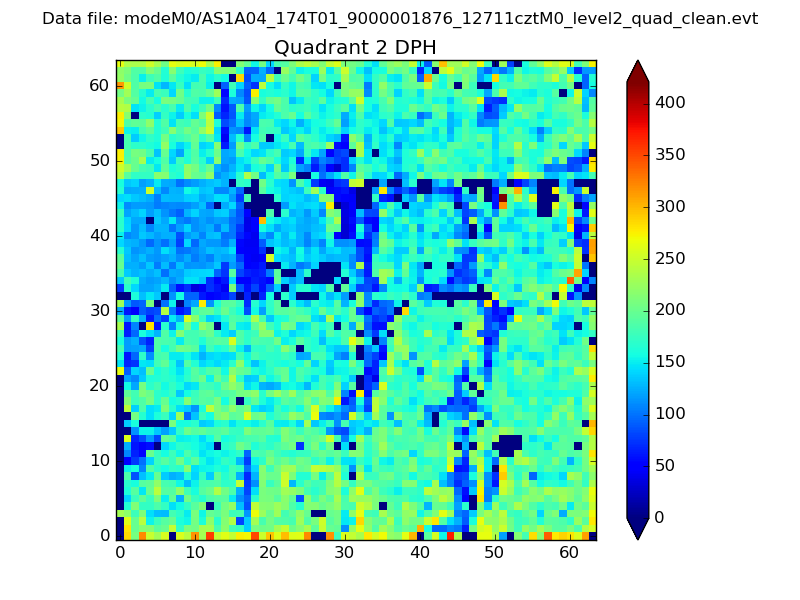
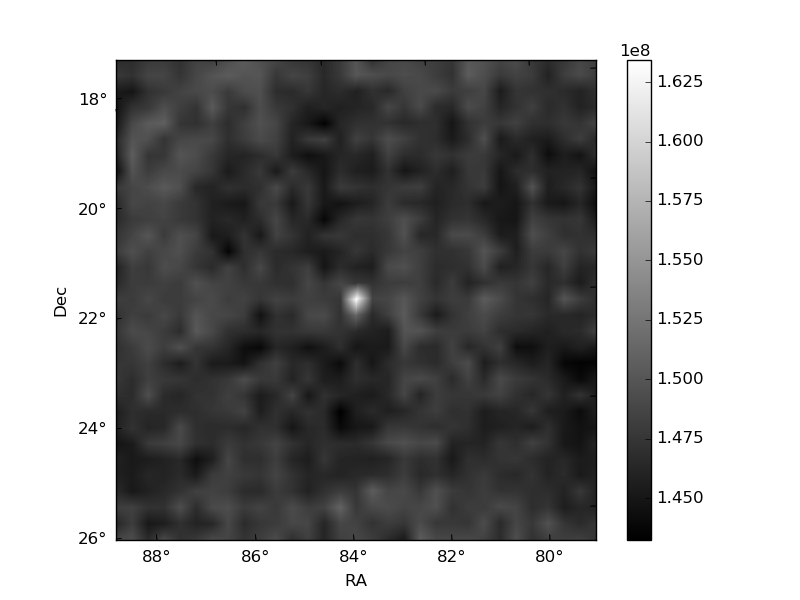
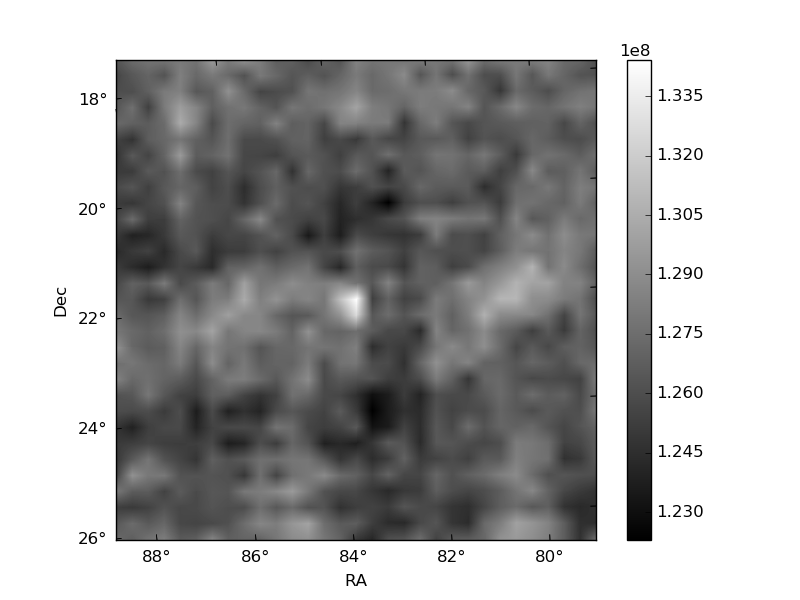
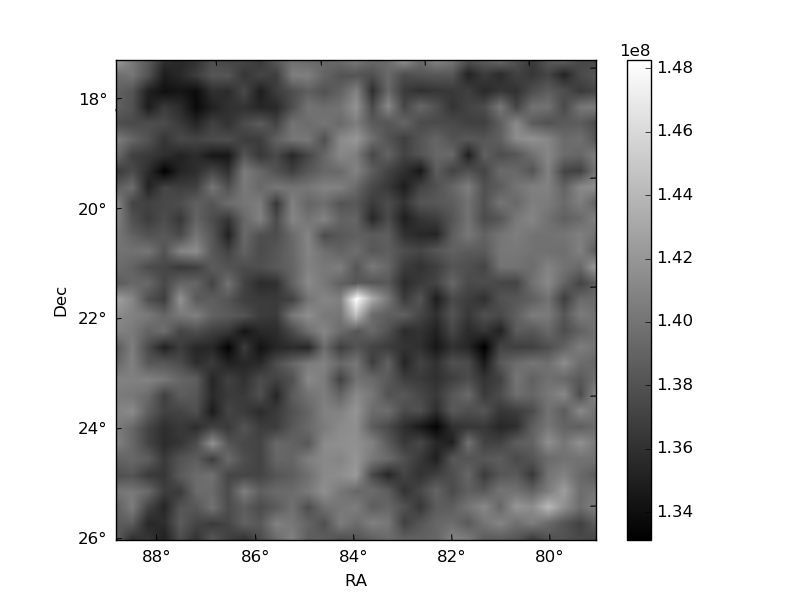
Histogram calculated using DETX and DETY for each event in the final _common_clean file
| Quadrant A | 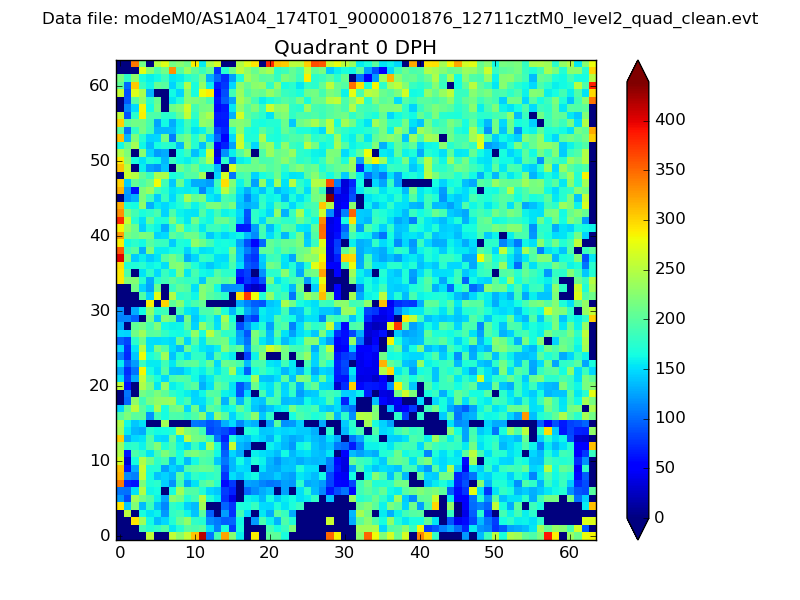 |
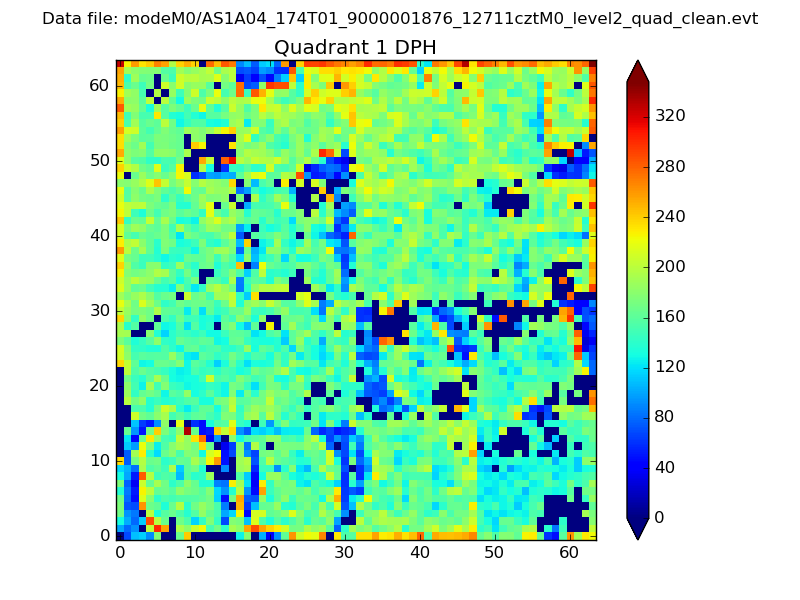 |
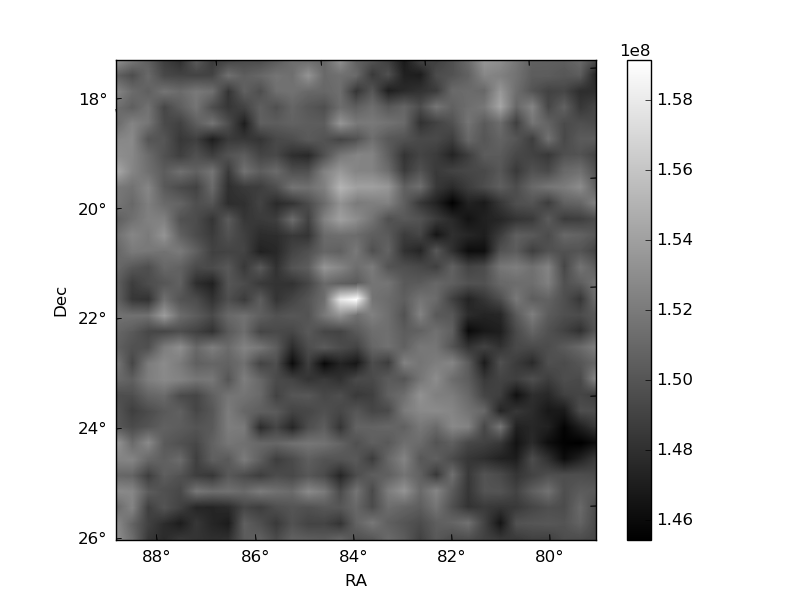
Quadrant B |
|---|---|---|---|
| Quadrant D | 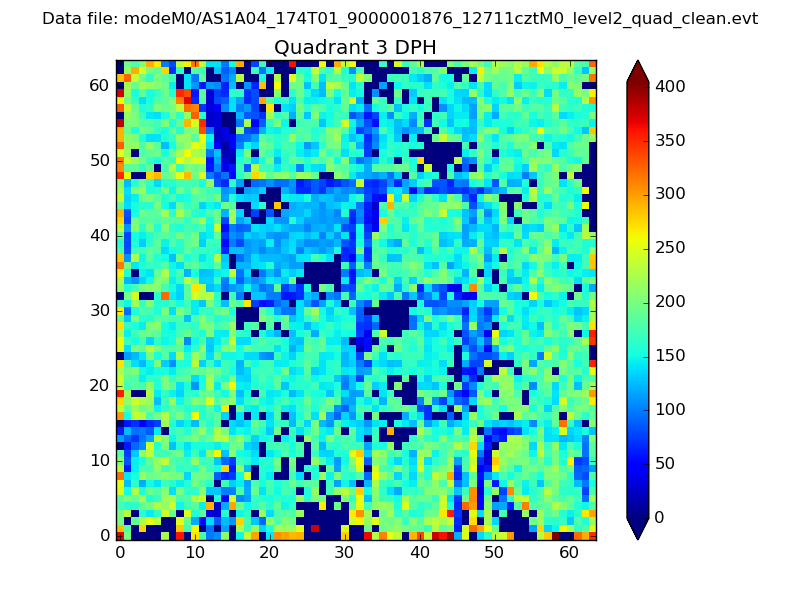 |
 |
Quadrant C |
| Plot type | Count rate plots | Images |
|---|---|---|
| Comparison with Poisson distribution Blue bars denote a histogram of data divided into 1 sec bins. Red curve is a Poisson curve with rate = median count rate of data. |
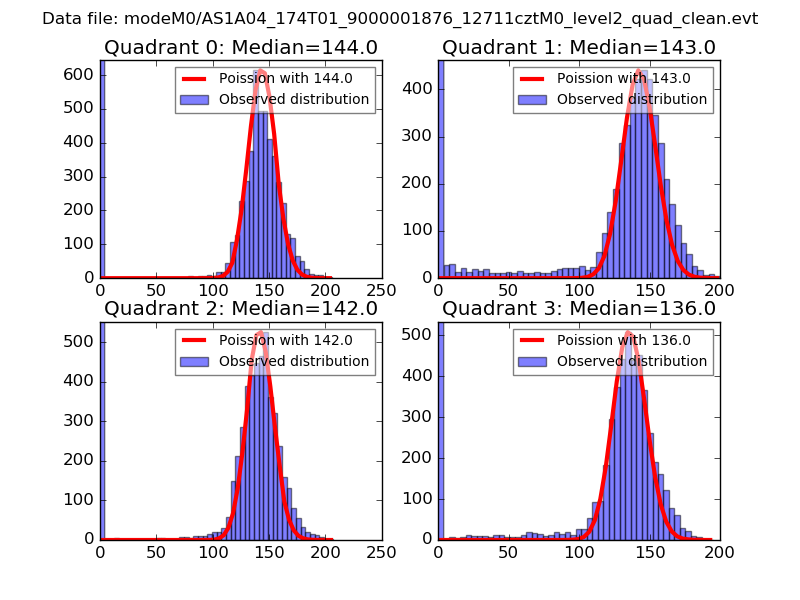 |
 |
| Quadrant-wise count rates Data is divided into 100 sec bins |
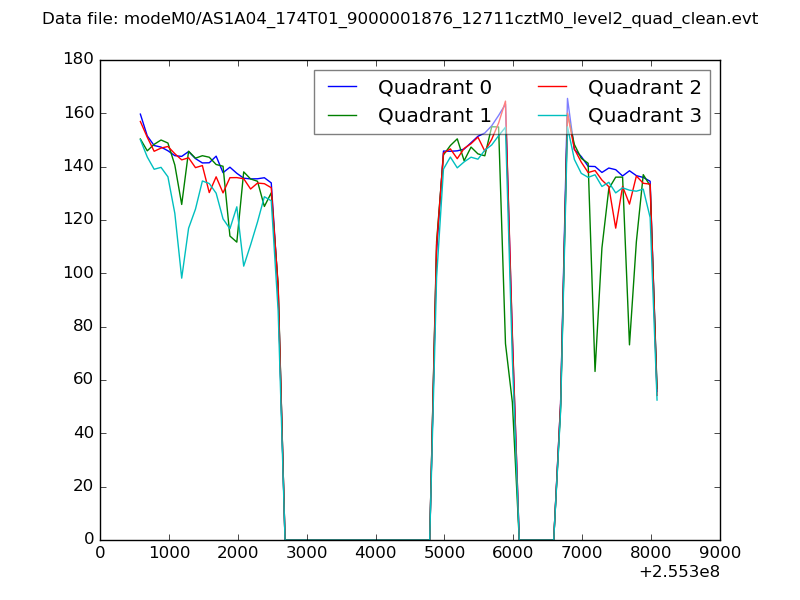 |
|
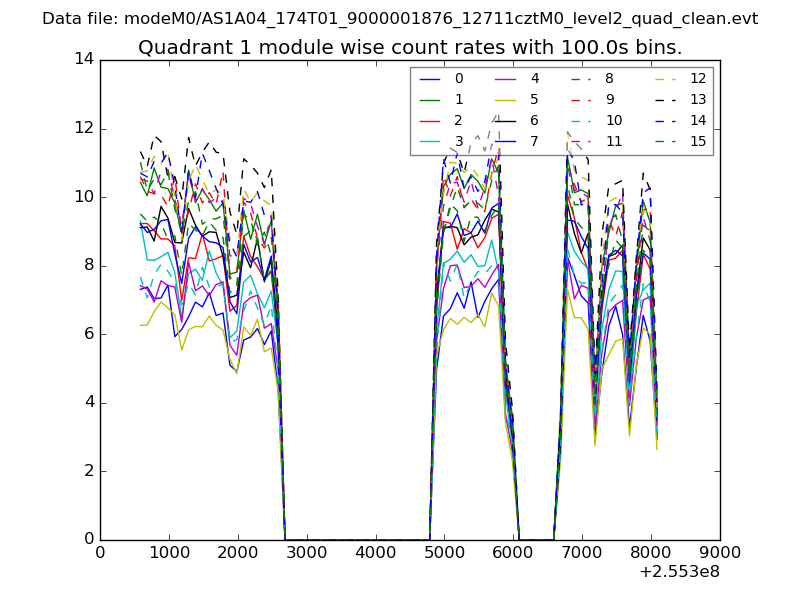
| Module-wise count rates for Quadrant A Data is divided into 100 sec bins |
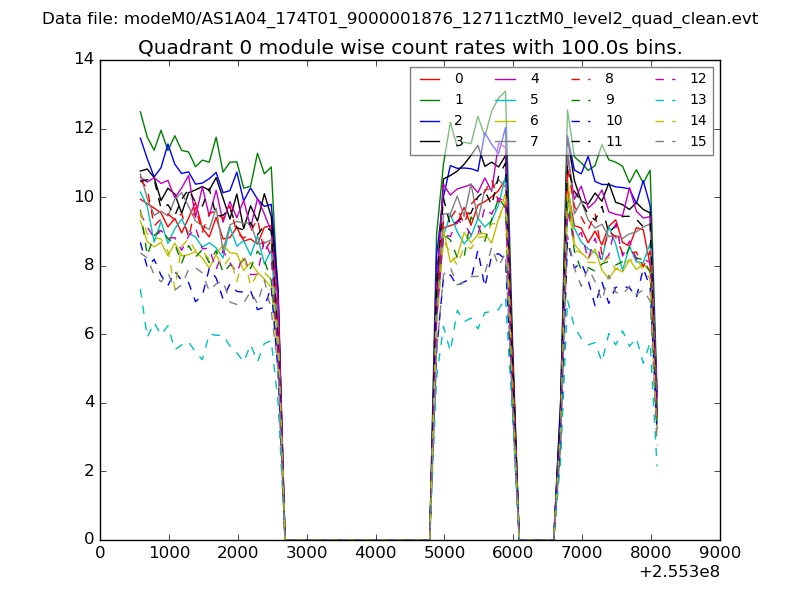 |
 |
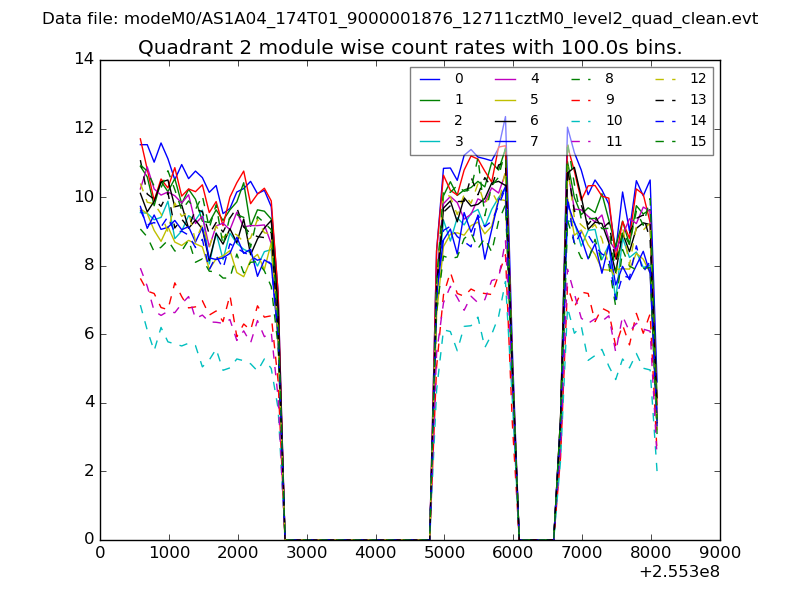
| Module-wise count rates for Quadrant B Data is divided into 100 sec bins |
 |
 |
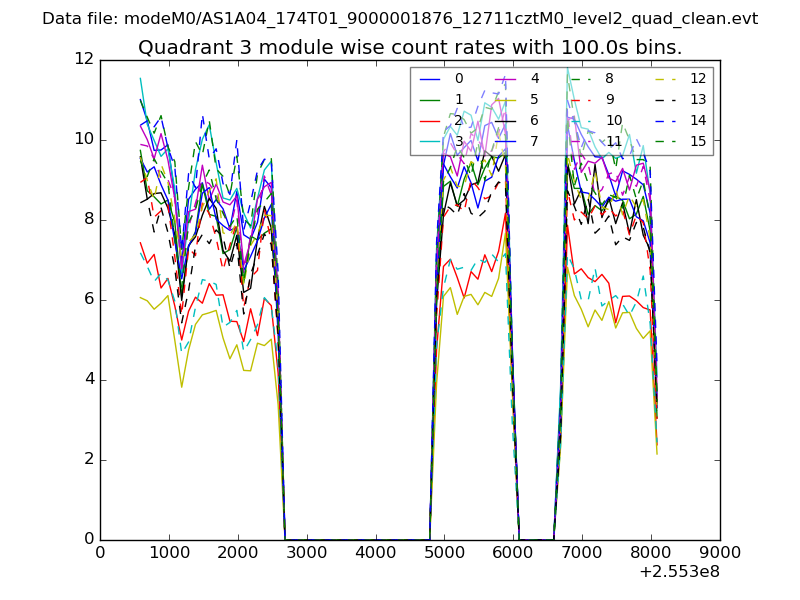
| Module-wise count rates for Quadrant C Data is divided into 100 sec bins |
 |
 |
| Module-wise count rates for Quadrant D Data is divided into 100 sec bins |
 |
 |
| Parameter | Plot |
|---|---|
| CZT HV Monitor | 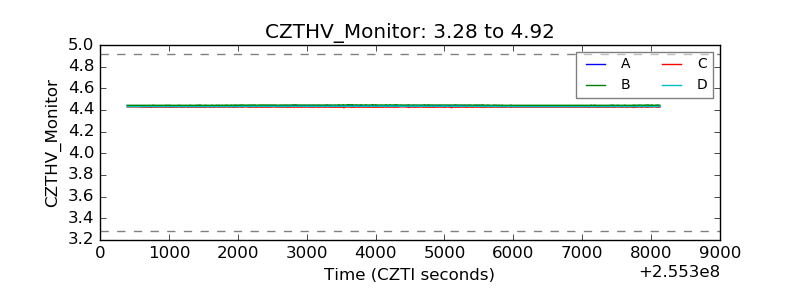 |
| D_VDD | 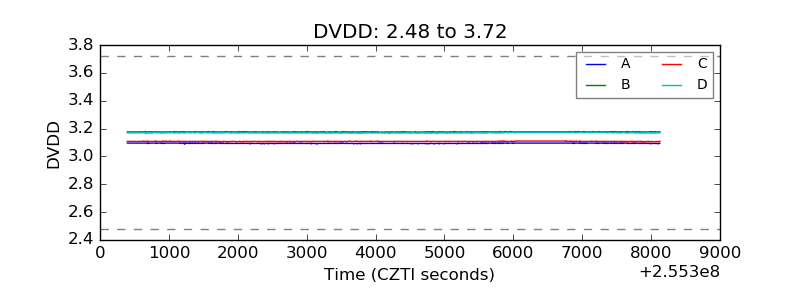 |
| Temperature 1 |  |
| Veto HV Monitor | 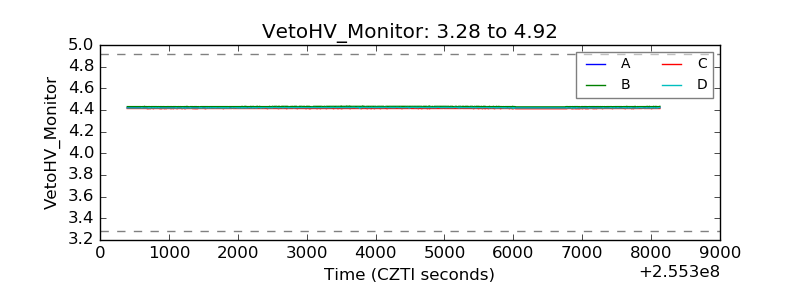 |
| Veto LLD | 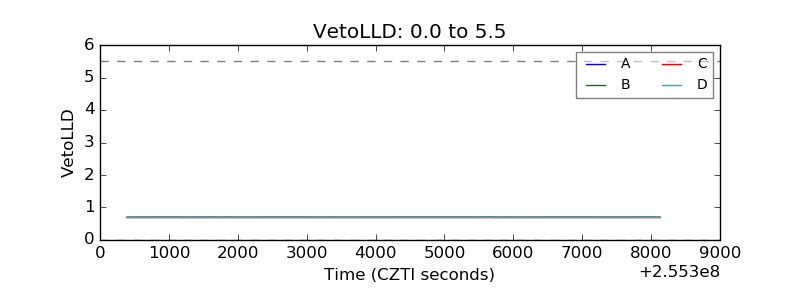 |
| Alpha Counter | 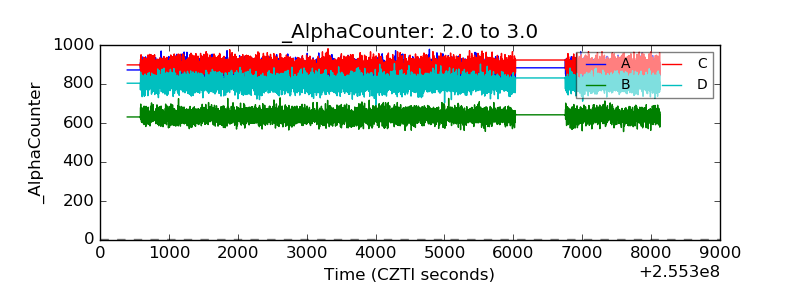 |
| _CPM_Rate | 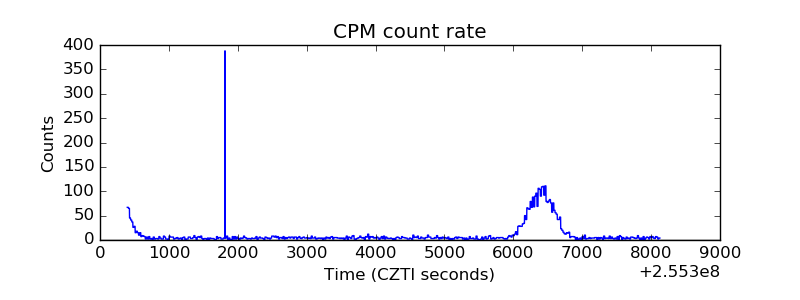 |
| CZT Counter | 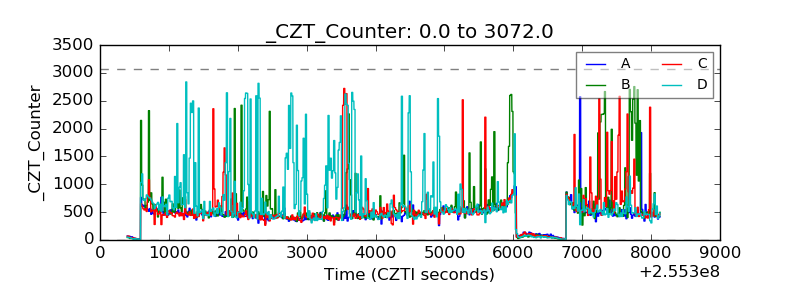 |
| +2.5 Volts monitor |  |
| +5 Volts monitor |  |
| _ROLL_ROT |  |
| _Roll_DEC | 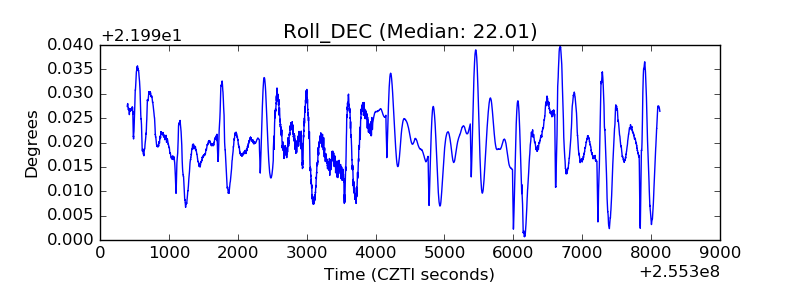 |
| _Roll_RA | 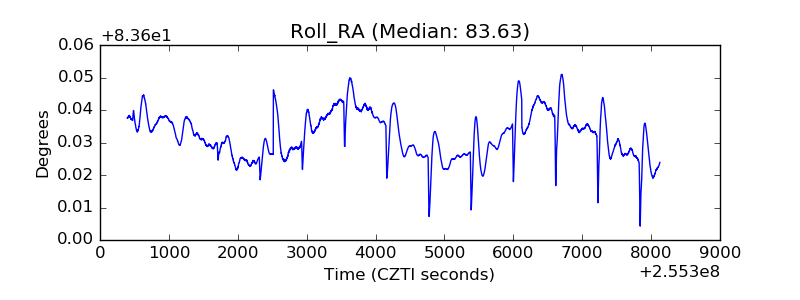 |
| Veto Counter | 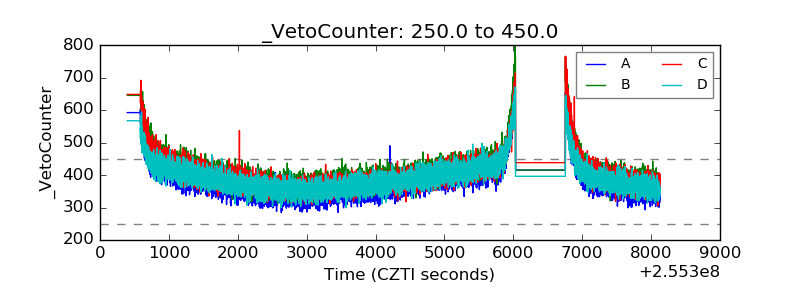 |