| Param | Original file | Final file |
|---|---|---|
| Filename | modeM0/AS1A04_174T01_9000001876_12714cztM0_level2.evt | modeM0/AS1A04_174T01_9000001876_12714cztM0_level2_quad_clean.evt |
| Size (bytes) | 497,030,400 | 79,776,000 |
| Size | 474.0 MB | 76.1 MB |
| Events in quadrant A | 3,305,233 | 496,493 |
| Events in quadrant B | 4,447,644 | 470,419 |
| Events in quadrant C | 3,135,133 | 497,657 |
| Events in quadrant D | 3,699,188 | 473,459 |
| Mode M9 | |||
|---|---|---|---|
| Quadrant | BADHDUFLAG | Total packets | Discarded packets |
| A | 0 | 5 | 0 |
| B | 0 | 5 | 0 |
| C | 0 | 5 | 0 |
| D | 0 | 5 | 0 |
| Mode M0 | |||
|---|---|---|---|
| Quadrant | BADHDUFLAG | Total packets | Discarded packets |
| A | 0 | 14542 | 2 |
| B | 0 | 17757 | 1 |
| C | 0 | 13979 | 1 |
| D | 0 | 15788 | 1 |
| Mode SS | |||
|---|---|---|---|
| Quadrant | BADHDUFLAG | Total packets | Discarded packets |
| A | 0 | 138 | 0 |
| B | 0 | 138 | 0 |
| C | 0 | 138 | 0 |
| D | 0 | 138 | 0 |
| Quadrant | Total seconds | Saturated seconds | Saturation percentage |
|---|---|---|---|
| A | 6855 | 58 | 0.846098% |
| B | 6855 | 480 | 7.002188% |
| C | 6855 | 22 | 0.320934% |
| D | 6855 | 66 | 0.962801% |
Noise dominated data is calculated using 1-second bins in cleaned event files. If a bin has >2000 counts, and if more than 50% of those come from <1% of pixels, then it is considered to be noise-dominated and hence unusable.
| Quadrant | # 1 sec bins | Bins with >0 counts | Bins with >2000 counts | High rate bins dominated by noise | Noise dominated (total time) | Noise dominated (detector-on time) | Marked lightcurve |
|---|---|---|---|---|---|---|---|
| A | 7301 | 6856 | 12 | 12 | 0.16% | 0.18% | 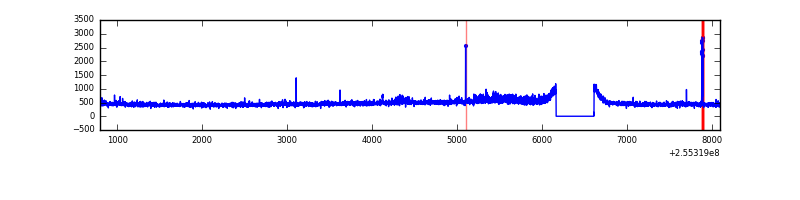 |
| B | 7301 | 6856 | 336 | 336 | 4.60% | 4.90% | 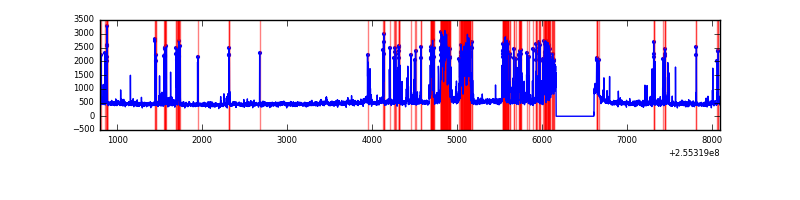 |
| C | 7301 | 6856 | 2 | 2 | 0.03% | 0.03% | 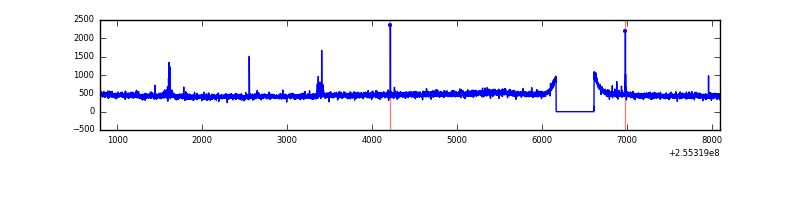 |
| D | 7301 | 6856 | 53 | 53 | 0.73% | 0.77% |  |
Top three noisy pixels from each quadrant. If the there are fewer than three noisy pixels in the level2.evt file, extra rows are filled as -1
| Pixel properties | Quadrant properties | ||||||
|---|---|---|---|---|---|---|---|
| Quadrant | DetID | PixID | Counts | Sigma | Mean | Median | Sigma |
| A | 15 | 239 | 110395 | 659.52 | 811 | 794 | 166.2 |
| A | 12 | 189 | 34422 | 202.35 | 811 | 794 | 166.2 |
| A | 15 | 222 | 29754 | 174.26 | 811 | 794 | 166.2 |
| B | 4 | 239 | 1277853 | 8440.16 | 791 | 773 | 151.3 |
| B | 0 | 214 | 32676 | 210.84 | 791 | 773 | 151.3 |
| B | 0 | 197 | 17442 | 110.16 | 791 | 773 | 151.3 |
| C | 15 | 208 | 15495 | 79.62 | 792 | 800 | 184.6 |
| C | 14 | 234 | 12265 | 62.12 | 792 | 800 | 184.6 |
| C | 8 | 128 | 10216 | 51.02 | 792 | 800 | 184.6 |
| D | 1 | 52 | 546246 | 2826.82 | 782 | 764 | 193.0 |
| D | 10 | 199 | 107345 | 552.33 | 782 | 764 | 193.0 |
| D | 13 | 104 | 30184 | 152.46 | 782 | 764 | 193.0 |
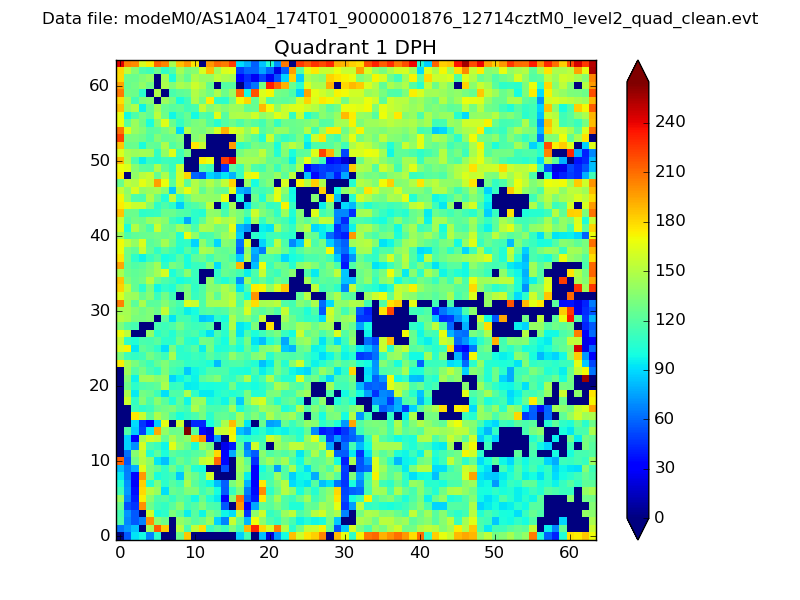
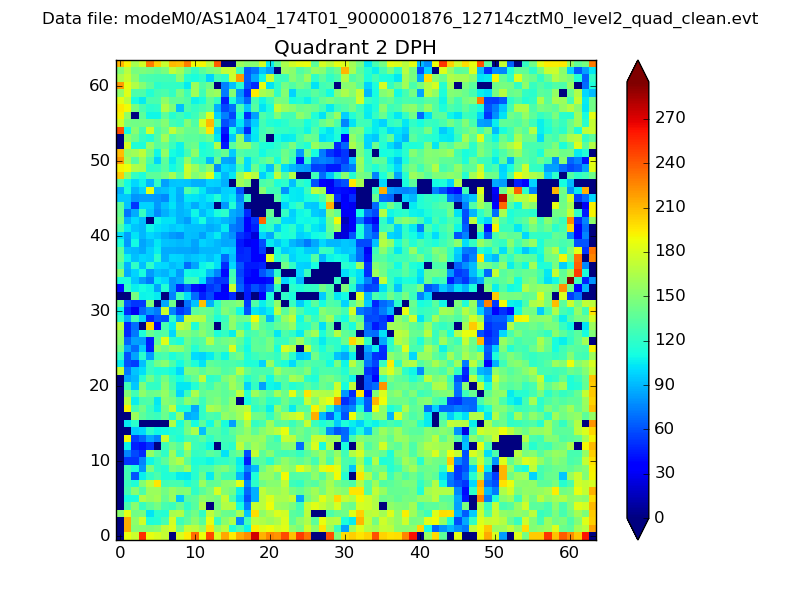
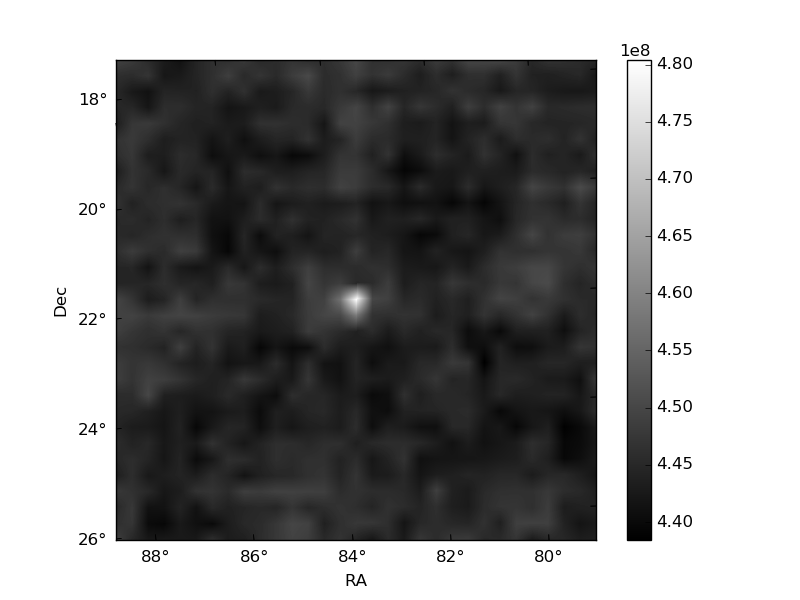
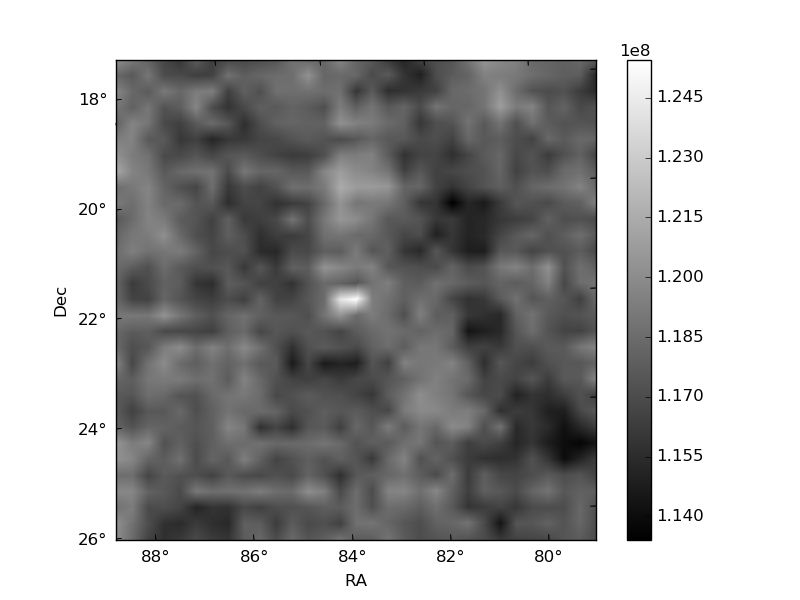
Histogram calculated using DETX and DETY for each event in the final _common_clean file
| Quadrant A | 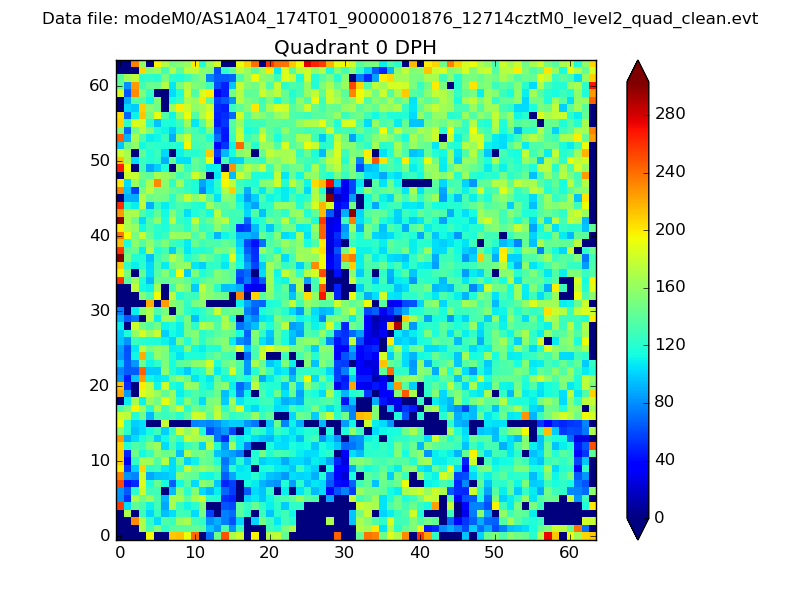 |
 |
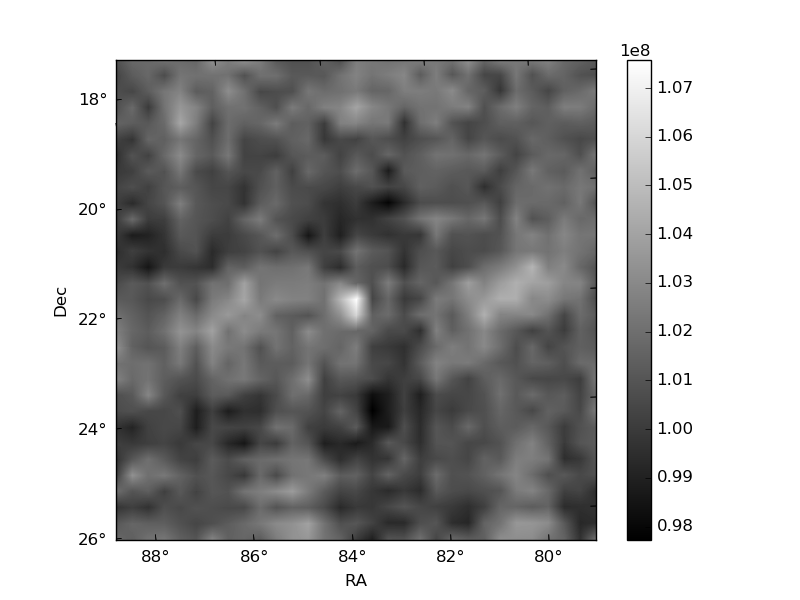
Quadrant B |
|---|---|---|---|
| Quadrant D | 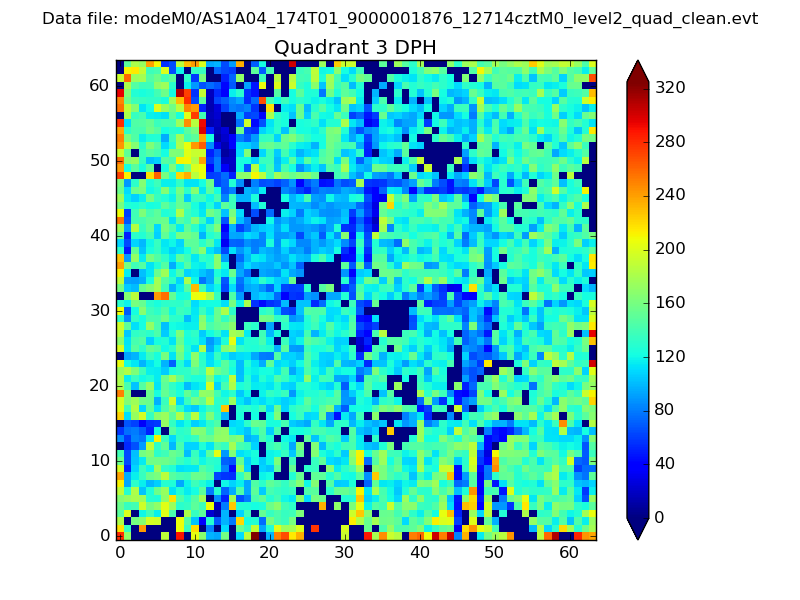 |
 |
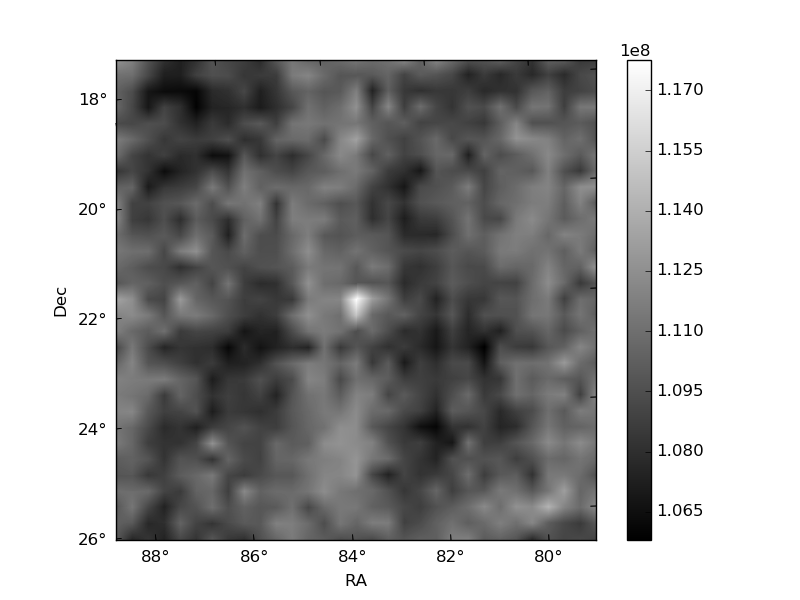
Quadrant C |
| Plot type | Count rate plots | Images |
|---|---|---|
| Comparison with Poisson distribution Blue bars denote a histogram of data divided into 1 sec bins. Red curve is a Poisson curve with rate = median count rate of data. |
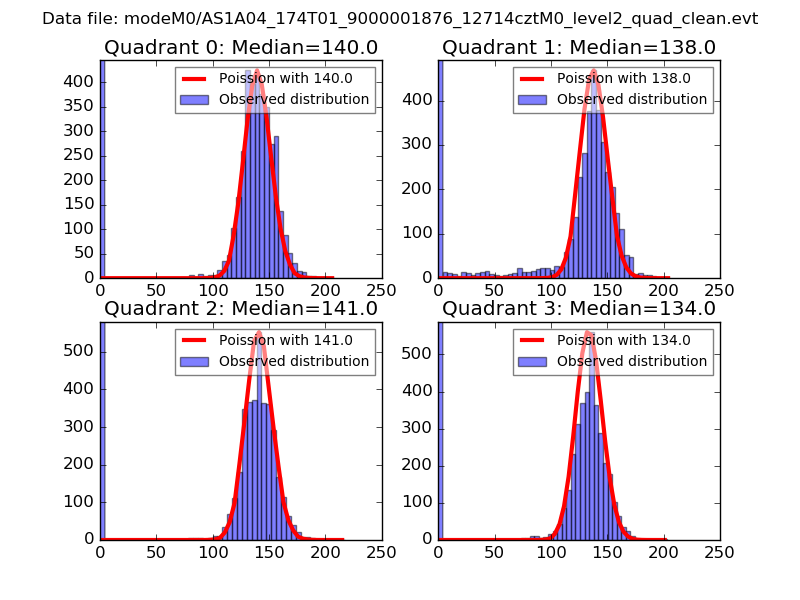 |
 |
| Quadrant-wise count rates Data is divided into 100 sec bins |
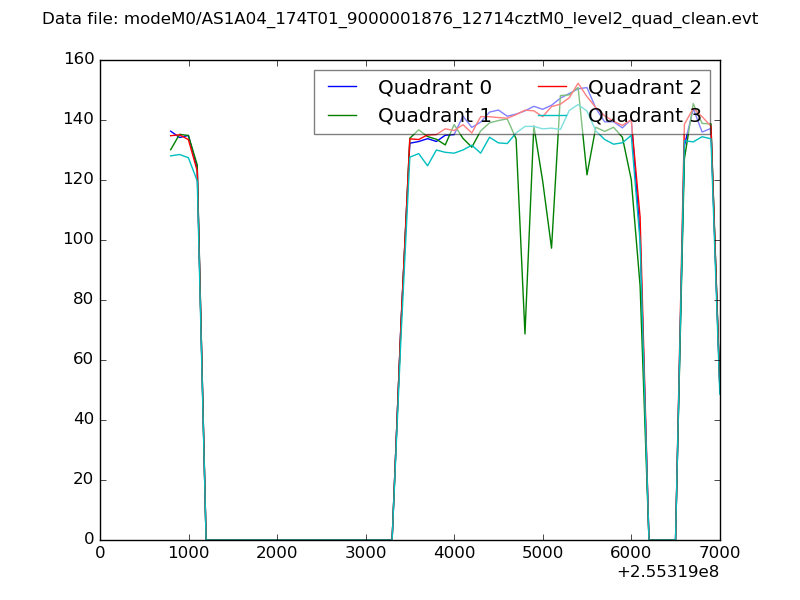 |
|
| Module-wise count rates for Quadrant A Data is divided into 100 sec bins |
 |
 |
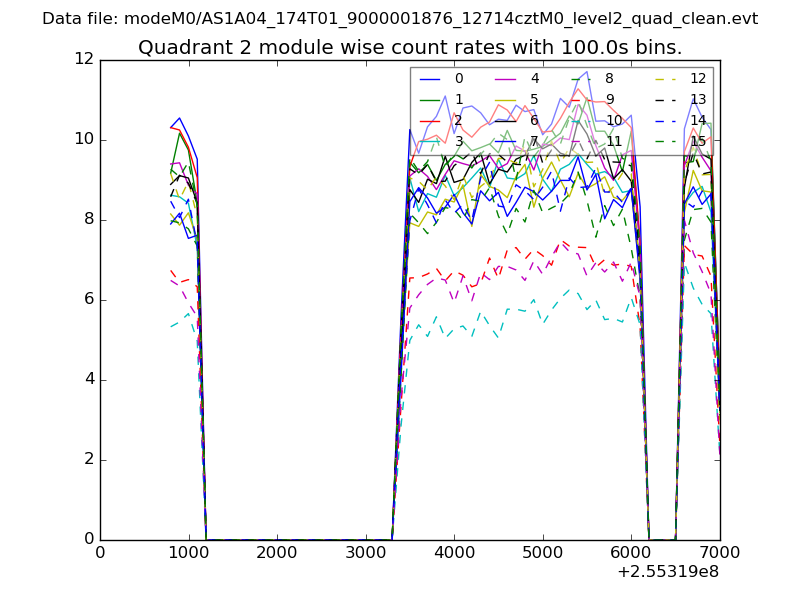
| Module-wise count rates for Quadrant B Data is divided into 100 sec bins |
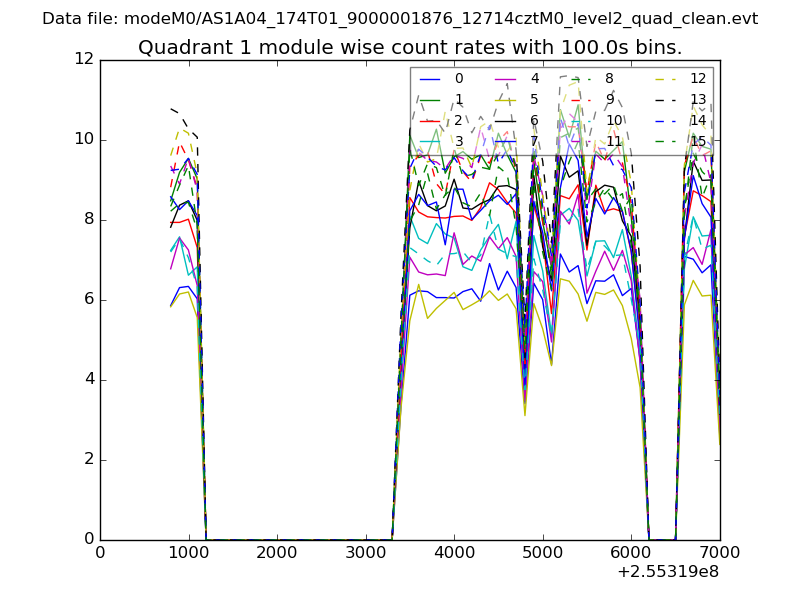 |
 |
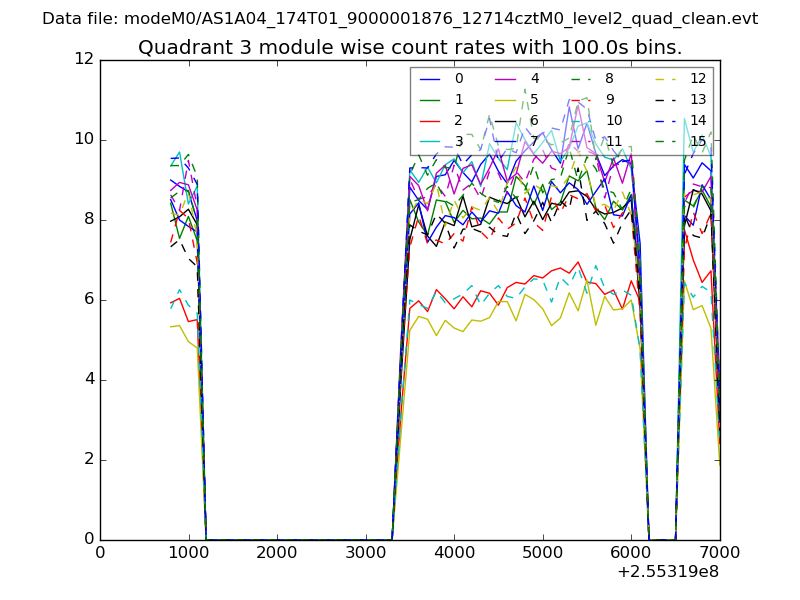
| Module-wise count rates for Quadrant C Data is divided into 100 sec bins |
 |
 |
| Module-wise count rates for Quadrant D Data is divided into 100 sec bins |
 |
 |
| Parameter | Plot |
|---|---|
| CZT HV Monitor | 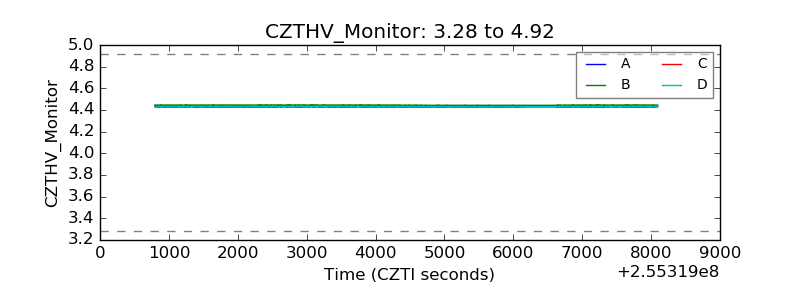 |
| D_VDD | 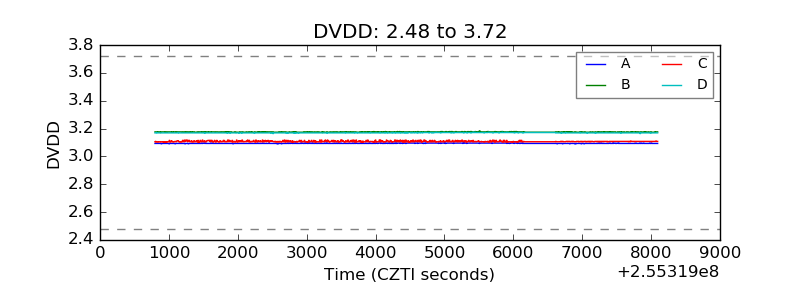 |
| Temperature 1 | 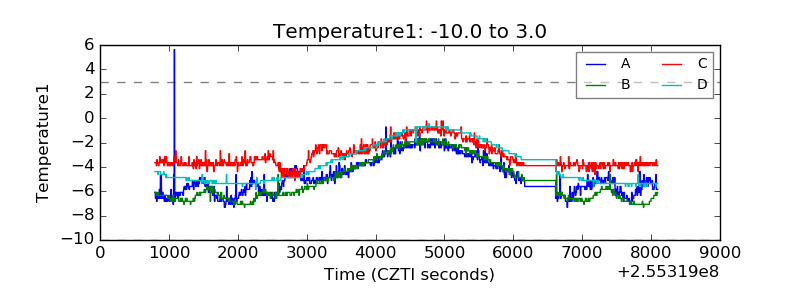 |
| Veto HV Monitor | 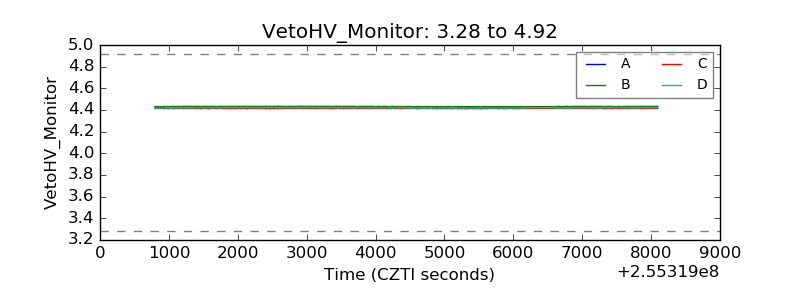 |
| Veto LLD |  |
| Alpha Counter | 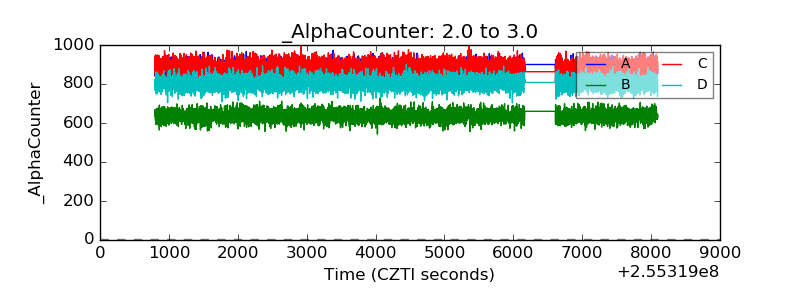 |
| _CPM_Rate | 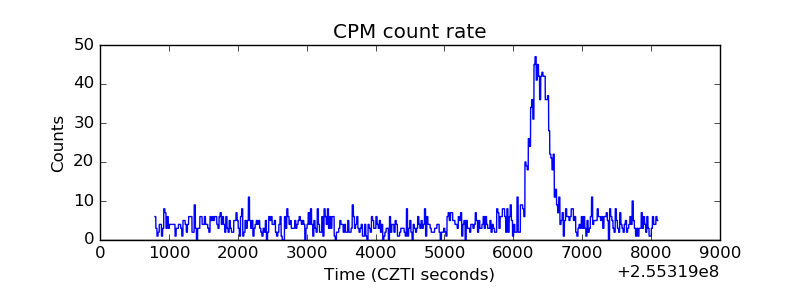 |
| CZT Counter | 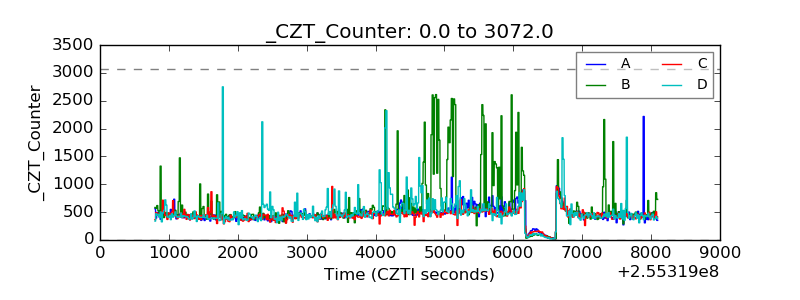 |
| +2.5 Volts monitor |  |
| +5 Volts monitor | 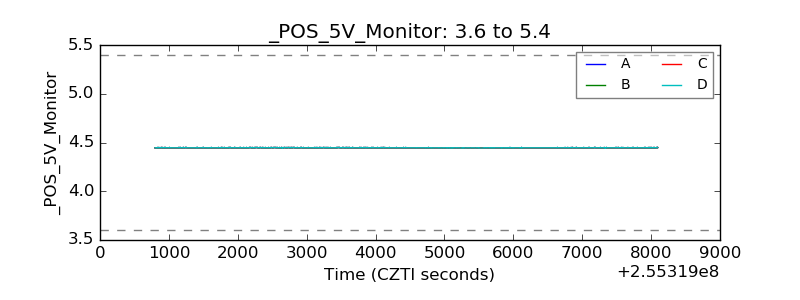 |
| _ROLL_ROT | 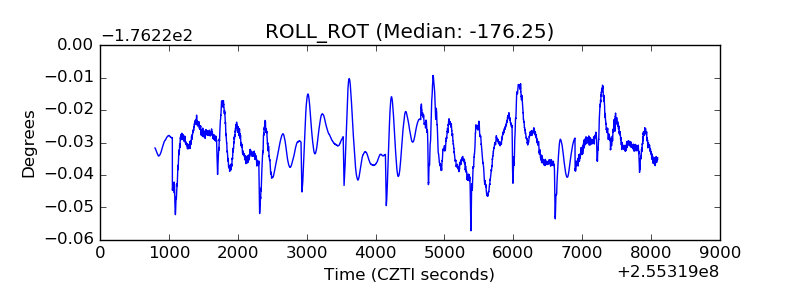 |
| _Roll_DEC | 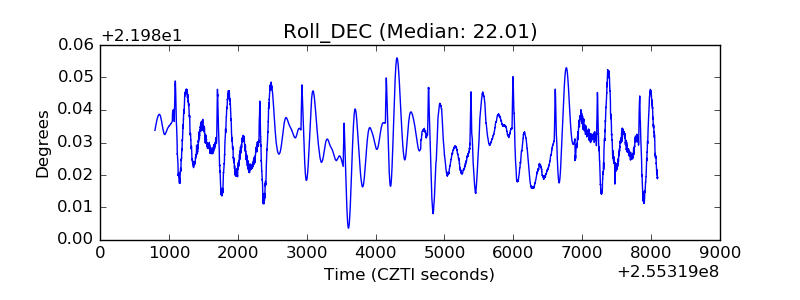 |
| _Roll_RA | 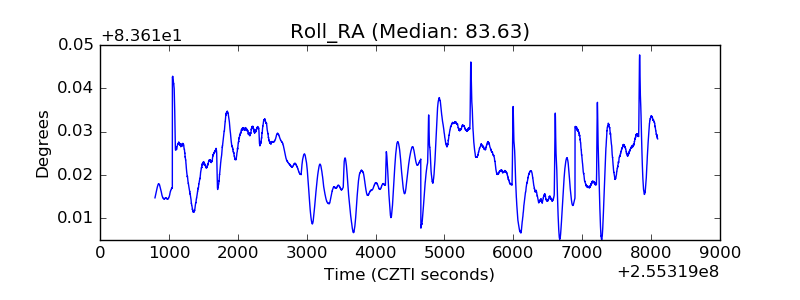 |
| Veto Counter |  |