| Param | Original file | Final file |
|---|---|---|
| Filename | modeM0/AS1A04_174T01_9000001876_12716cztM0_level2.evt | modeM0/AS1A04_174T01_9000001876_12716cztM0_level2_quad_clean.evt |
| Size (bytes) | 1,018,512,000 | 155,842,560 |
| Size | 971.3 MB | 148.6 MB |
| Events in quadrant A | 6,483,747 | 985,838 |
| Events in quadrant B | 9,989,314 | 895,849 |
| Events in quadrant C | 6,361,487 | 989,579 |
| Events in quadrant D | 7,127,151 | 944,866 |
| Mode M9 | |||
|---|---|---|---|
| Quadrant | BADHDUFLAG | Total packets | Discarded packets |
| A | 0 | 19 | 0 |
| B | 0 | 19 | 0 |
| C | 0 | 19 | 0 |
| D | 0 | 19 | 0 |
| Mode M0 | |||
|---|---|---|---|
| Quadrant | BADHDUFLAG | Total packets | Discarded packets |
| A | 0 | 27575 | 4 |
| B | 0 | 38098 | 3 |
| C | 0 | 27715 | 3 |
| D | 0 | 30063 | 3 |
| Mode SS | |||
|---|---|---|---|
| Quadrant | BADHDUFLAG | Total packets | Discarded packets |
| A | 0 | 264 | 0 |
| B | 0 | 264 | 0 |
| C | 0 | 264 | 0 |
| D | 0 | 264 | 0 |
| Quadrant | Total seconds | Saturated seconds | Saturation percentage |
|---|---|---|---|
| A | 13081 | 179 | 1.368397% |
| B | 13081 | 1602 | 12.246770% |
| C | 13081 | 121 | 0.925006% |
| D | 13081 | 317 | 2.423362% |
Noise dominated data is calculated using 1-second bins in cleaned event files. If a bin has >2000 counts, and if more than 50% of those come from <1% of pixels, then it is considered to be noise-dominated and hence unusable.
| Quadrant | # 1 sec bins | Bins with >0 counts | Bins with >2000 counts | High rate bins dominated by noise | Noise dominated (total time) | Noise dominated (detector-on time) | Marked lightcurve |
|---|---|---|---|---|---|---|---|
| A | 14813 | 13086 | 28 | 28 | 0.19% | 0.21% |  |
| B | 14813 | 13086 | 1137 | 1137 | 7.68% | 8.69% | 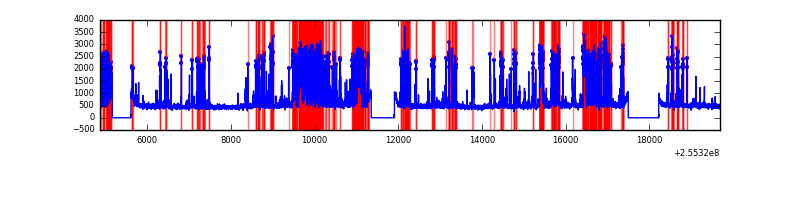 |
| C | 14813 | 13086 | 19 | 19 | 0.13% | 0.15% | 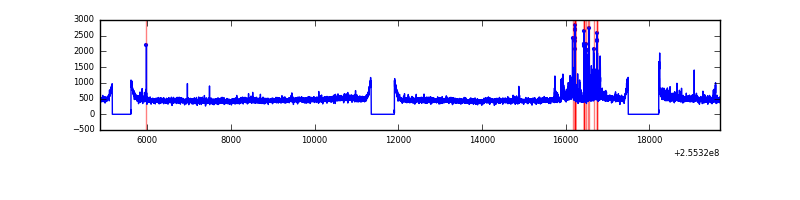 |
| D | 14813 | 13086 | 227 | 227 | 1.53% | 1.73% | 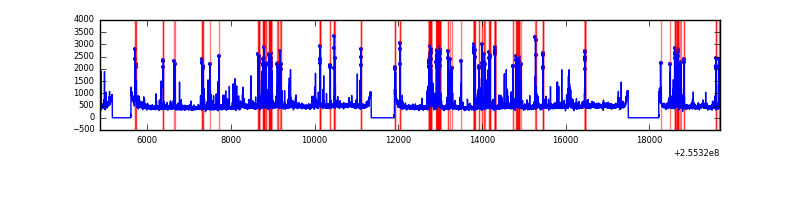 |
Top three noisy pixels from each quadrant. If the there are fewer than three noisy pixels in the level2.evt file, extra rows are filled as -1
| Pixel properties | Quadrant properties | ||||||
|---|---|---|---|---|---|---|---|
| Quadrant | DetID | PixID | Counts | Sigma | Mean | Median | Sigma |
| A | 15 | 222 | 138877 | 425.3 | 1588 | 1557 | 322.9 |
| A | 15 | 239 | 92724 | 282.36 | 1588 | 1557 | 322.9 |
| A | 12 | 189 | 80377 | 244.12 | 1588 | 1557 | 322.9 |
| B | 4 | 239 | 3869926 | 13360.39 | 1507 | 1471 | 289.5 |
| B | 3 | 64 | 67747 | 228.9 | 1507 | 1471 | 289.5 |
| B | 11 | 51 | 60981 | 205.53 | 1507 | 1471 | 289.5 |
| C | 15 | 208 | 320494 | 888.32 | 1547 | 1557 | 359.0 |
| C | 13 | 61 | 11088 | 26.55 | 1547 | 1557 | 359.0 |
| C | 14 | 234 | 10059 | 23.68 | 1547 | 1557 | 359.0 |
| D | 1 | 52 | 766644 | 2086.1 | 1520 | 1484 | 366.8 |
| D | 10 | 199 | 523636 | 1423.57 | 1520 | 1484 | 366.8 |
| D | 2 | 234 | 44252 | 116.6 | 1520 | 1484 | 366.8 |
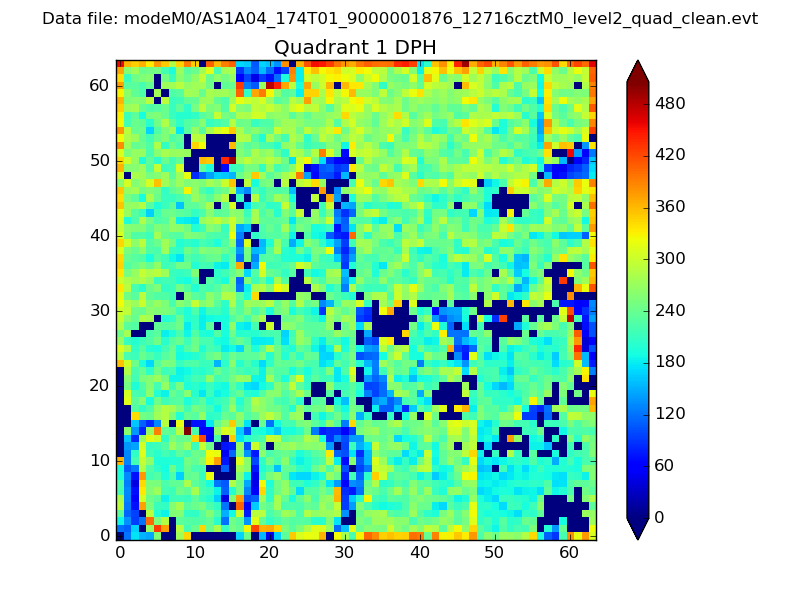
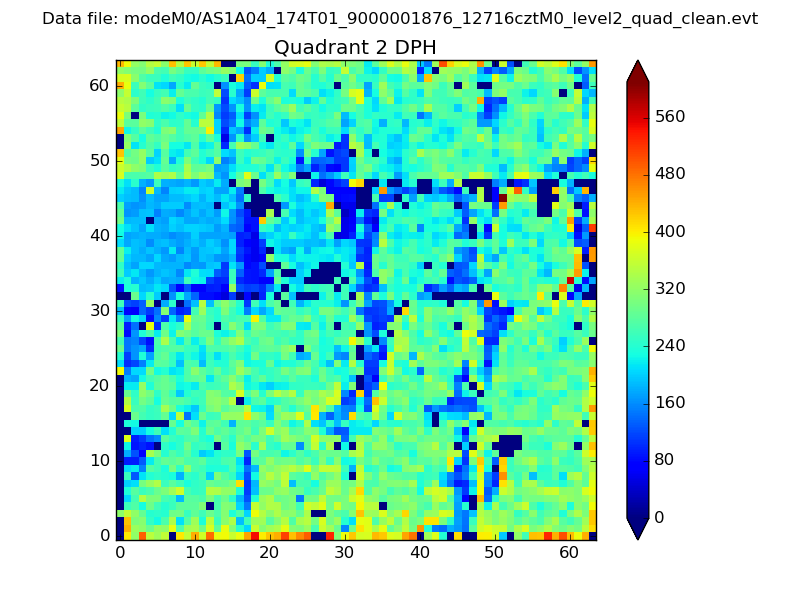
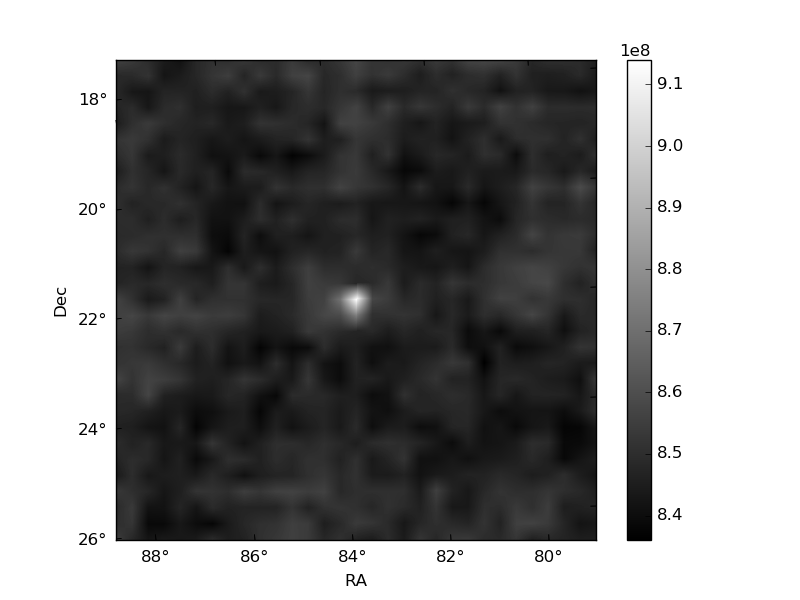
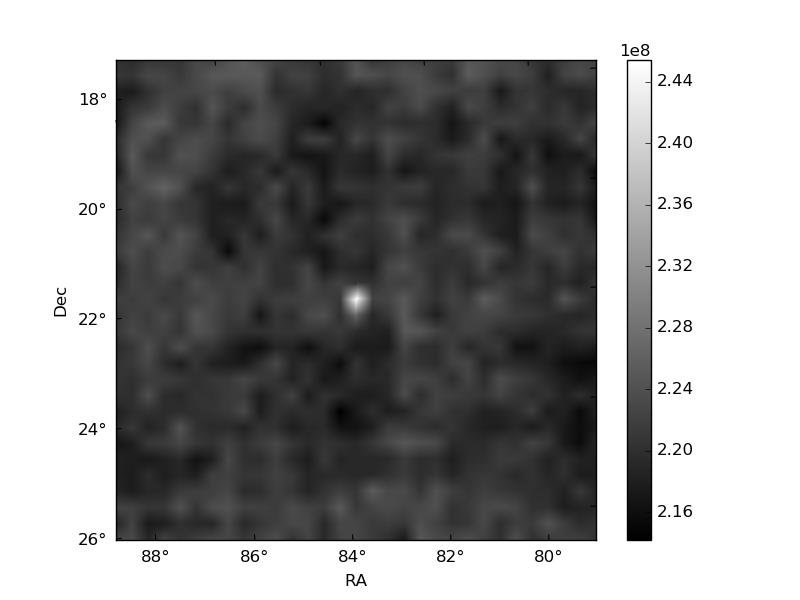
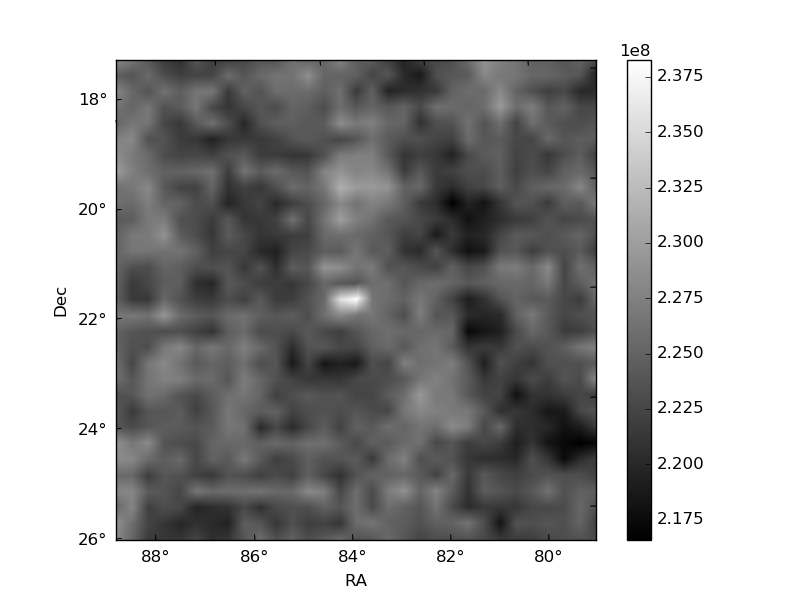
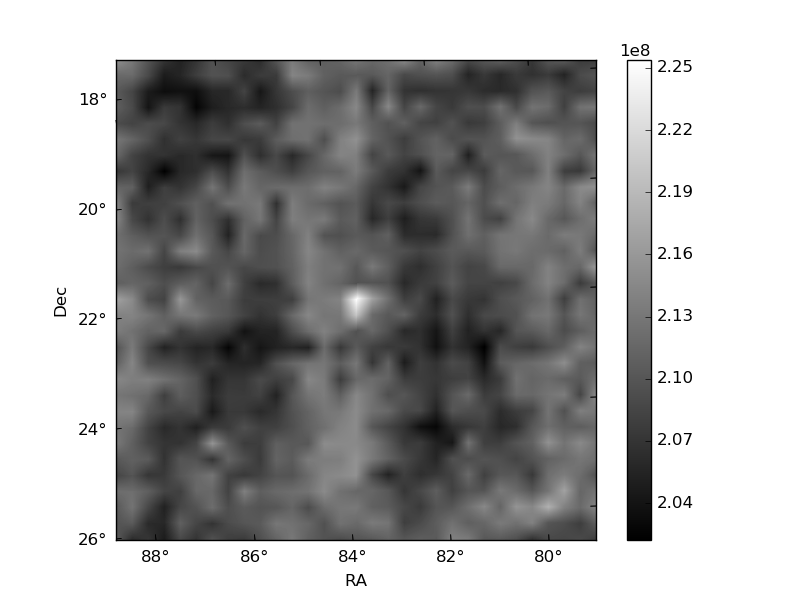
Histogram calculated using DETX and DETY for each event in the final _common_clean file
| Quadrant A | 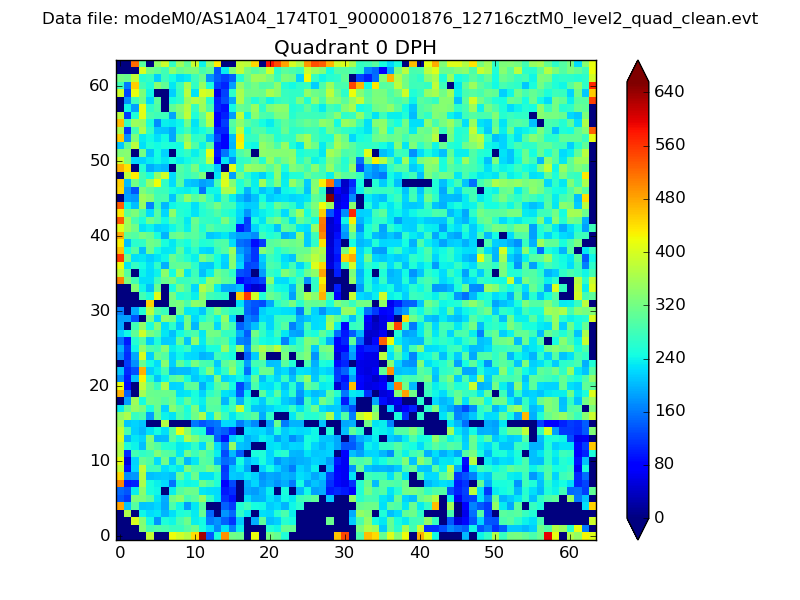 |
 |
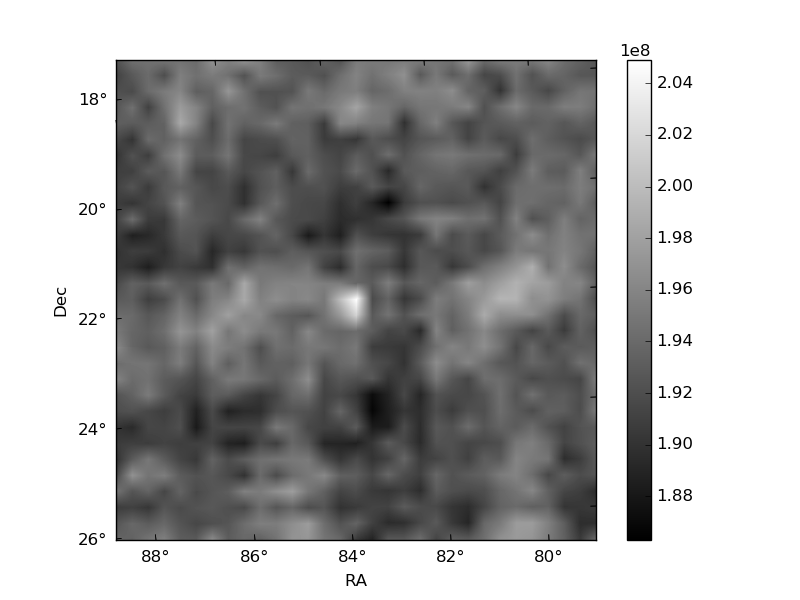
Quadrant B |
|---|---|---|---|
| Quadrant D | 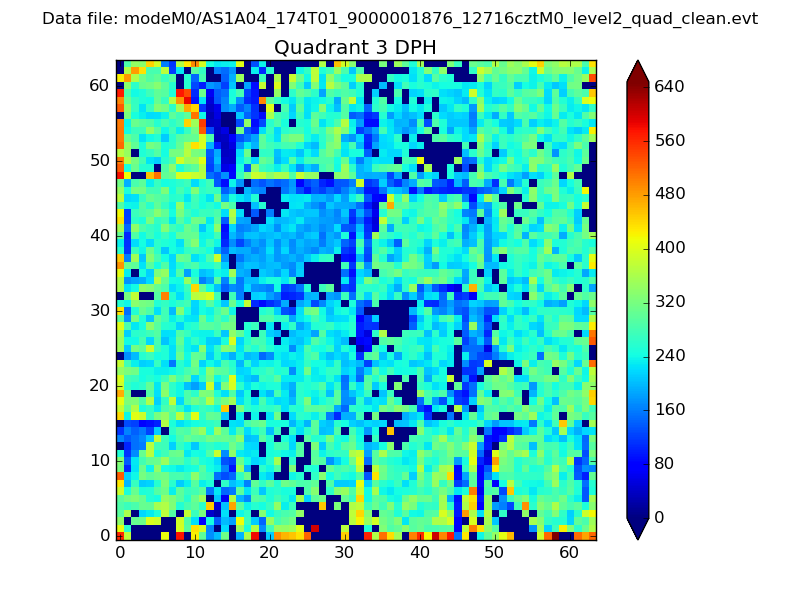 |
 |
Quadrant C |
| Plot type | Count rate plots | Images |
|---|---|---|
| Comparison with Poisson distribution Blue bars denote a histogram of data divided into 1 sec bins. Red curve is a Poisson curve with rate = median count rate of data. |
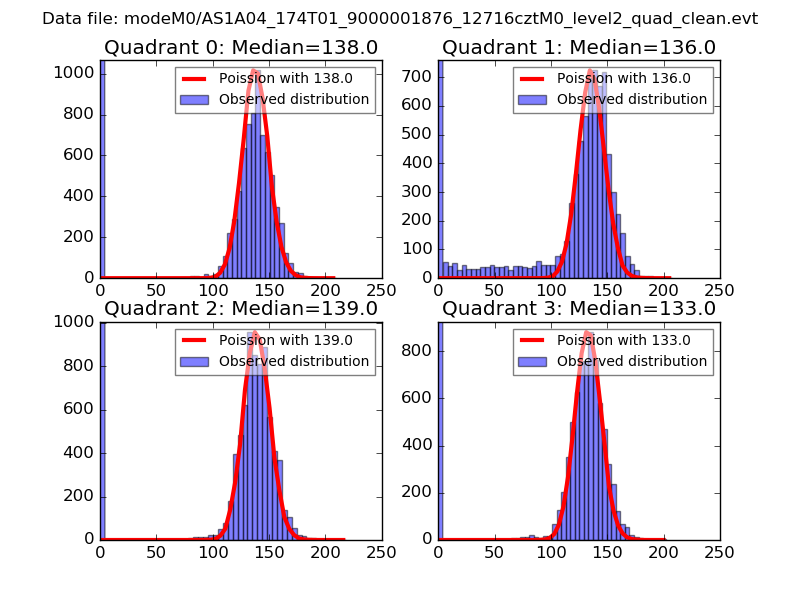 |
 |
| Quadrant-wise count rates Data is divided into 100 sec bins |
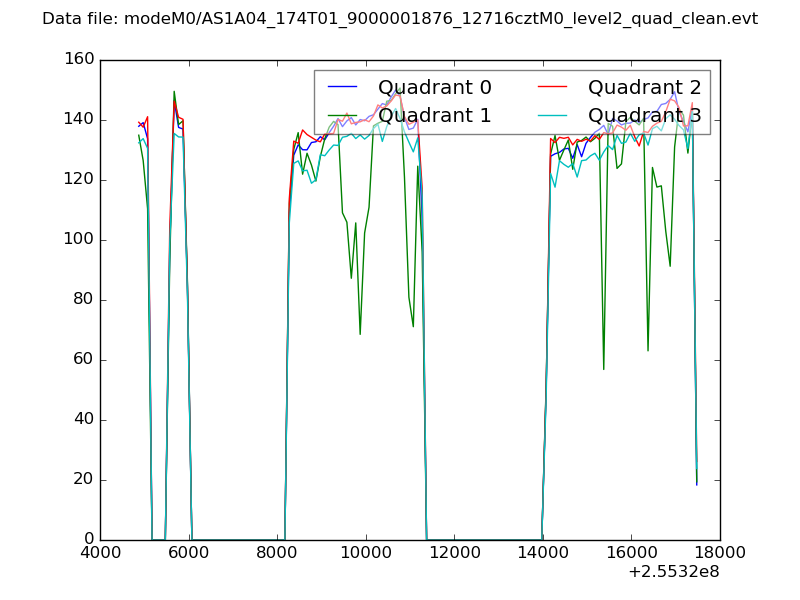 |
|
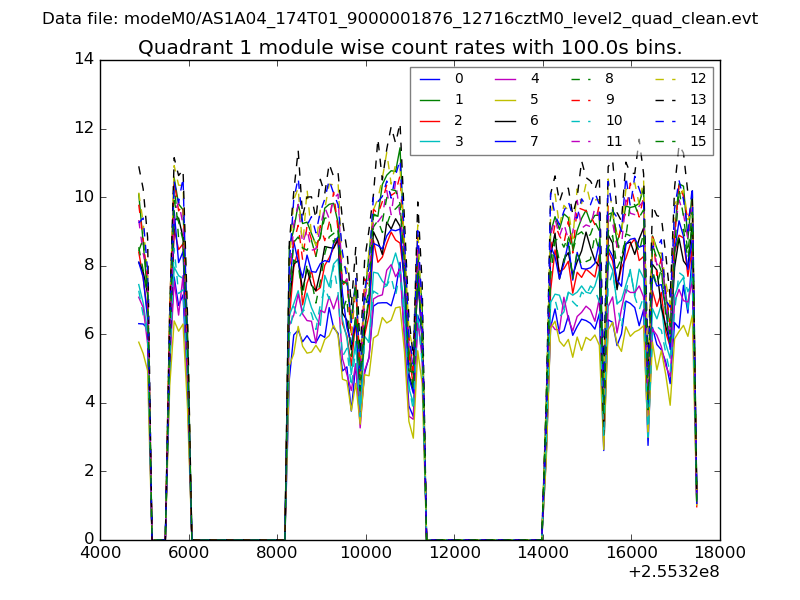
| Module-wise count rates for Quadrant A Data is divided into 100 sec bins |
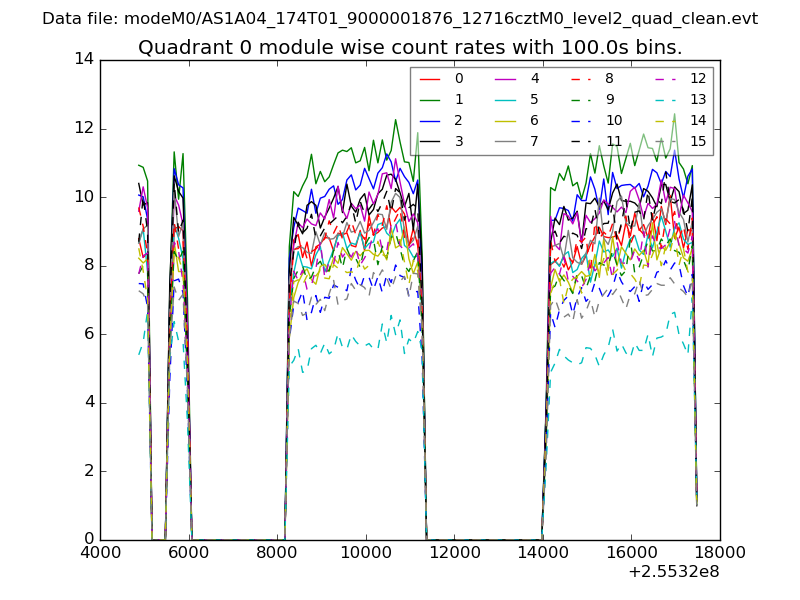 |
 |
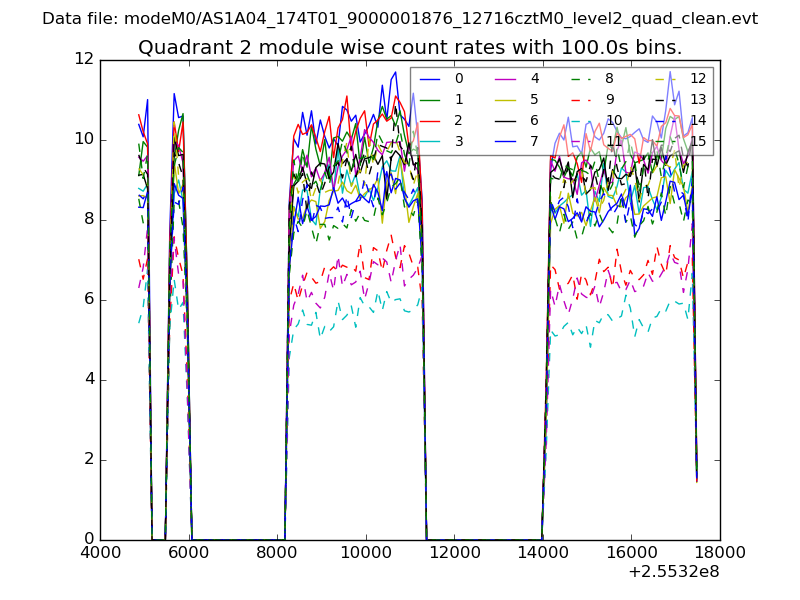
| Module-wise count rates for Quadrant B Data is divided into 100 sec bins |
 |
 |
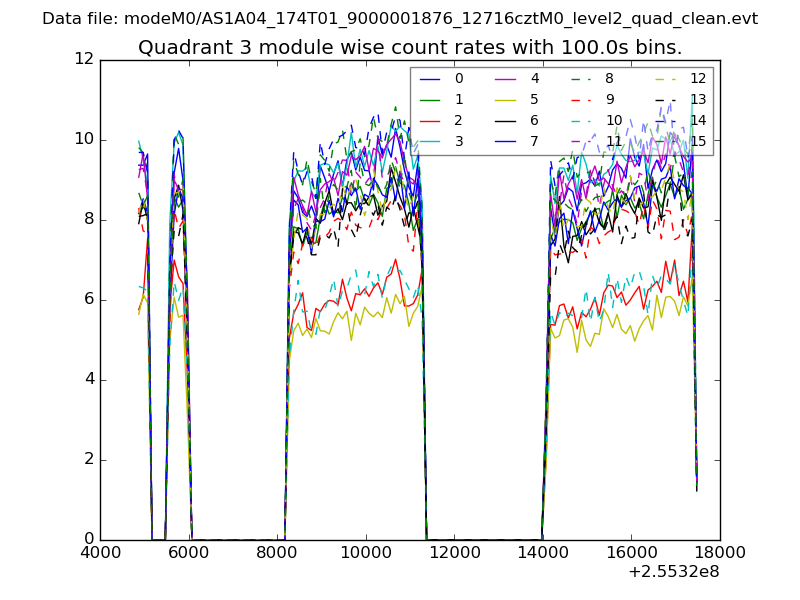
| Module-wise count rates for Quadrant C Data is divided into 100 sec bins |
 |
 |
| Module-wise count rates for Quadrant D Data is divided into 100 sec bins |
 |
 |
| Parameter | Plot |
|---|---|
| CZT HV Monitor | 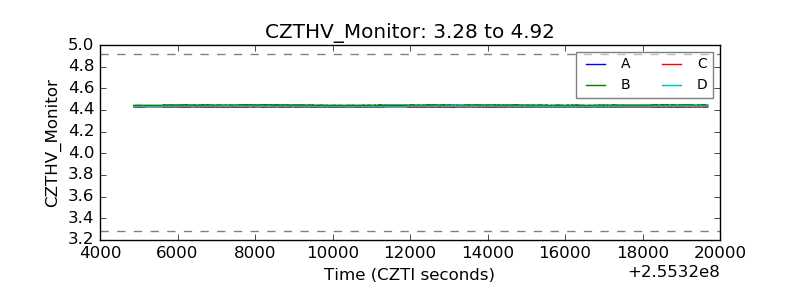 |
| D_VDD | 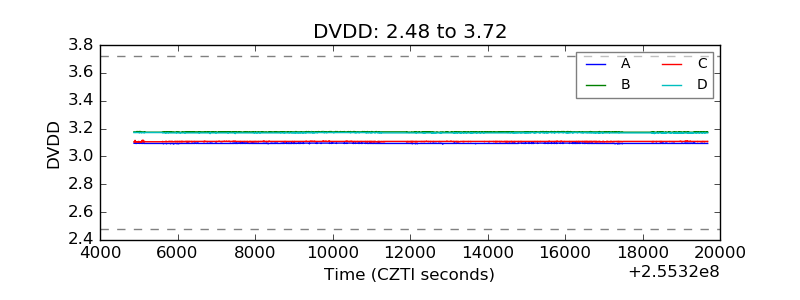 |
| Temperature 1 | 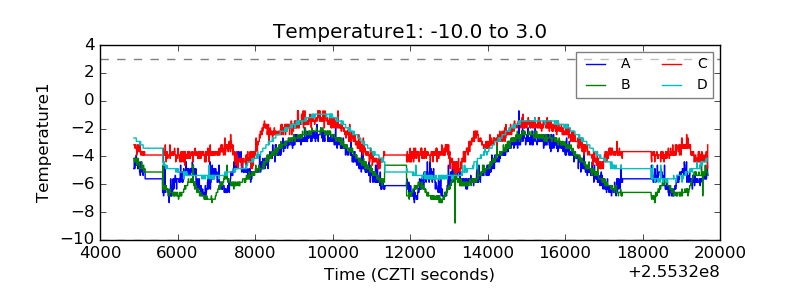 |
| Veto HV Monitor | 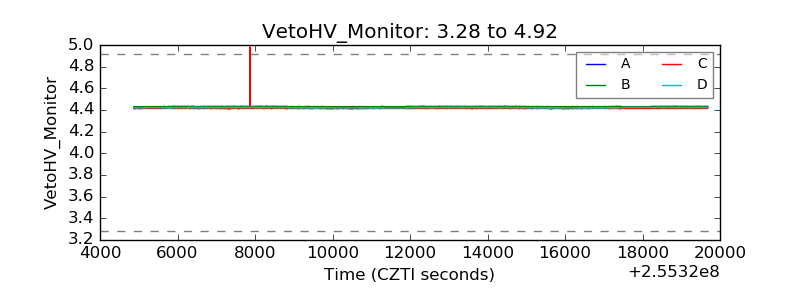 |
| Veto LLD | 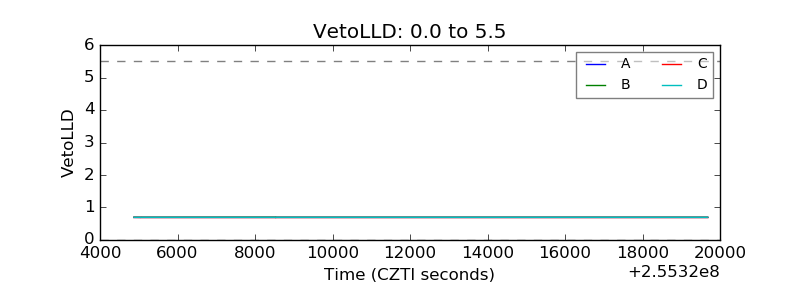 |
| Alpha Counter | 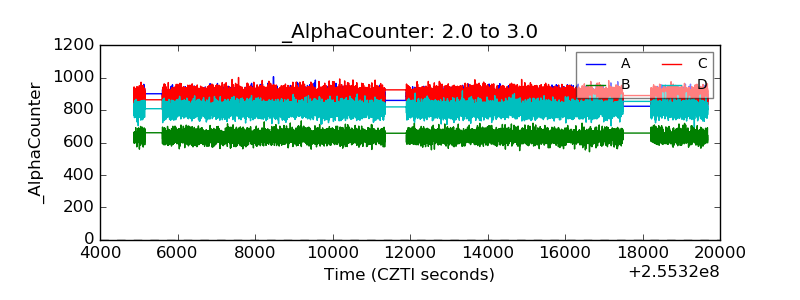 |
| _CPM_Rate | 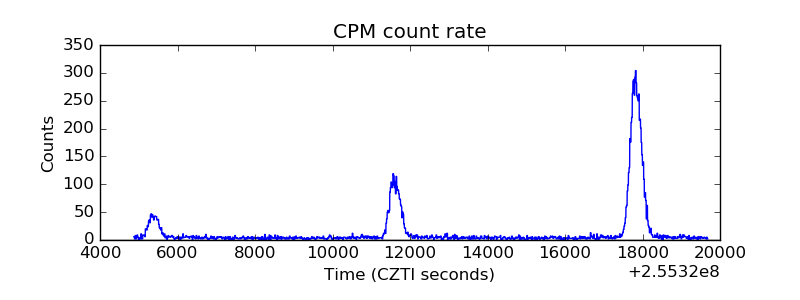 |
| CZT Counter | 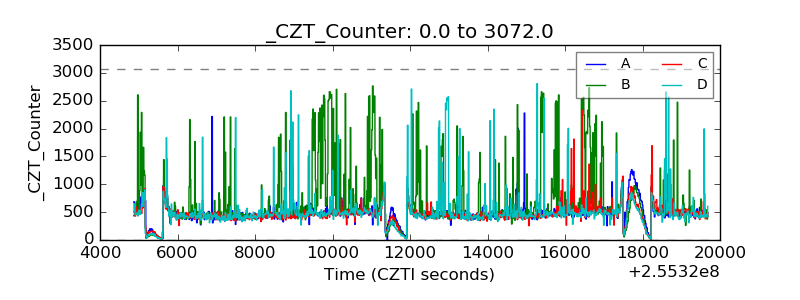 |
| +2.5 Volts monitor |  |
| +5 Volts monitor | 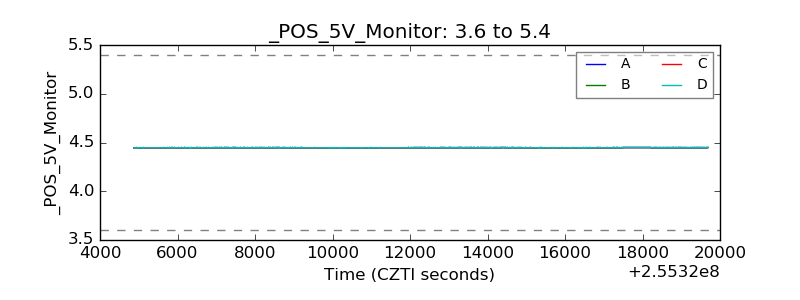 |
| _ROLL_ROT | 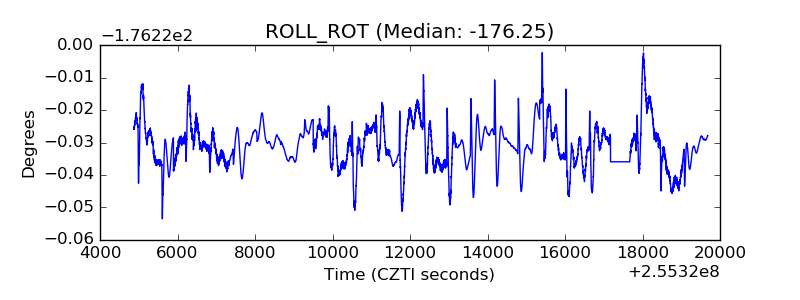 |
| _Roll_DEC | 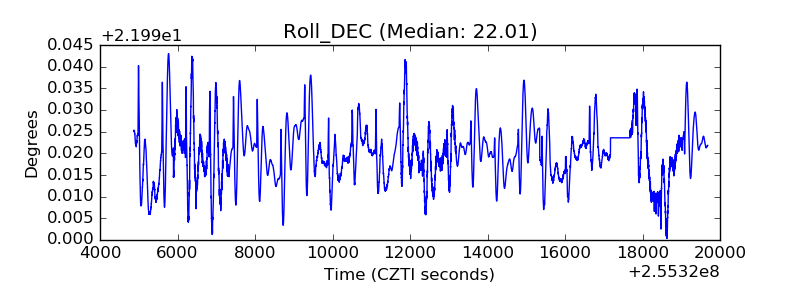 |
| _Roll_RA | 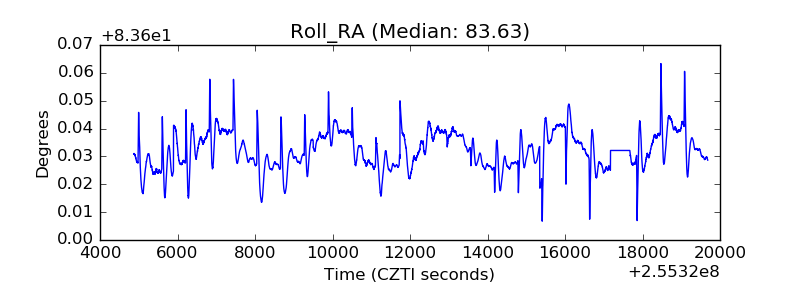 |
| Veto Counter | 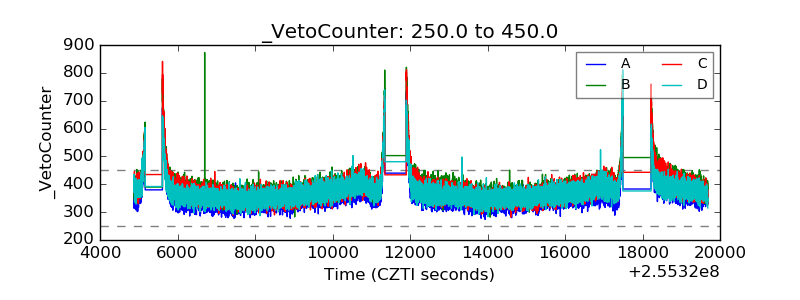 |