| Param | Original file | Final file |
|---|---|---|
| Filename | modeM0/AS1A04_174T01_9000001876_12717cztM0_level2.evt | modeM0/AS1A04_174T01_9000001876_12717cztM0_level2_quad_clean.evt |
| Size (bytes) | 526,510,080 | 82,330,560 |
| Size | 502.1 MB | 78.5 MB |
| Events in quadrant A | 3,339,053 | 517,189 |
| Events in quadrant B | 4,875,041 | 490,035 |
| Events in quadrant C | 3,360,692 | 516,271 |
| Events in quadrant D | 3,902,523 | 488,816 |
| Mode M9 | |||
|---|---|---|---|
| Quadrant | BADHDUFLAG | Total packets | Discarded packets |
| A | 0 | 9 | 0 |
| B | 0 | 9 | 0 |
| C | 0 | 9 | 0 |
| D | 0 | 10 | 0 |
| Mode M0 | |||
|---|---|---|---|
| Quadrant | BADHDUFLAG | Total packets | Discarded packets |
| A | 0 | 14108 | 3 |
| B | 0 | 18704 | 2 |
| C | 0 | 14377 | 2 |
| D | 0 | 16153 | 2 |
| Mode SS | |||
|---|---|---|---|
| Quadrant | BADHDUFLAG | Total packets | Discarded packets |
| A | 0 | 140 | 0 |
| B | 0 | 140 | 0 |
| C | 0 | 140 | 0 |
| D | 0 | 140 | 0 |
| Quadrant | Total seconds | Saturated seconds | Saturation percentage |
|---|---|---|---|
| A | 6897 | 63 | 0.913441% |
| B | 6897 | 559 | 8.104973% |
| C | 6897 | 59 | 0.855444% |
| D | 6897 | 137 | 1.986371% |
Noise dominated data is calculated using 1-second bins in cleaned event files. If a bin has >2000 counts, and if more than 50% of those come from <1% of pixels, then it is considered to be noise-dominated and hence unusable.
| Quadrant | # 1 sec bins | Bins with >0 counts | Bins with >2000 counts | High rate bins dominated by noise | Noise dominated (total time) | Noise dominated (detector-on time) | Marked lightcurve |
|---|---|---|---|---|---|---|---|
| A | 7778 | 6899 | 0 | 0 | 0.00% | 0.00% | 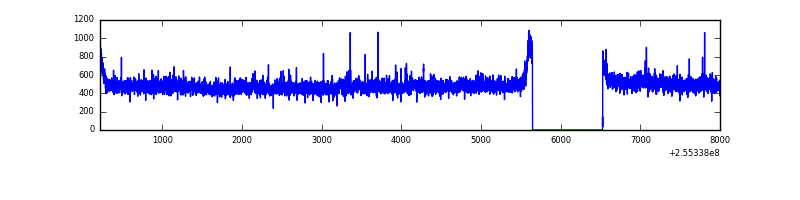 |
| B | 7778 | 6899 | 350 | 350 | 4.50% | 5.07% | 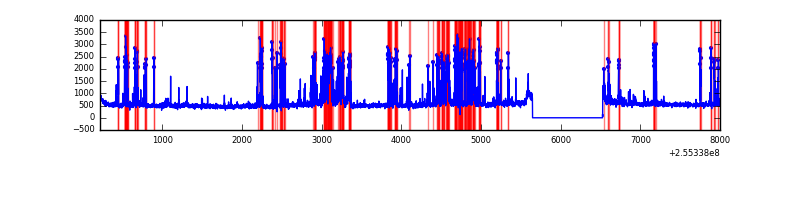 |
| C | 7778 | 6899 | 0 | 0 | 0.00% | 0.00% | 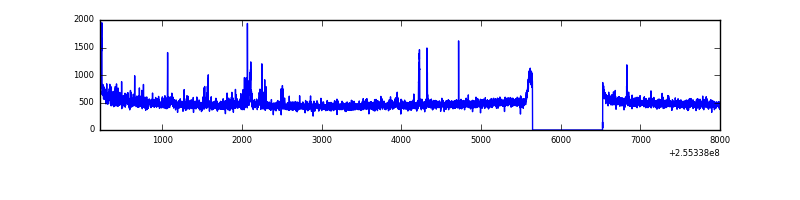 |
| D | 7778 | 6899 | 85 | 85 | 1.09% | 1.23% | 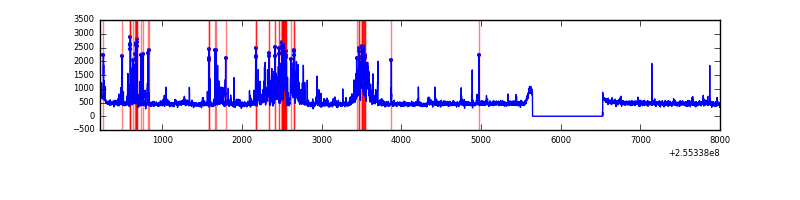 |
Top three noisy pixels from each quadrant. If the there are fewer than three noisy pixels in the level2.evt file, extra rows are filled as -1
| Pixel properties | Quadrant properties | ||||||
|---|---|---|---|---|---|---|---|
| Quadrant | DetID | PixID | Counts | Sigma | Mean | Median | Sigma |
| A | 12 | 189 | 42766 | 238.42 | 852 | 837 | 175.9 |
| A | 8 | 15 | 13091 | 69.68 | 852 | 837 | 175.9 |
| A | 0 | 226 | 7339 | 36.97 | 852 | 837 | 175.9 |
| B | 4 | 239 | 1389974 | 8805.0 | 824 | 807 | 157.8 |
| B | 4 | 206 | 191397 | 1208.02 | 824 | 807 | 157.8 |
| B | 12 | 111 | 18212 | 110.32 | 824 | 807 | 157.8 |
| C | 15 | 208 | 139670 | 718.22 | 826 | 830 | 193.3 |
| C | 13 | 61 | 6002 | 26.75 | 826 | 830 | 193.3 |
| C | 8 | 222 | 2491 | 8.59 | 826 | 830 | 193.3 |
| D | 1 | 52 | 649442 | 3349.77 | 812 | 794 | 193.6 |
| D | 10 | 199 | 147901 | 759.7 | 812 | 794 | 193.6 |
| D | 2 | 234 | 24276 | 121.27 | 812 | 794 | 193.6 |
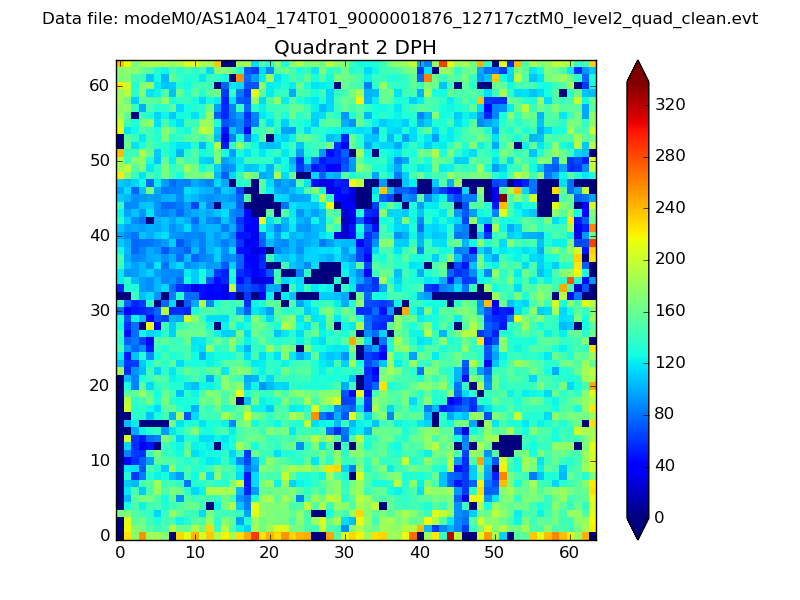
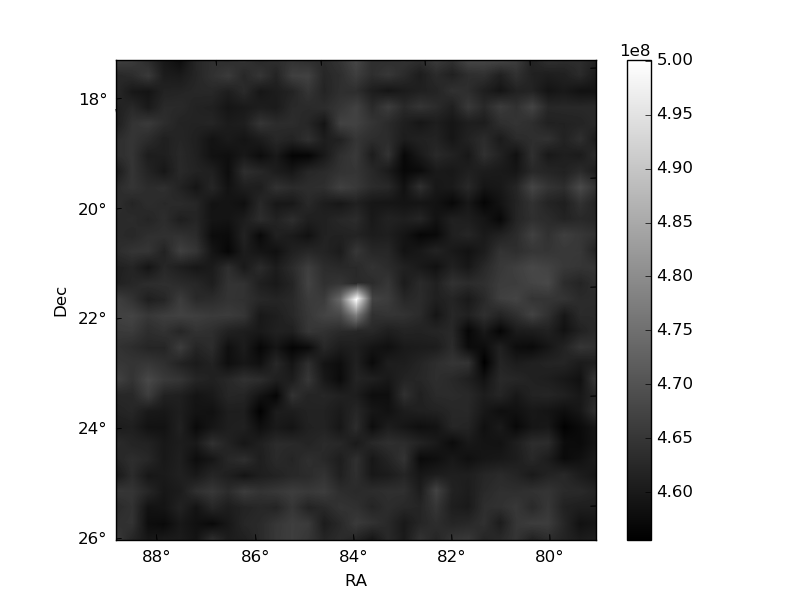
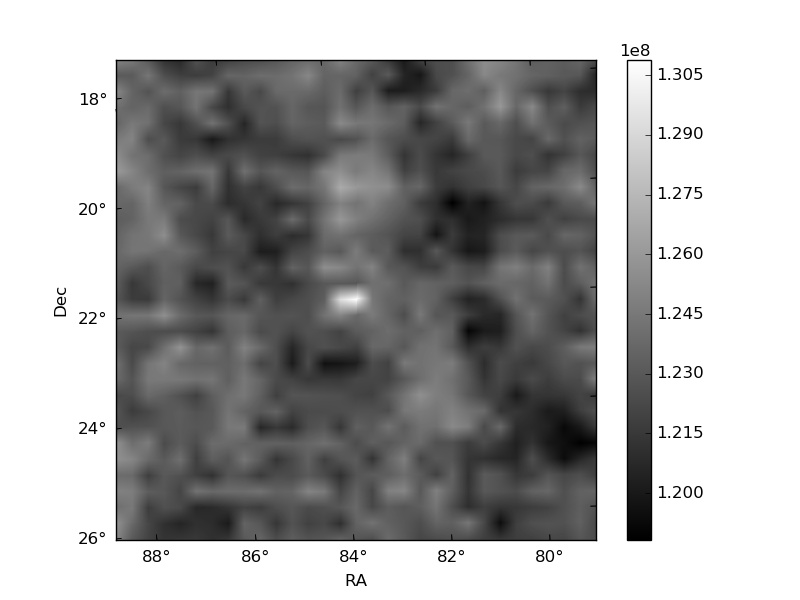
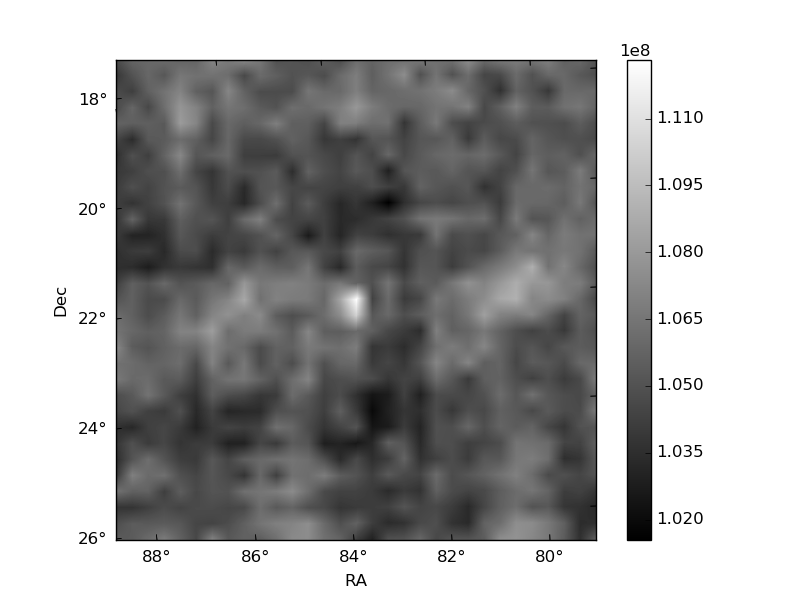
Histogram calculated using DETX and DETY for each event in the final _common_clean file
| Quadrant A | 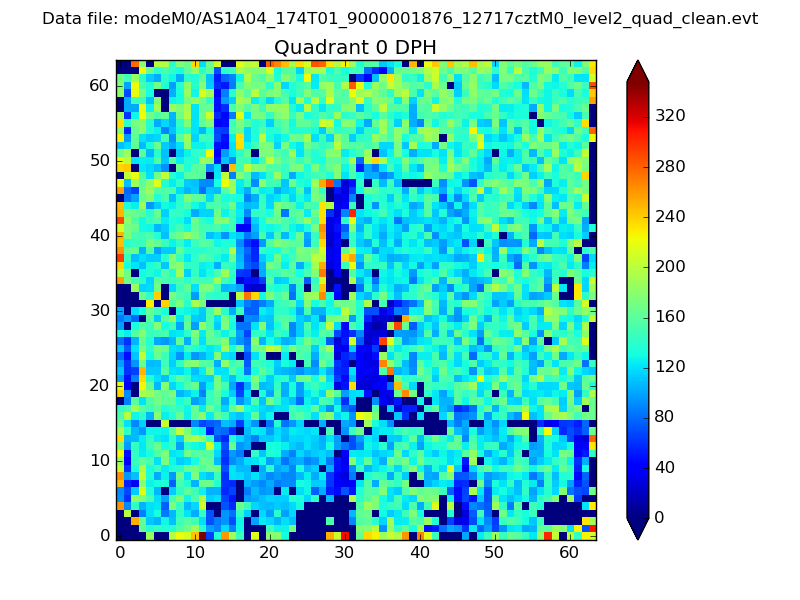 |
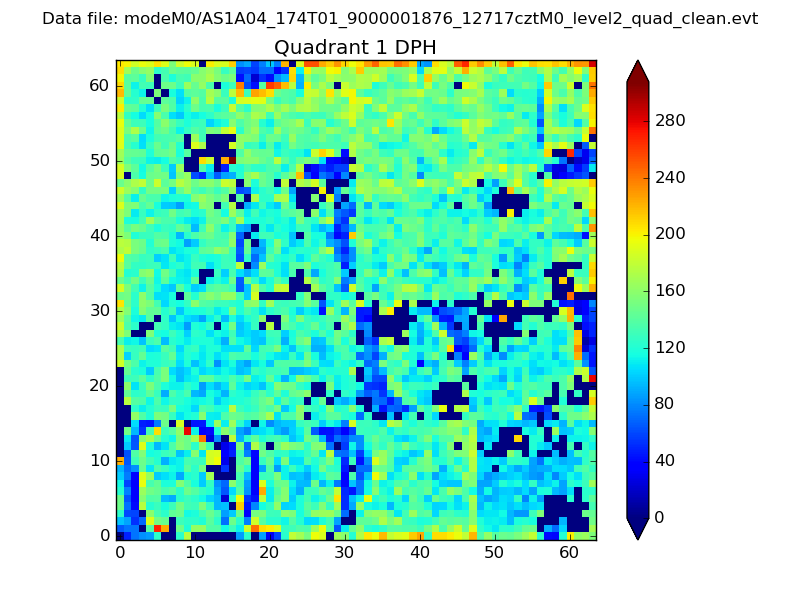 |
Quadrant B |
|---|---|---|---|
| Quadrant D | 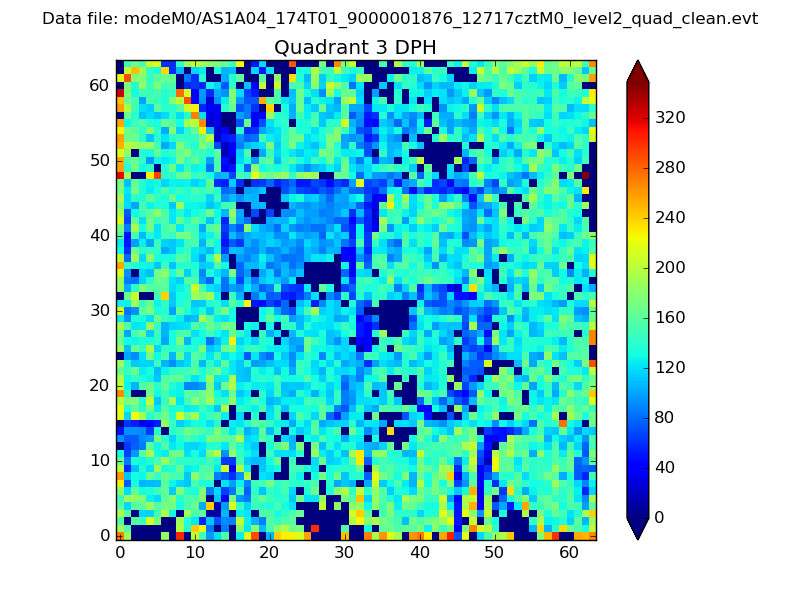 |
 |
Quadrant C |
| Plot type | Count rate plots | Images |
|---|---|---|
| Comparison with Poisson distribution Blue bars denote a histogram of data divided into 1 sec bins. Red curve is a Poisson curve with rate = median count rate of data. |
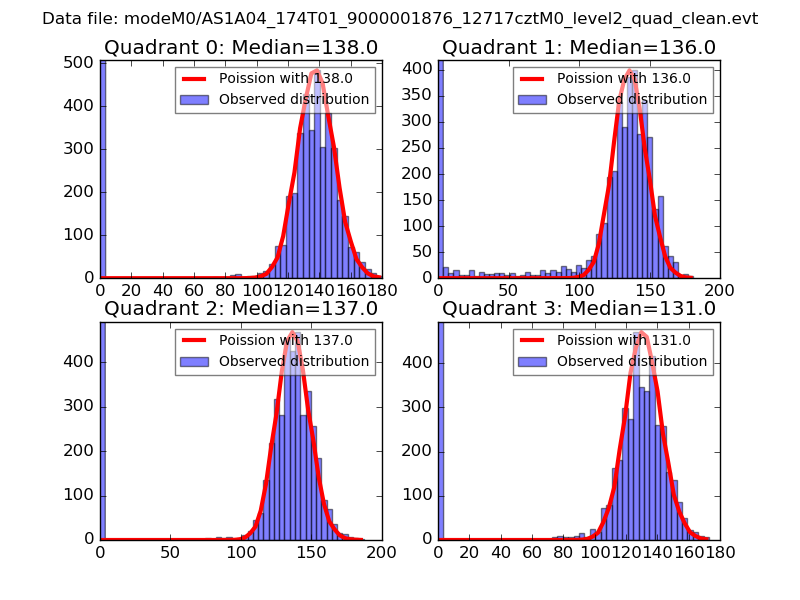 |
 |
| Quadrant-wise count rates Data is divided into 100 sec bins |
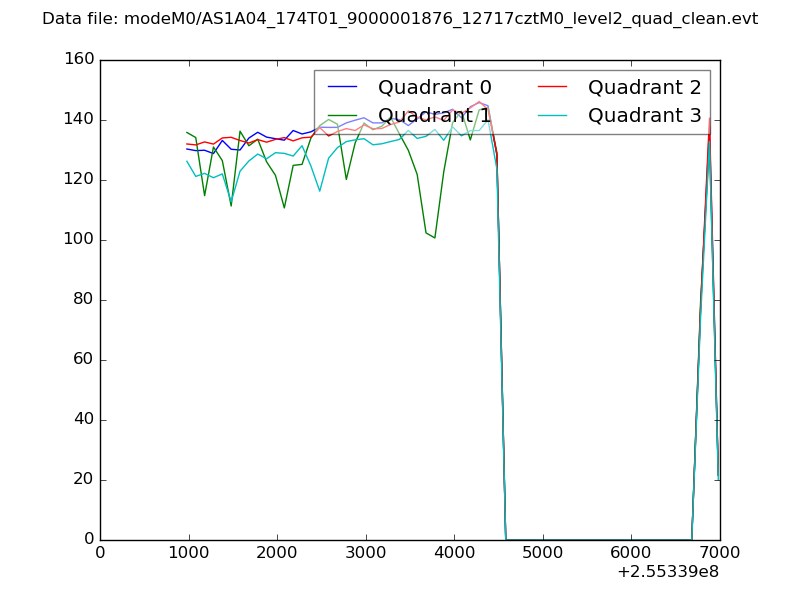 |
|
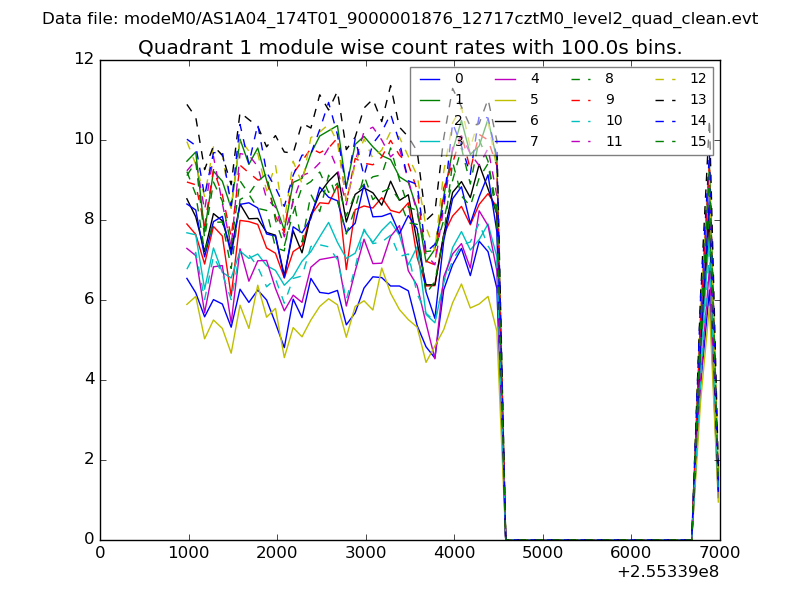
| Module-wise count rates for Quadrant A Data is divided into 100 sec bins |
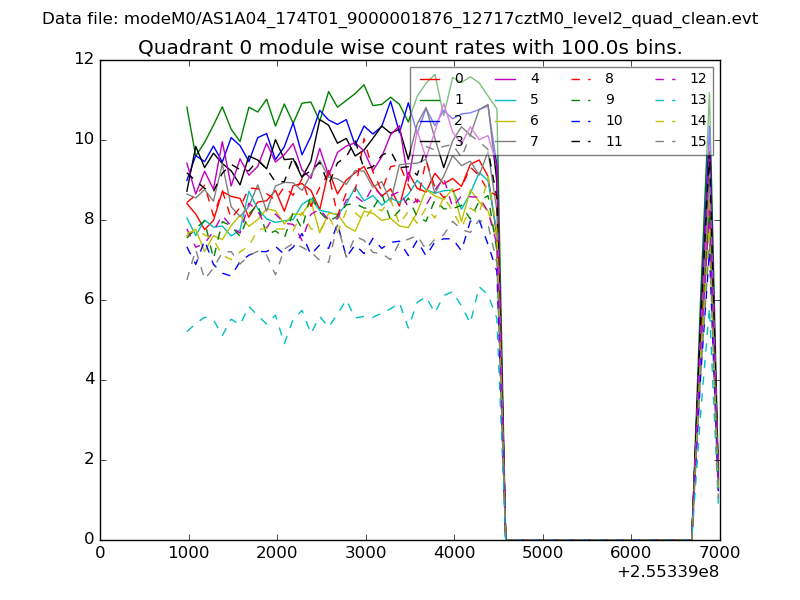 |
 |
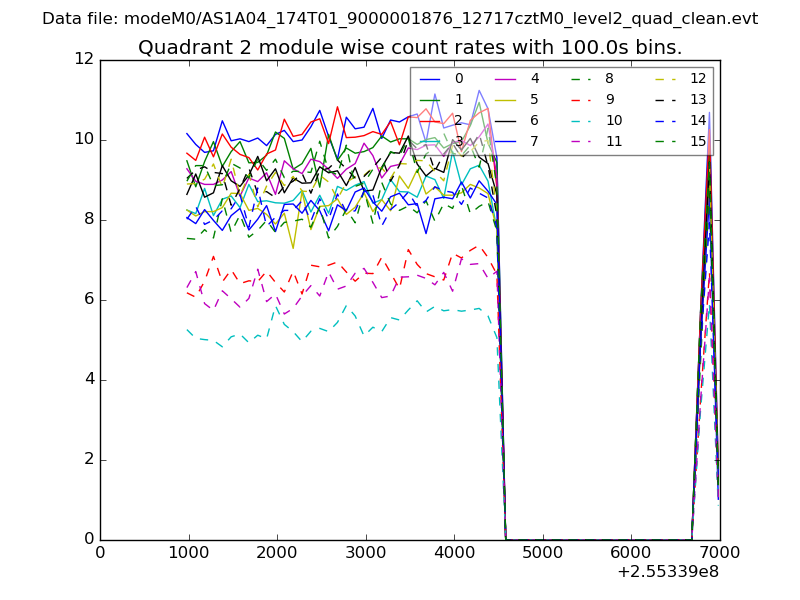
| Module-wise count rates for Quadrant B Data is divided into 100 sec bins |
 |
 |
| Module-wise count rates for Quadrant C Data is divided into 100 sec bins |
 |
 |
| Module-wise count rates for Quadrant D Data is divided into 100 sec bins |
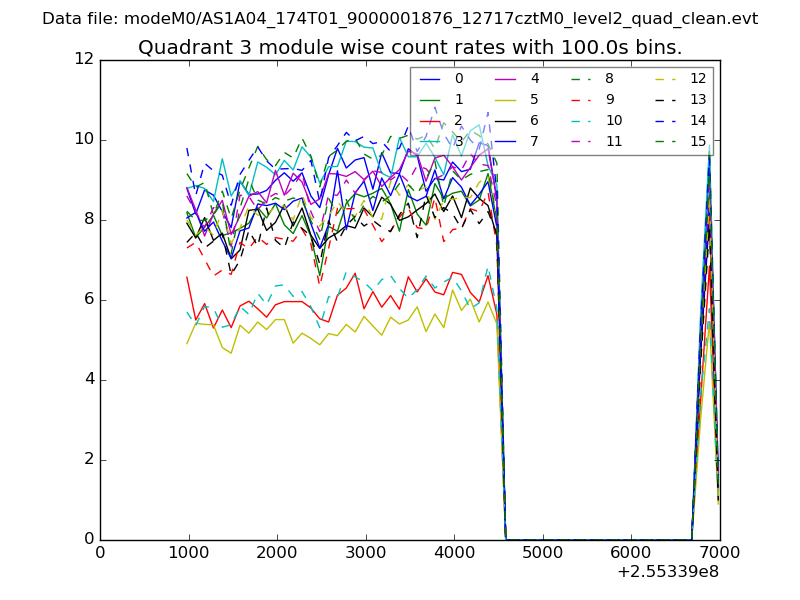 |
 |
| Parameter | Plot |
|---|---|
| CZT HV Monitor | 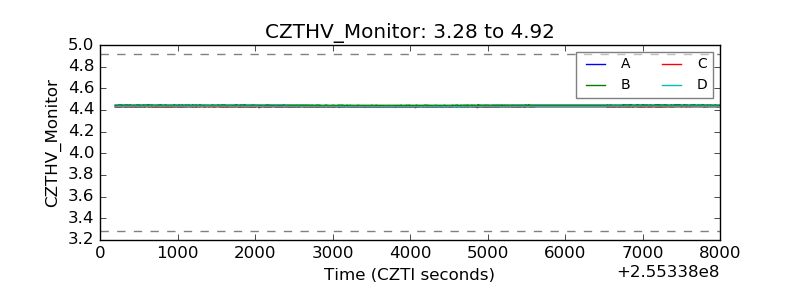 |
| D_VDD | 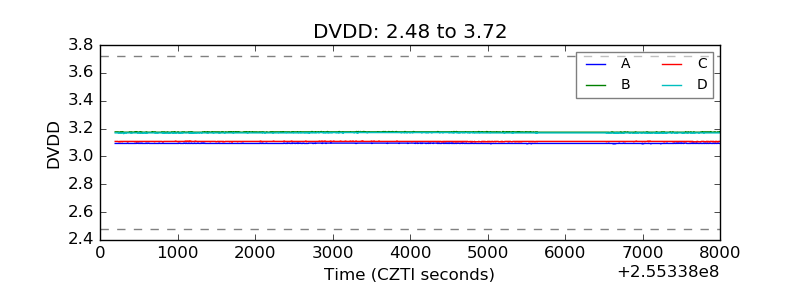 |
| Temperature 1 | 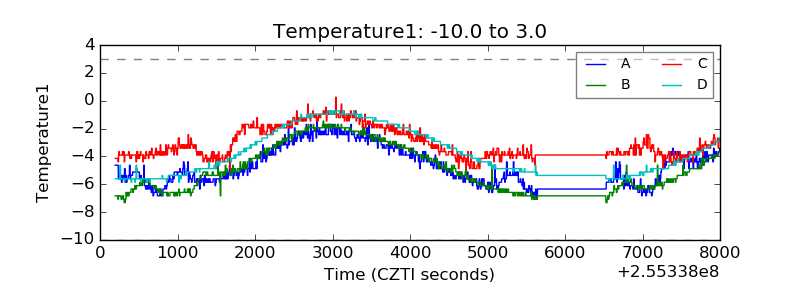 |
| Veto HV Monitor | 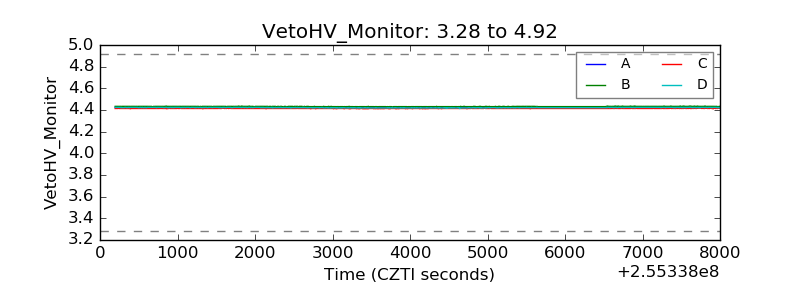 |
| Veto LLD | 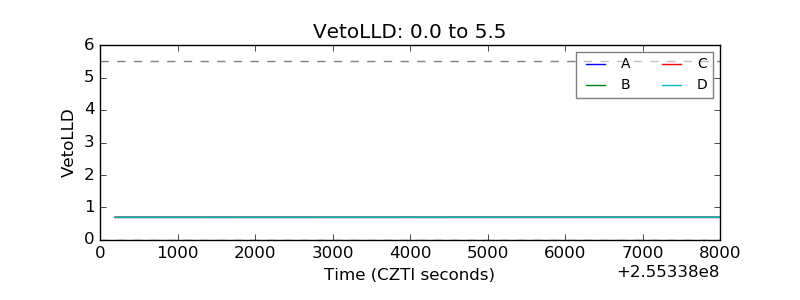 |
| Alpha Counter | 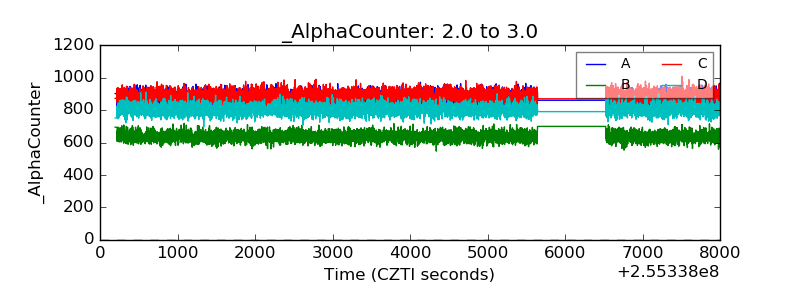 |
| _CPM_Rate | 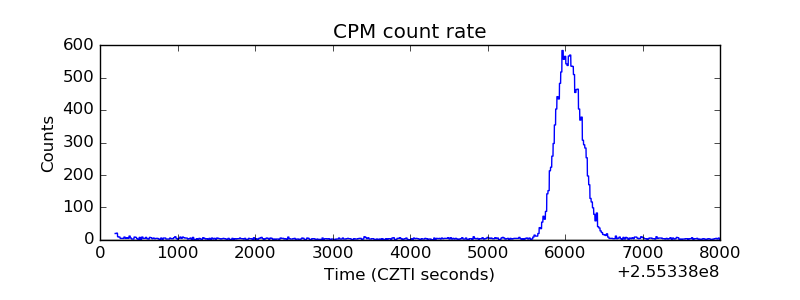 |
| CZT Counter | 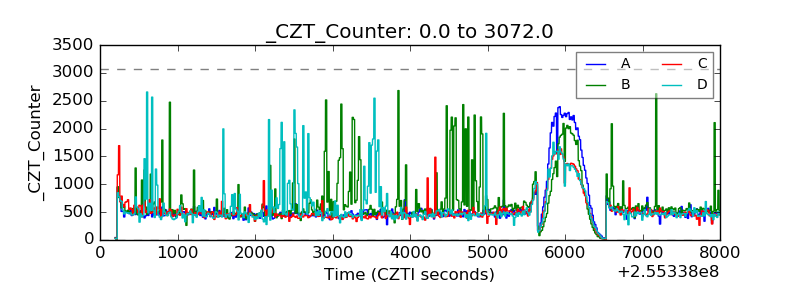 |
| +2.5 Volts monitor | 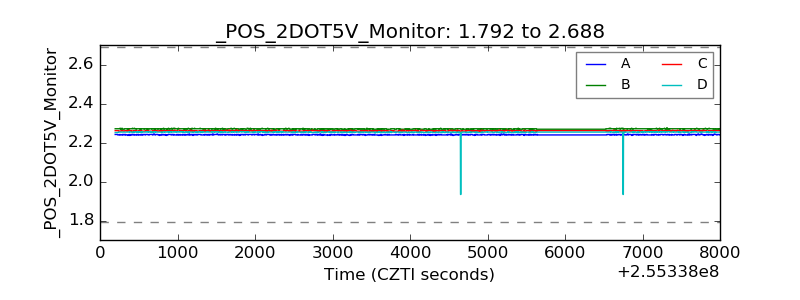 |
| +5 Volts monitor |  |
| _ROLL_ROT | 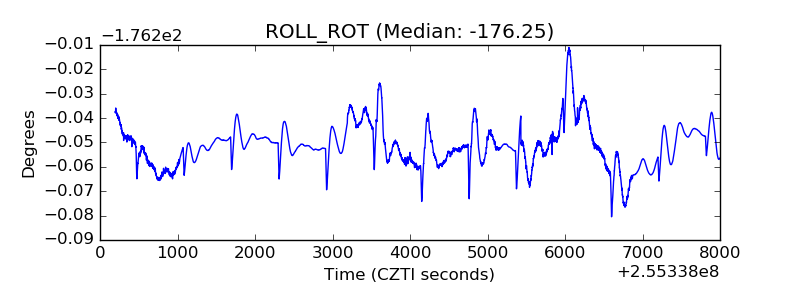 |
| _Roll_DEC | 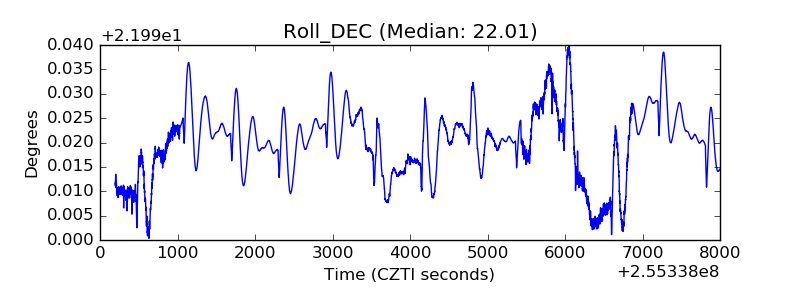 |
| _Roll_RA | 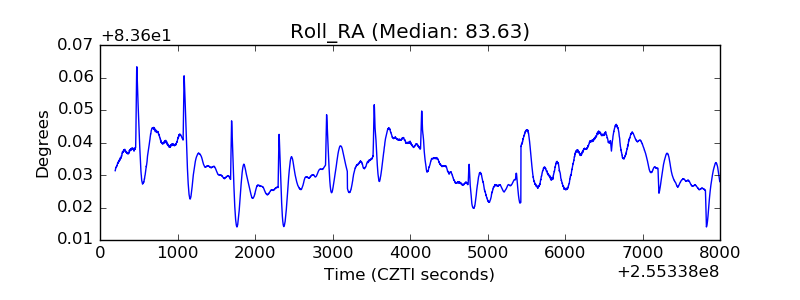 |
| Veto Counter | 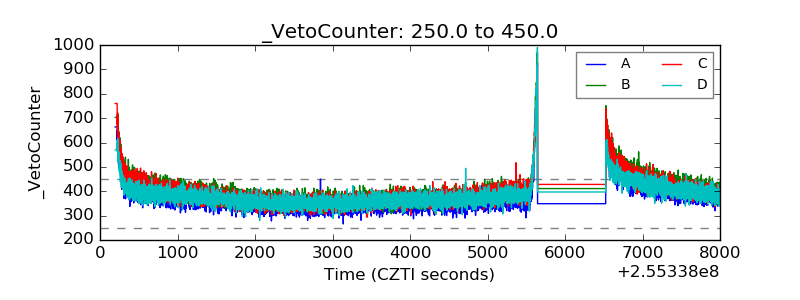 |