| Param | Original file | Final file |
|---|---|---|
| Filename | modeM0/AS1A04_174T01_9000001876_12718cztM0_level2.evt | modeM0/AS1A04_174T01_9000001876_12718cztM0_level2_quad_clean.evt |
| Size (bytes) | 539,858,880 | 87,583,680 |
| Size | 514.8 MB | 83.5 MB |
| Events in quadrant A | 3,483,736 | 572,614 |
| Events in quadrant B | 6,011,642 | 498,623 |
| Events in quadrant C | 3,154,567 | 571,986 |
| Events in quadrant D | 3,251,622 | 548,264 |
| Mode M9 | |||
|---|---|---|---|
| Quadrant | BADHDUFLAG | Total packets | Discarded packets |
| A | 0 | 11 | 0 |
| B | 0 | 11 | 0 |
| C | 0 | 11 | 0 |
| D | 0 | 11 | 0 |
| Mode M0 | |||
|---|---|---|---|
| Quadrant | BADHDUFLAG | Total packets | Discarded packets |
| A | 0 | 14297 | 3 |
| B | 0 | 22117 | 2 |
| C | 0 | 13533 | 2 |
| D | 0 | 13967 | 2 |
| Mode SS | |||
|---|---|---|---|
| Quadrant | BADHDUFLAG | Total packets | Discarded packets |
| A | 0 | 132 | 0 |
| B | 0 | 132 | 0 |
| C | 0 | 132 | 0 |
| D | 0 | 132 | 0 |
| Quadrant | Total seconds | Saturated seconds | Saturation percentage |
|---|---|---|---|
| A | 6608 | 76 | 1.150121% |
| B | 6608 | 1095 | 16.570823% |
| C | 6608 | 40 | 0.605327% |
| D | 6609 | 45 | 0.680890% |
Noise dominated data is calculated using 1-second bins in cleaned event files. If a bin has >2000 counts, and if more than 50% of those come from <1% of pixels, then it is considered to be noise-dominated and hence unusable.
| Quadrant | # 1 sec bins | Bins with >0 counts | Bins with >2000 counts | High rate bins dominated by noise | Noise dominated (total time) | Noise dominated (detector-on time) | Marked lightcurve |
|---|---|---|---|---|---|---|---|
| A | 7649 | 6610 | 29 | 29 | 0.38% | 0.44% | 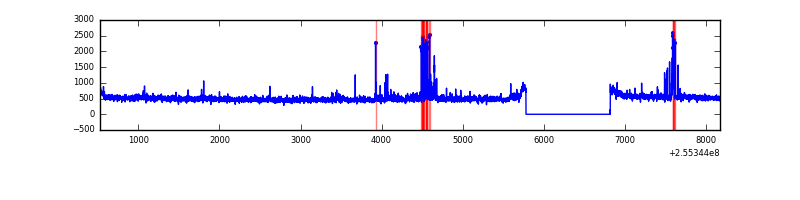 |
| B | 7649 | 6610 | 806 | 806 | 10.54% | 12.19% | 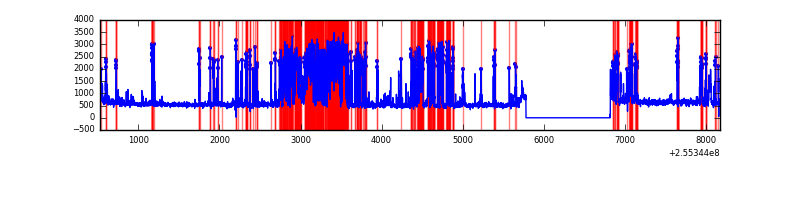 |
| C | 7649 | 6610 | 0 | 0 | 0.00% | 0.00% | 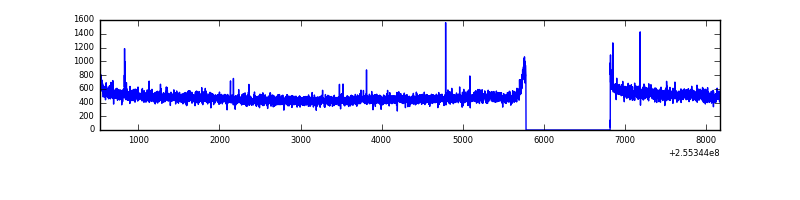 |
| D | 7650 | 6611 | 8 | 8 | 0.10% | 0.12% | 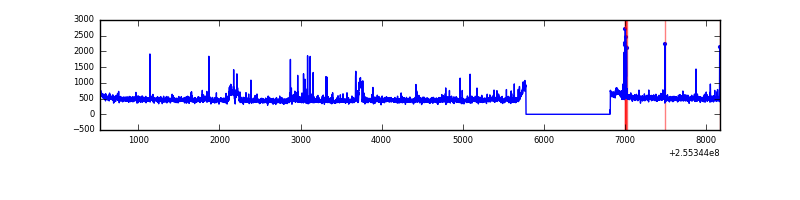 |
Top three noisy pixels from each quadrant. If the there are fewer than three noisy pixels in the level2.evt file, extra rows are filled as -1
| Pixel properties | Quadrant properties | ||||||
|---|---|---|---|---|---|---|---|
| Quadrant | DetID | PixID | Counts | Sigma | Mean | Median | Sigma |
| A | 15 | 239 | 127999 | 751.53 | 837 | 822 | 169.2 |
| A | 12 | 189 | 73652 | 430.37 | 837 | 822 | 169.2 |
| A | 11 | 29 | 58222 | 339.19 | 837 | 822 | 169.2 |
| B | 4 | 239 | 2664280 | 18226.96 | 766 | 749 | 146.1 |
| B | 4 | 206 | 246346 | 1680.66 | 766 | 749 | 146.1 |
| B | 3 | 64 | 49420 | 333.06 | 766 | 749 | 146.1 |
| C | 15 | 208 | 10993 | 54.67 | 805 | 813 | 186.2 |
| C | 13 | 61 | 5707 | 26.28 | 805 | 813 | 186.2 |
| C | 14 | 234 | 4204 | 18.21 | 805 | 813 | 186.2 |
| D | 1 | 52 | 140935 | 734.7 | 803 | 784 | 190.8 |
| D | 10 | 199 | 25157 | 127.77 | 803 | 784 | 190.8 |
| D | 2 | 234 | 23172 | 117.36 | 803 | 784 | 190.8 |
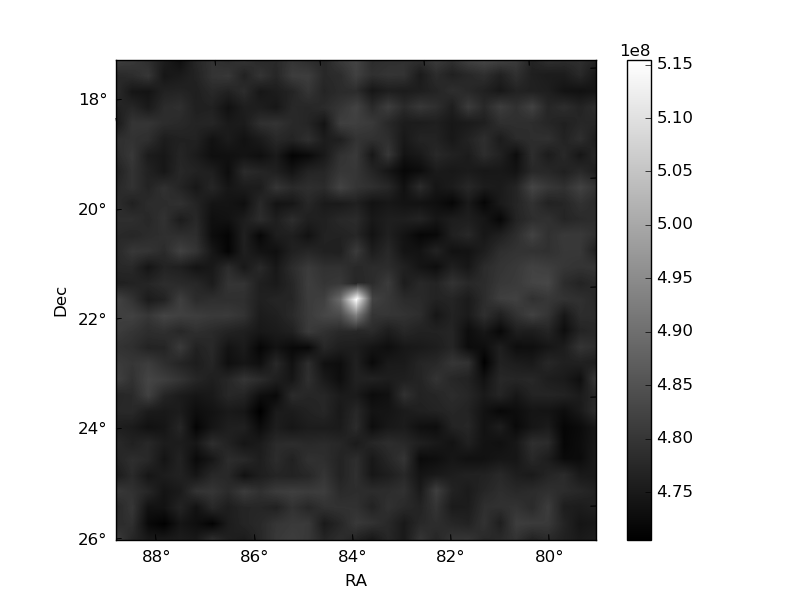
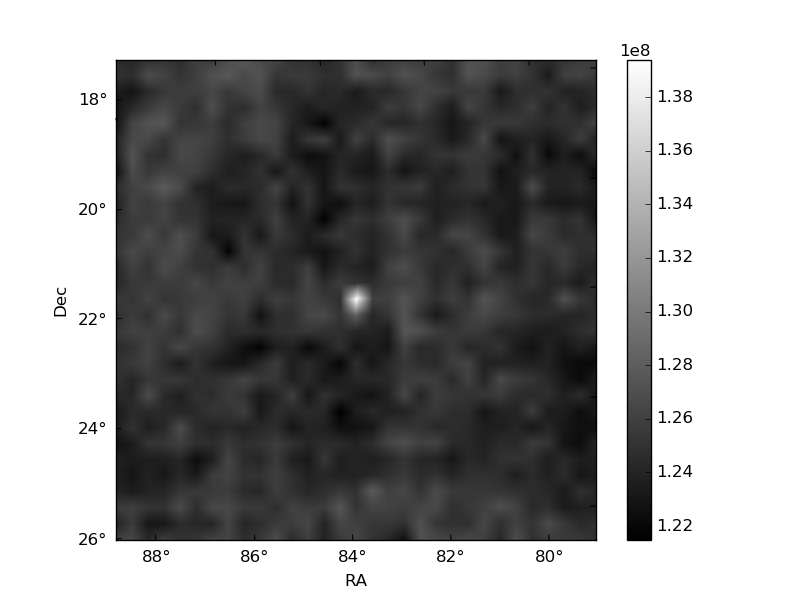
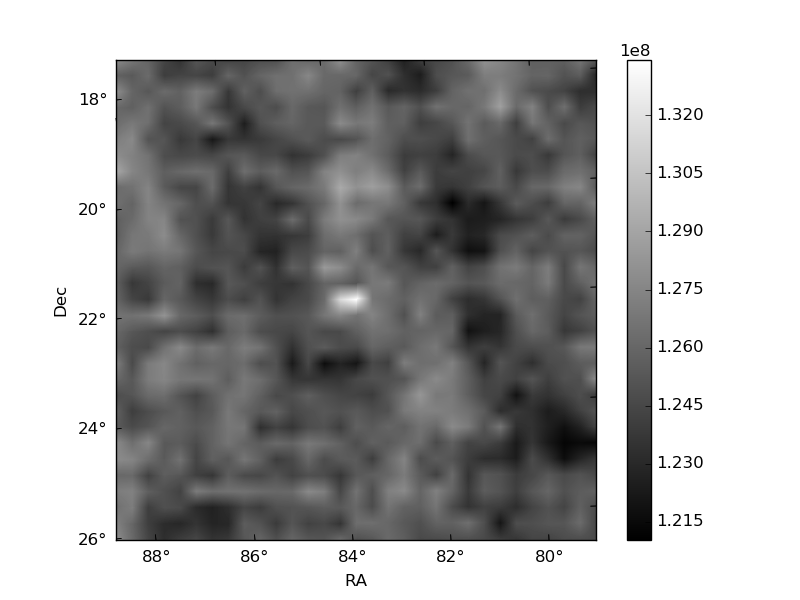
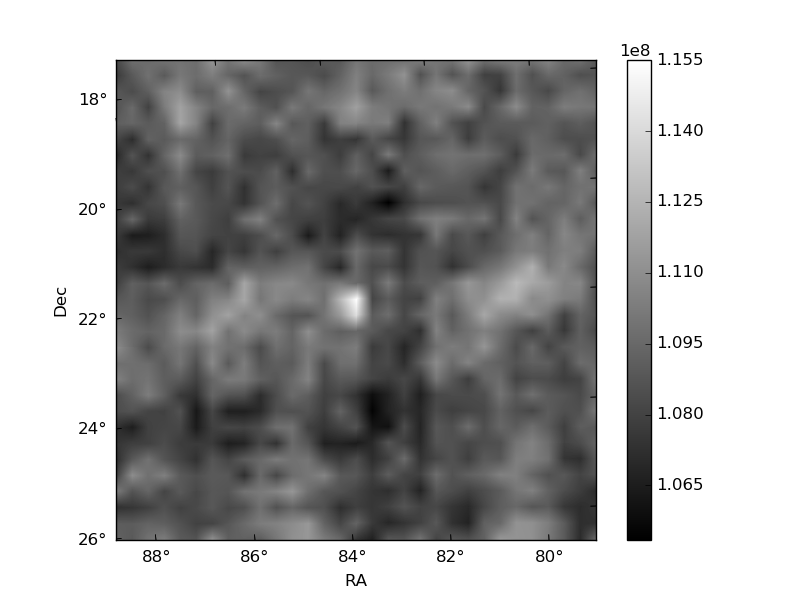
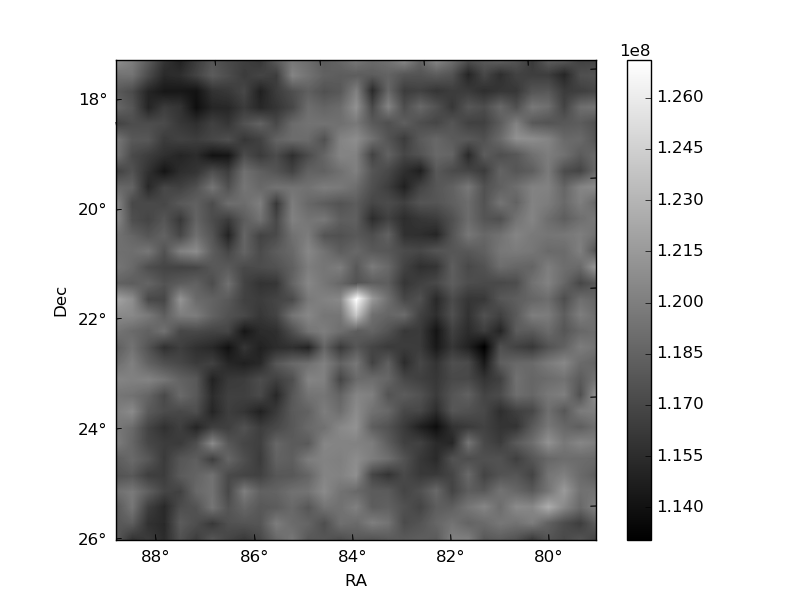
Histogram calculated using DETX and DETY for each event in the final _common_clean file
| Quadrant A | 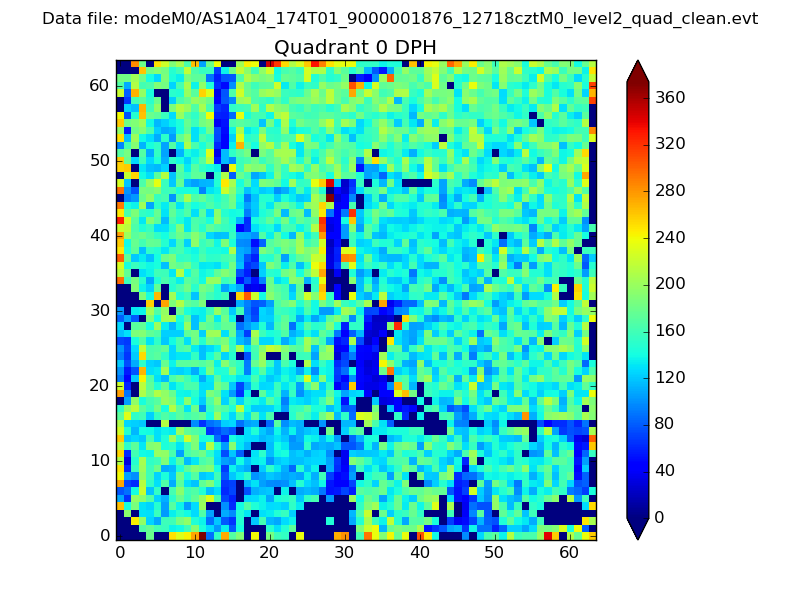 |
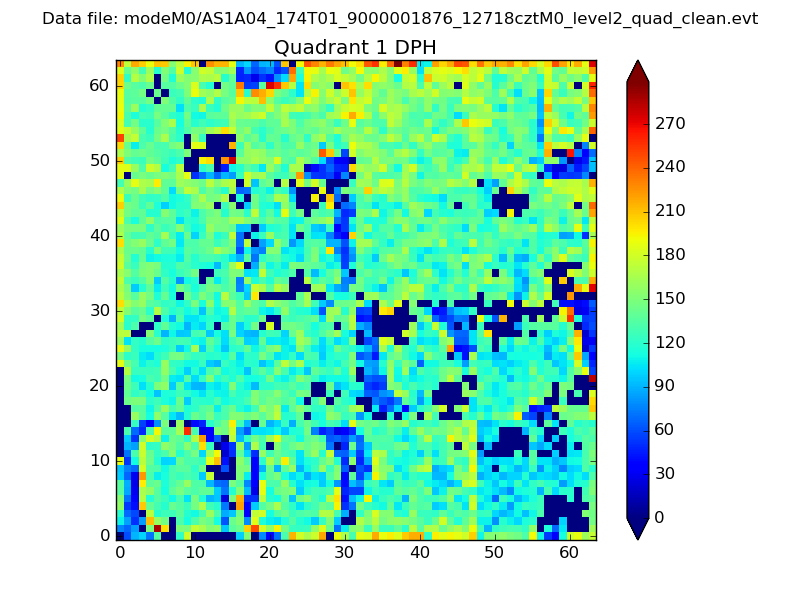 |
Quadrant B |
|---|---|---|---|
| Quadrant D | 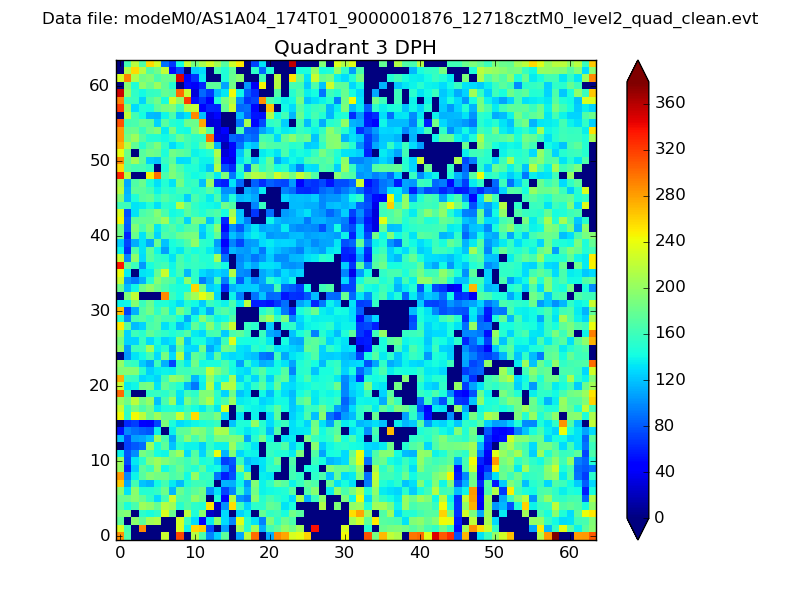 |
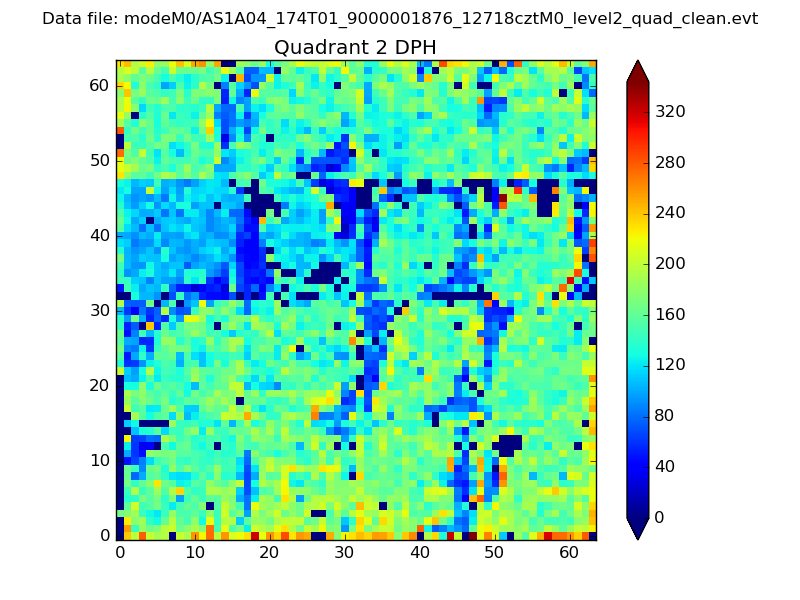 |
Quadrant C |
| Plot type | Count rate plots | Images |
|---|---|---|
| Comparison with Poisson distribution Blue bars denote a histogram of data divided into 1 sec bins. Red curve is a Poisson curve with rate = median count rate of data. |
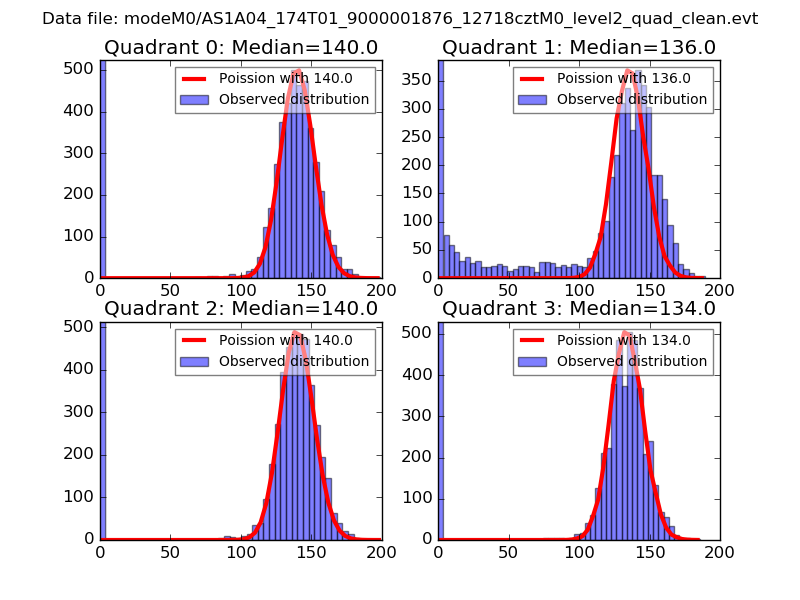 |
 |
| Quadrant-wise count rates Data is divided into 100 sec bins |
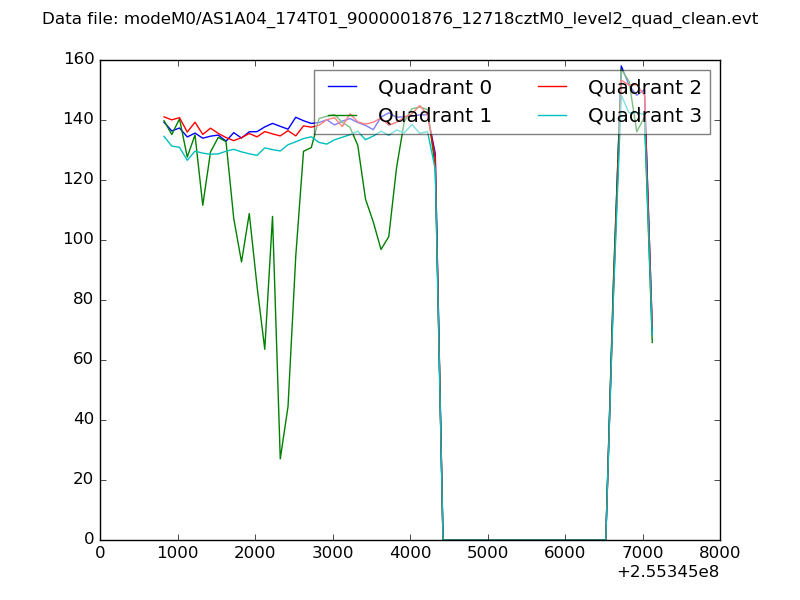 |
|
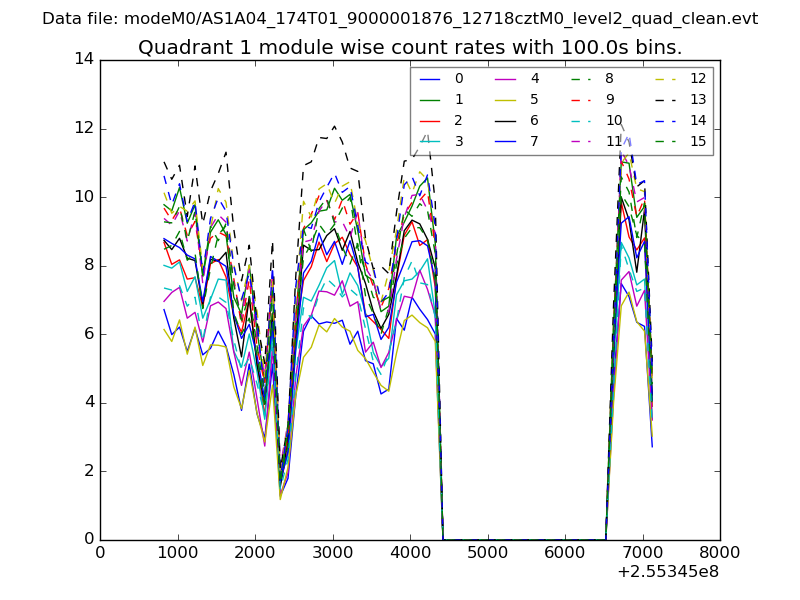
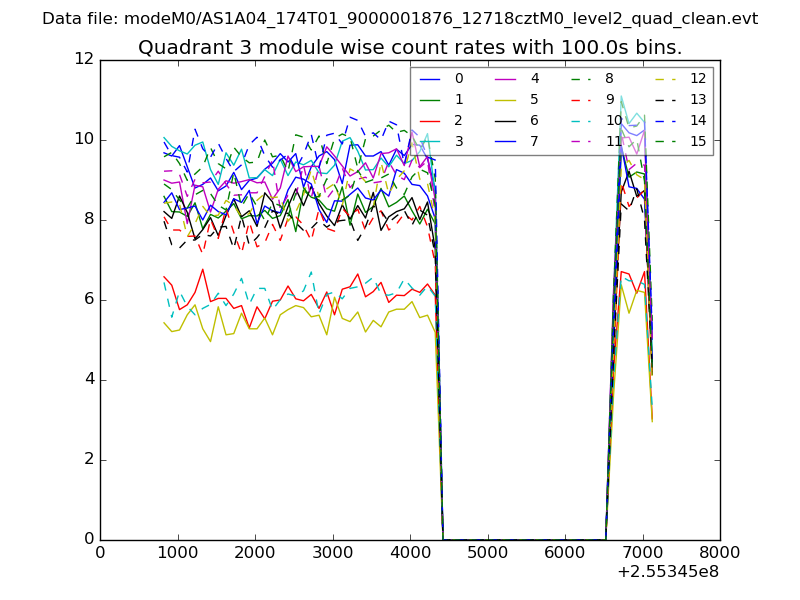
| Module-wise count rates for Quadrant A Data is divided into 100 sec bins |
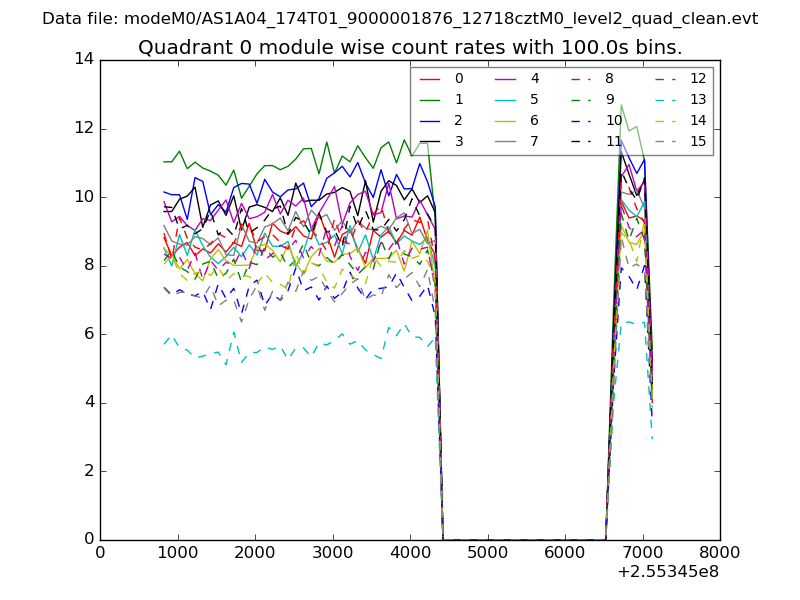 |
 |
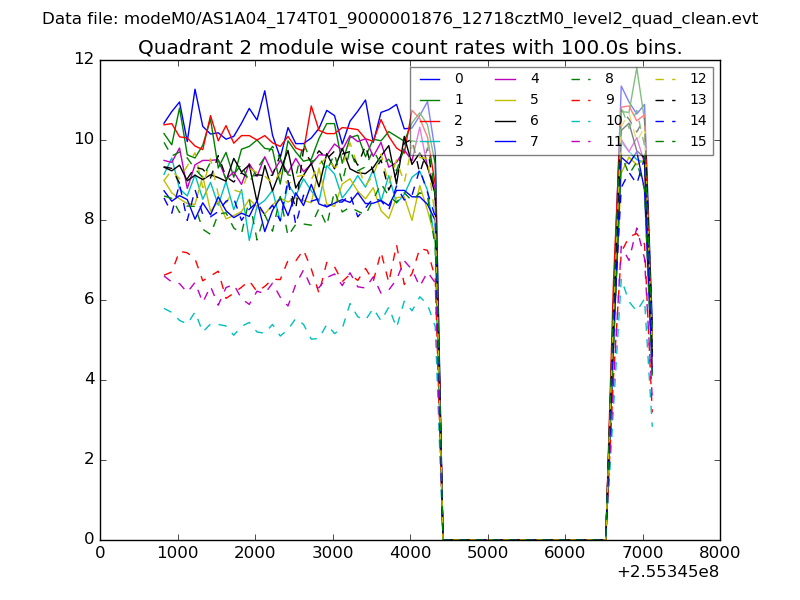
| Module-wise count rates for Quadrant B Data is divided into 100 sec bins |
 |
 |
| Module-wise count rates for Quadrant C Data is divided into 100 sec bins |
 |
 |
| Module-wise count rates for Quadrant D Data is divided into 100 sec bins |
 |
 |
| Parameter | Plot |
|---|---|
| CZT HV Monitor | 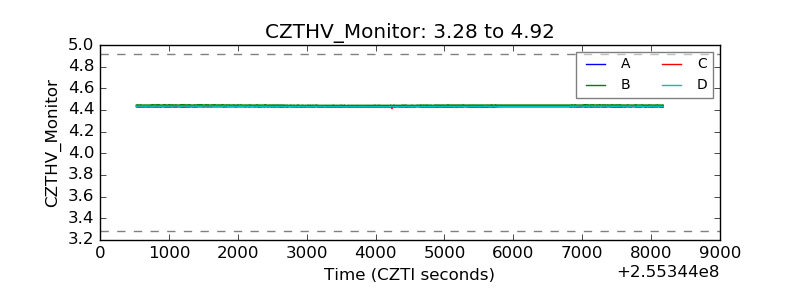 |
| D_VDD | 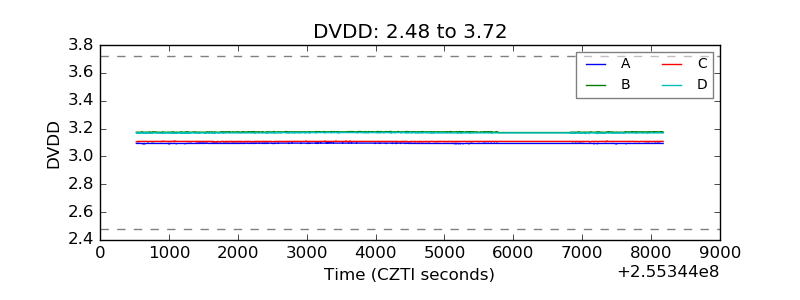 |
| Temperature 1 | 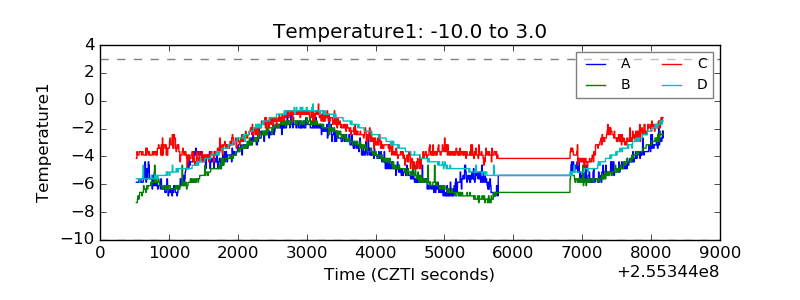 |
| Veto HV Monitor | 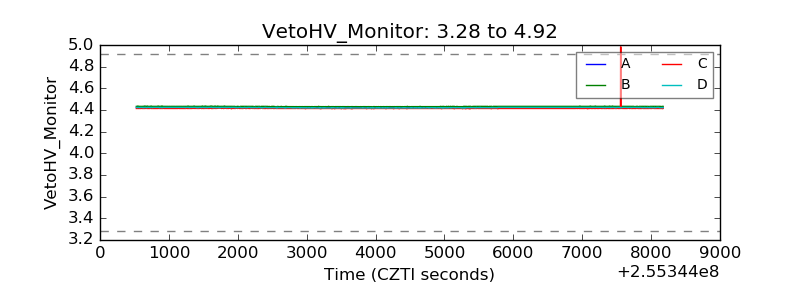 |
| Veto LLD | 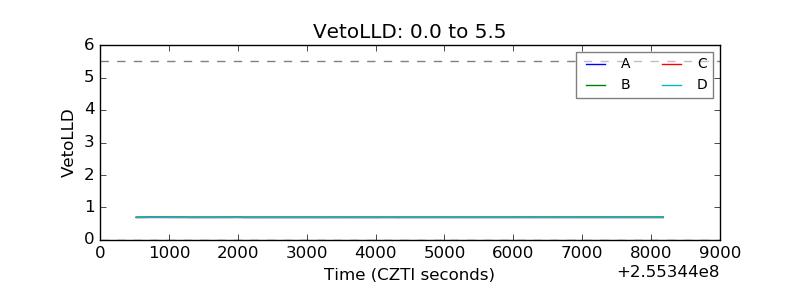 |
| Alpha Counter | 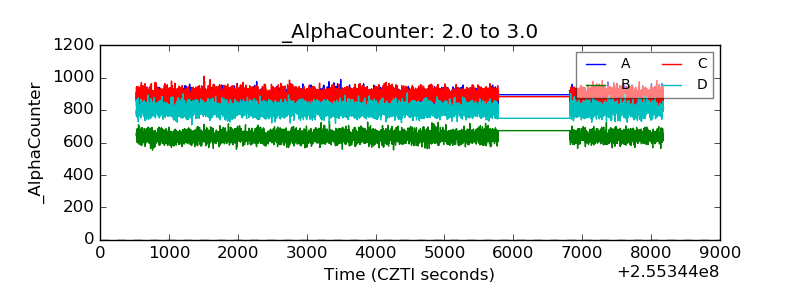 |
| _CPM_Rate | 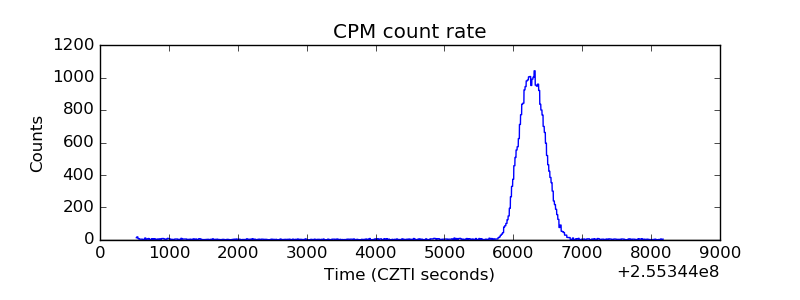 |
| CZT Counter | 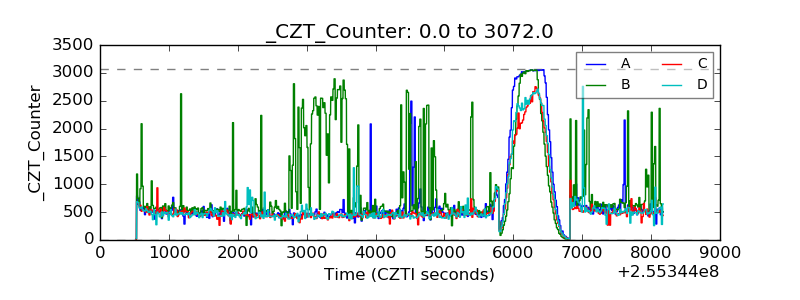 |
| +2.5 Volts monitor |  |
| +5 Volts monitor |  |
| _ROLL_ROT |  |
| _Roll_DEC | 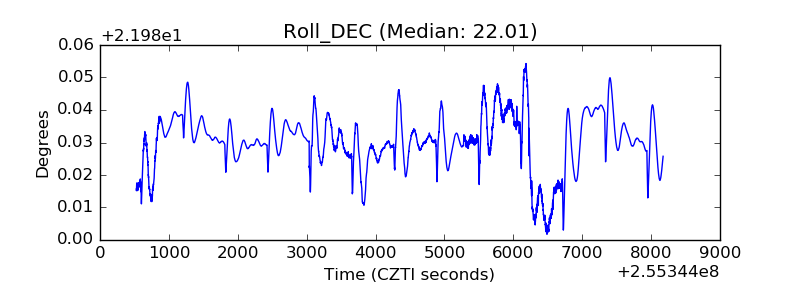 |
| _Roll_RA | 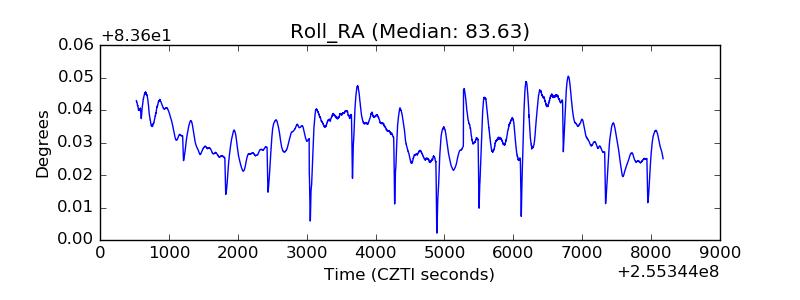 |
| Veto Counter | 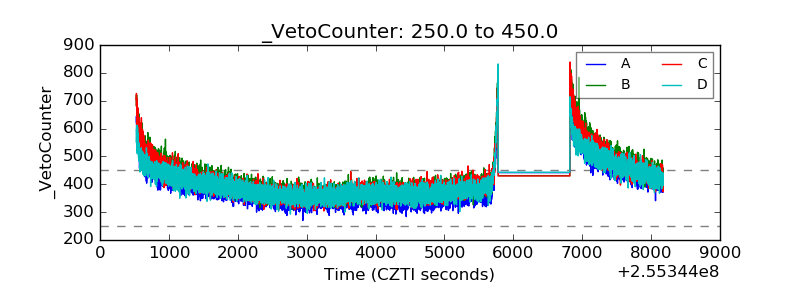 |