| Param | Original file | Final file |
|---|---|---|
| Filename | modeM0/AS1A04_174T01_9000001876_12722cztM0_level2.evt | modeM0/AS1A04_174T01_9000001876_12722cztM0_level2_quad_clean.evt |
| Size (bytes) | 682,093,440 | 113,771,520 |
| Size | 650.5 MB | 108.5 MB |
| Events in quadrant A | 7,638,274 | 736,423 |
| Events in quadrant B | 5,650,338 | 706,130 |
| Events in quadrant C | 3,289,335 | 791,145 |
| Events in quadrant D | 3,649,271 | 767,550 |
| Mode M9 | |||
|---|---|---|---|
| Quadrant | BADHDUFLAG | Total packets | Discarded packets |
| A | 0 | 12 | 0 |
| B | 0 | 12 | 0 |
| C | 0 | 12 | 0 |
| D | 0 | 12 | 0 |
| Mode M0 | |||
|---|---|---|---|
| Quadrant | BADHDUFLAG | Total packets | Discarded packets |
| A | 0 | 27192 | 2 |
| B | 0 | 21036 | 1 |
| C | 0 | 13681 | 1 |
| D | 0 | 14875 | 1 |
| Mode SS | |||
|---|---|---|---|
| Quadrant | BADHDUFLAG | Total packets | Discarded packets |
| A | 0 | 130 | 0 |
| B | 0 | 130 | 0 |
| C | 0 | 130 | 0 |
| D | 0 | 130 | 0 |
| Quadrant | Total seconds | Saturated seconds | Saturation percentage |
|---|---|---|---|
| A | 6354 | 1362 | 21.435316% |
| B | 6354 | 1091 | 17.170286% |
| C | 6354 | 50 | 0.786906% |
| D | 6354 | 155 | 2.439408% |
Noise dominated data is calculated using 1-second bins in cleaned event files. If a bin has >2000 counts, and if more than 50% of those come from <1% of pixels, then it is considered to be noise-dominated and hence unusable.
| Quadrant | # 1 sec bins | Bins with >0 counts | Bins with >2000 counts | High rate bins dominated by noise | Noise dominated (total time) | Noise dominated (detector-on time) | Marked lightcurve |
|---|---|---|---|---|---|---|---|
| A | 7635 | 6356 | 1299 | 1299 | 17.01% | 20.44% | 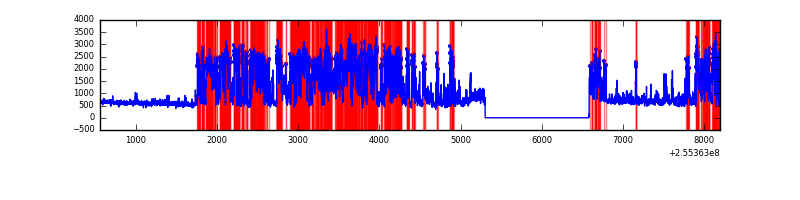 |
| B | 7635 | 6356 | 734 | 734 | 9.61% | 11.55% | 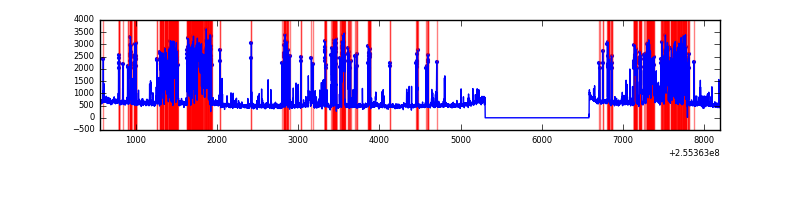 |
| C | 7635 | 6356 | 2 | 2 | 0.03% | 0.03% | 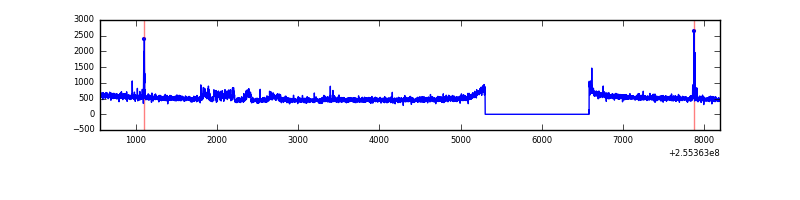 |
| D | 7635 | 6356 | 72 | 72 | 0.94% | 1.13% | 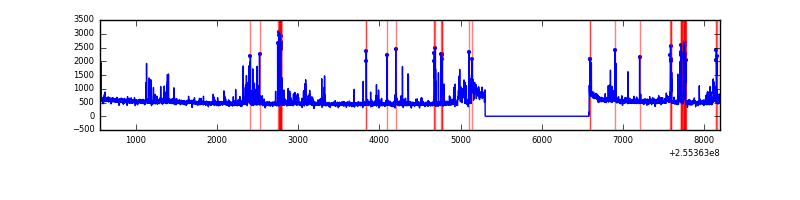 |
Top three noisy pixels from each quadrant. If the there are fewer than three noisy pixels in the level2.evt file, extra rows are filled as -1
| Pixel properties | Quadrant properties | ||||||
|---|---|---|---|---|---|---|---|
| Quadrant | DetID | PixID | Counts | Sigma | Mean | Median | Sigma |
| A | 15 | 239 | 4229706 | 26604.07 | 792 | 782 | 159.0 |
| A | 8 | 15 | 287557 | 1804.1 | 792 | 782 | 159.0 |
| A | 12 | 189 | 57738 | 358.31 | 792 | 782 | 159.0 |
| B | 4 | 239 | 2471797 | 17341.58 | 760 | 744 | 142.5 |
| B | 3 | 209 | 67126 | 465.86 | 760 | 744 | 142.5 |
| B | 0 | 219 | 65659 | 455.57 | 760 | 744 | 142.5 |
| C | 15 | 208 | 117588 | 629.03 | 809 | 818 | 185.6 |
| C | 9 | 221 | 15296 | 77.99 | 809 | 818 | 185.6 |
| C | 13 | 61 | 5940 | 27.59 | 809 | 818 | 185.6 |
| D | 1 | 52 | 373914 | 1948.11 | 813 | 796 | 191.5 |
| D | 13 | 104 | 124410 | 645.41 | 813 | 796 | 191.5 |
| D | 10 | 199 | 40992 | 209.87 | 813 | 796 | 191.5 |
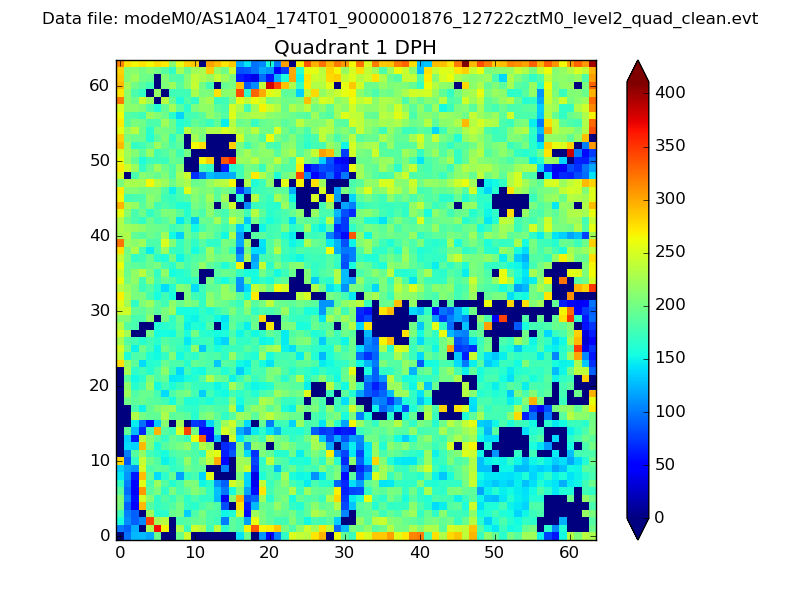
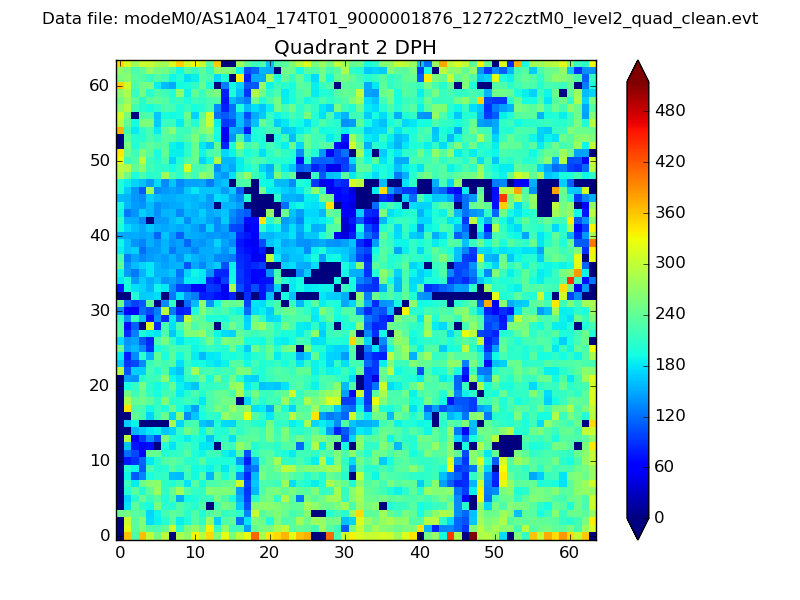
Histogram calculated using DETX and DETY for each event in the final _common_clean file
| Quadrant A |  |
 |
Quadrant B |
|---|---|---|---|
| Quadrant D | 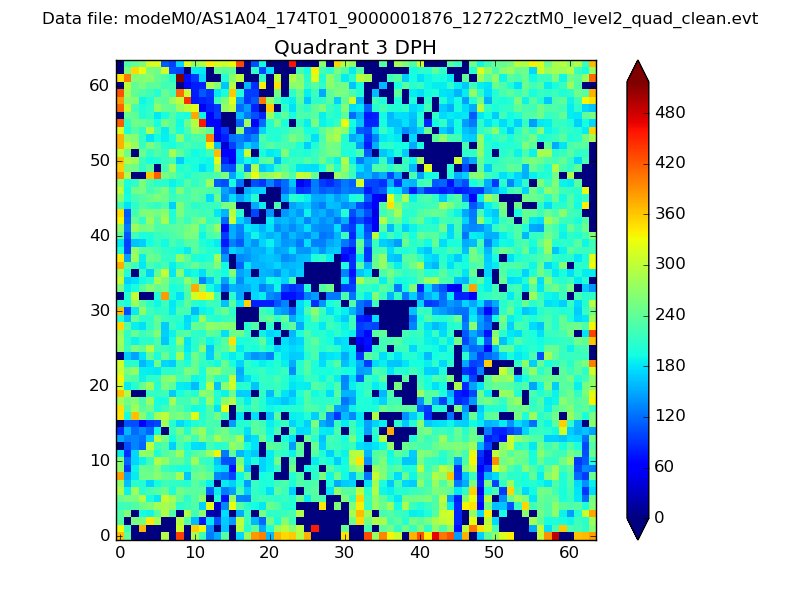 |
 |
Quadrant C |
| Plot type | Count rate plots | Images |
|---|---|---|
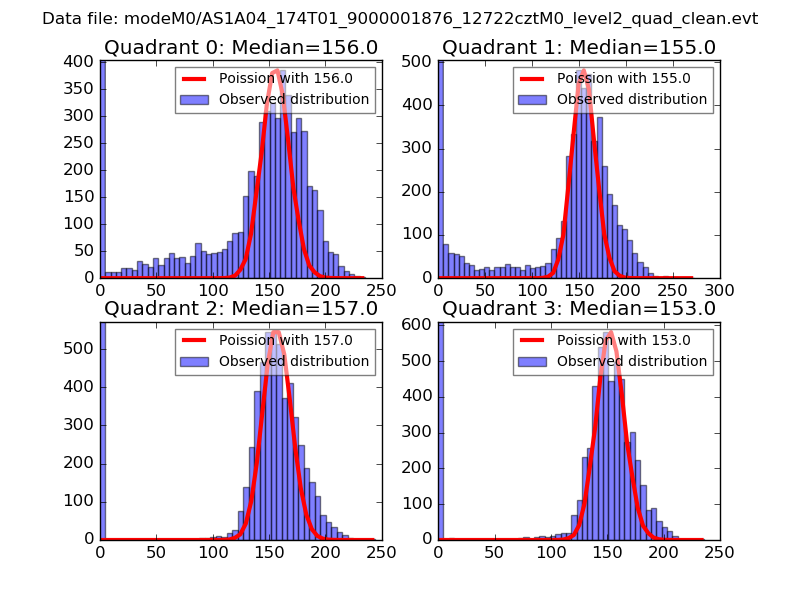
| Comparison with Poisson distribution Blue bars denote a histogram of data divided into 1 sec bins. Red curve is a Poisson curve with rate = median count rate of data. |
 |
 |
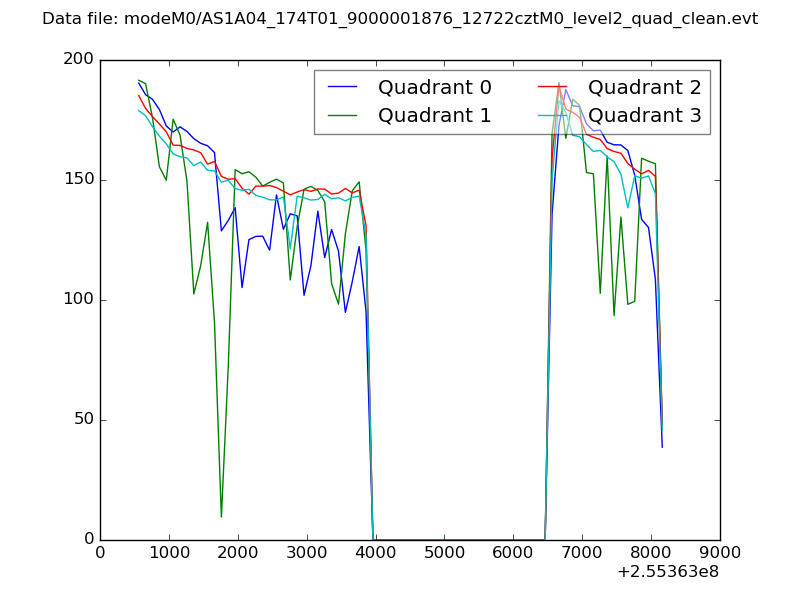
| Quadrant-wise count rates Data is divided into 100 sec bins |
 |
|
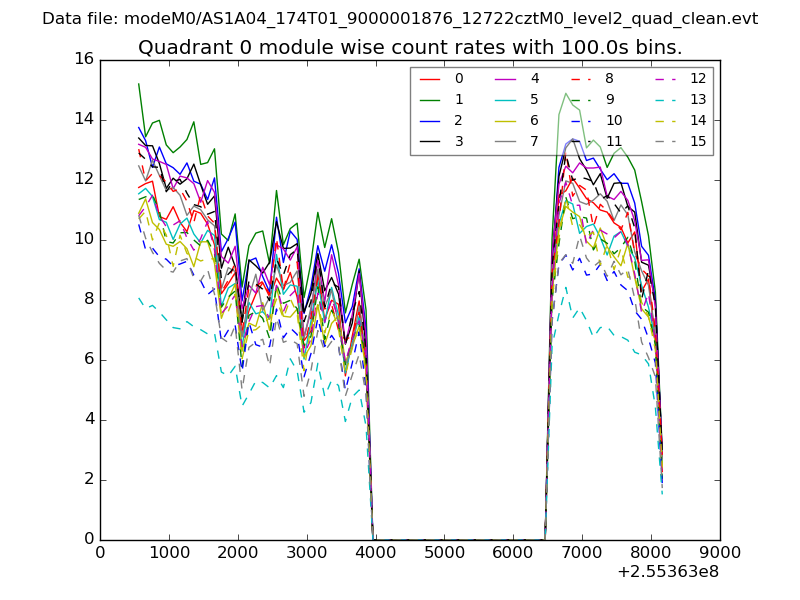
| Module-wise count rates for Quadrant A Data is divided into 100 sec bins |
 |
 |
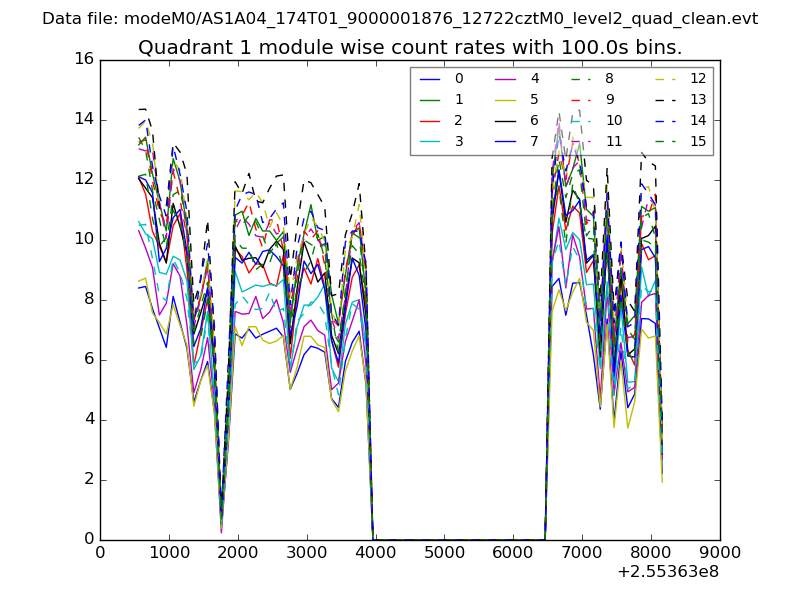
| Module-wise count rates for Quadrant B Data is divided into 100 sec bins |
 |
 |
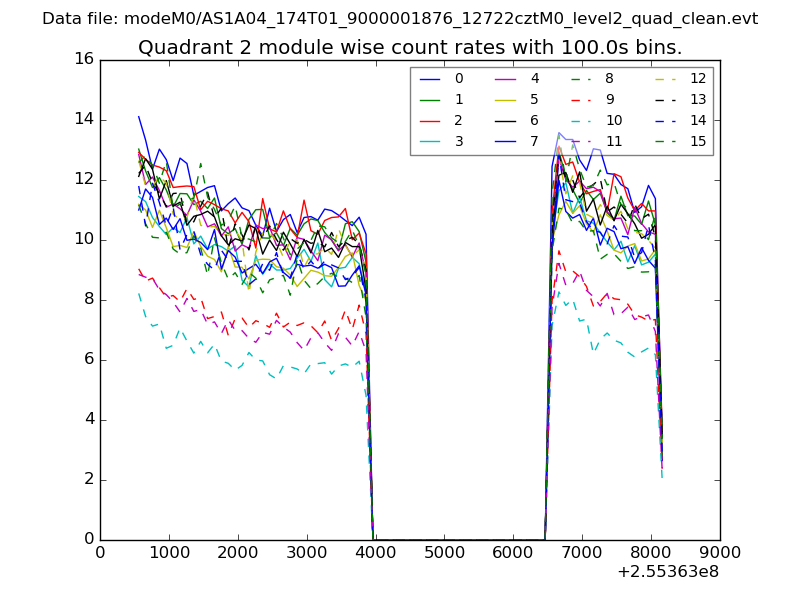
| Module-wise count rates for Quadrant C Data is divided into 100 sec bins |
 |
 |
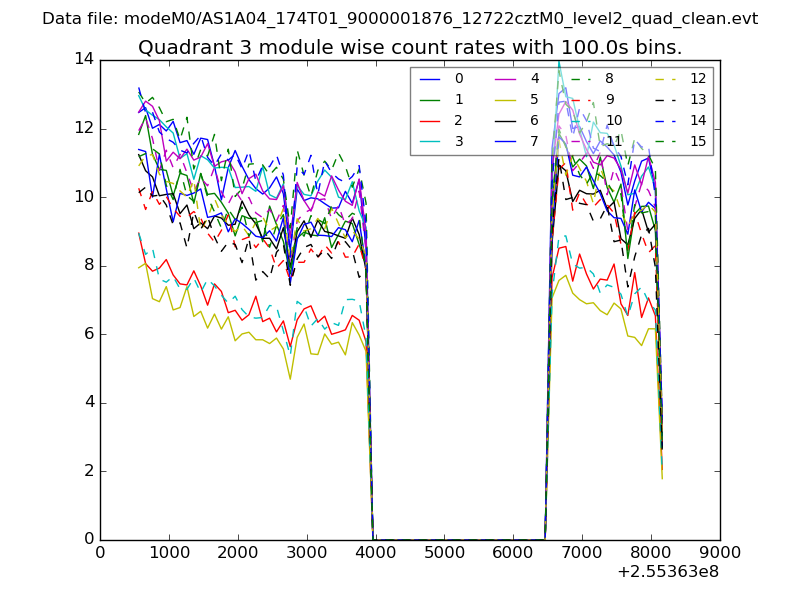
| Module-wise count rates for Quadrant D Data is divided into 100 sec bins |
 |
 |
| Parameter | Plot |
|---|---|
| CZT HV Monitor | 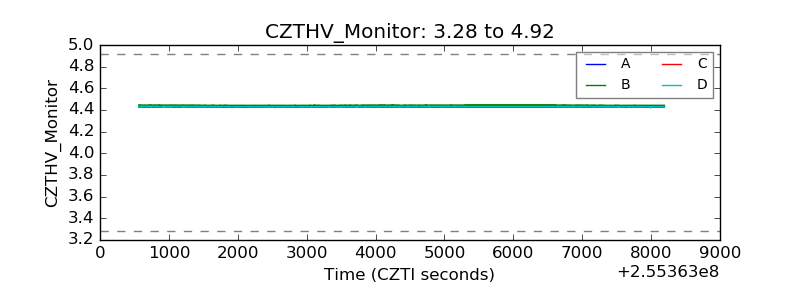 |
| D_VDD | 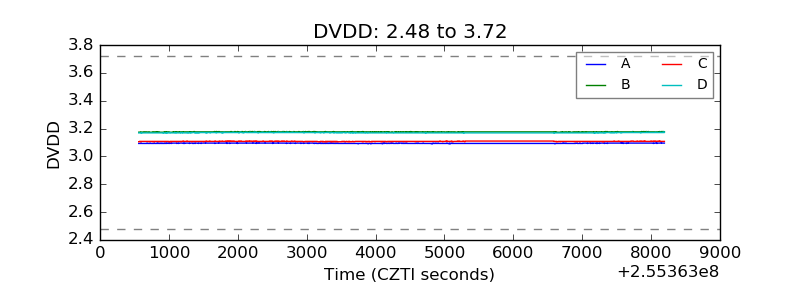 |
| Temperature 1 | 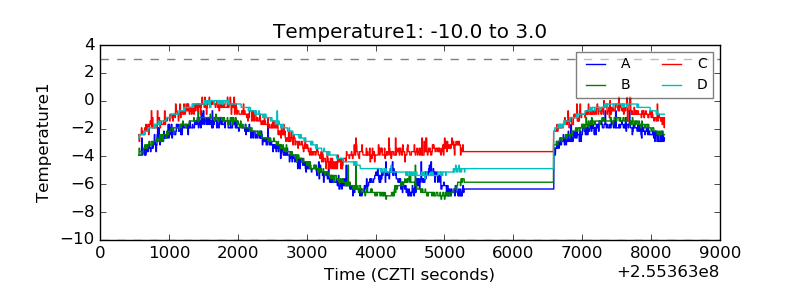 |
| Veto HV Monitor | 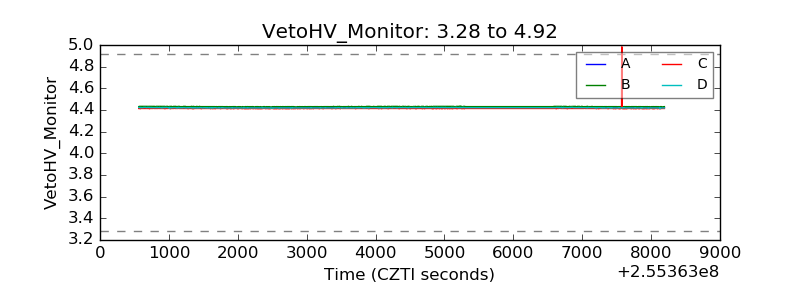 |
| Veto LLD | 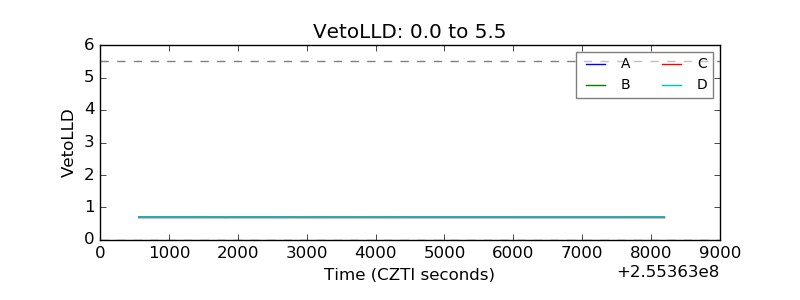 |
| Alpha Counter | 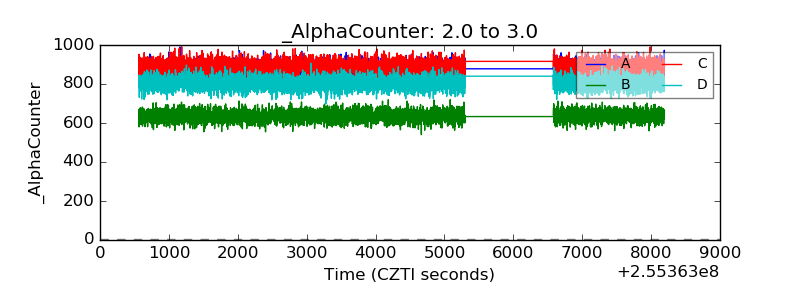 |
| _CPM_Rate | 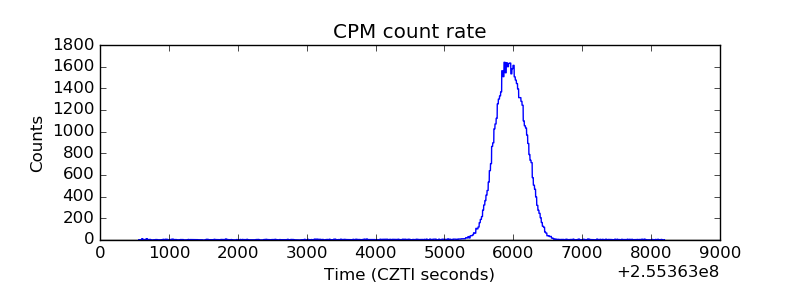 |
| CZT Counter | 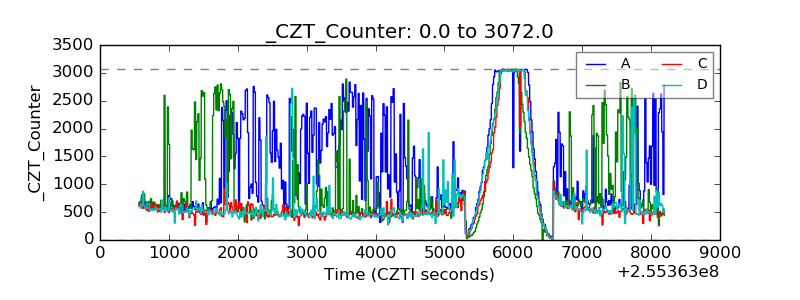 |
| +2.5 Volts monitor | 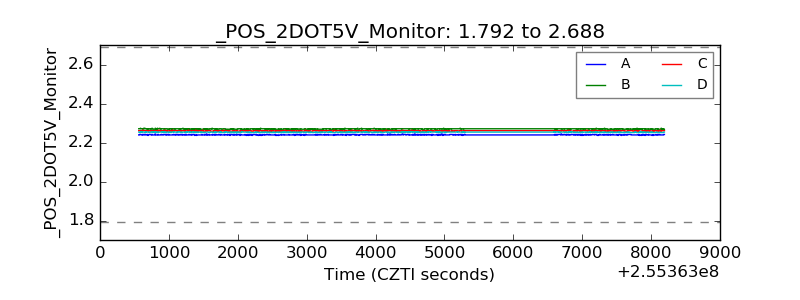 |
| +5 Volts monitor |  |
| _ROLL_ROT | 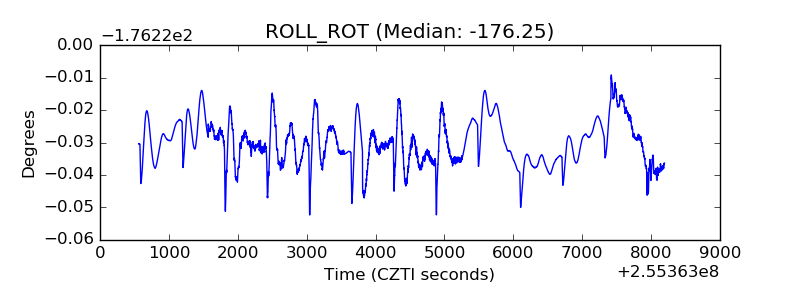 |
| _Roll_DEC | 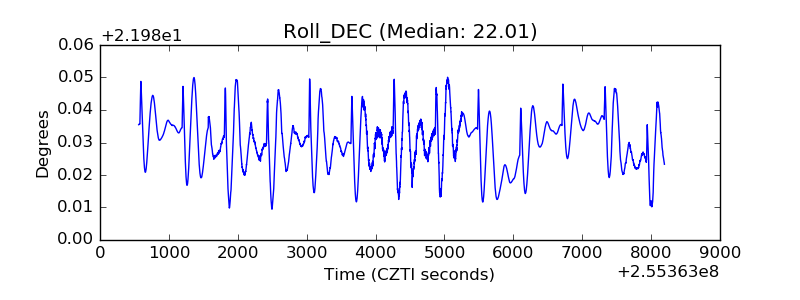 |
| _Roll_RA | 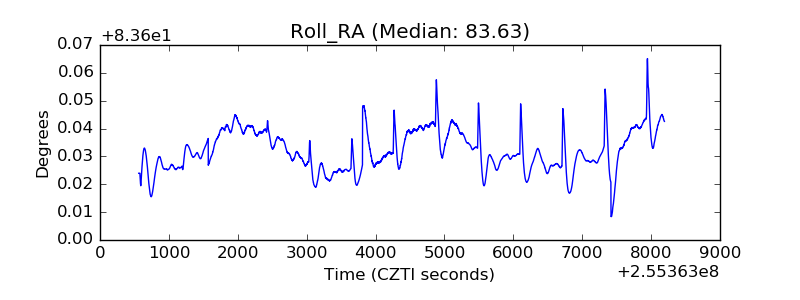 |
| Veto Counter | 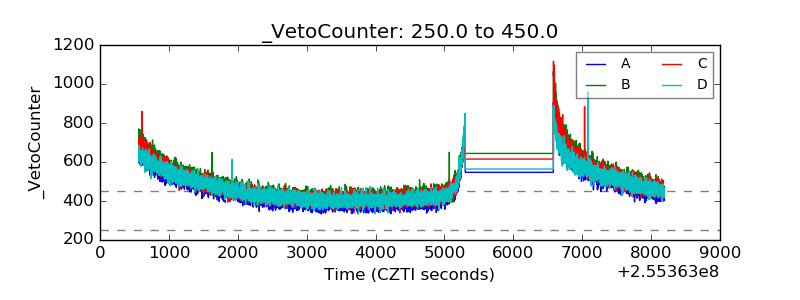 |