| Param | Original file | Final file |
|---|---|---|
| Filename | modeM0/AS1A04_174T01_9000001876_12723cztM0_level2.evt | modeM0/AS1A04_174T01_9000001876_12723cztM0_level2_quad_clean.evt |
| Size (bytes) | 267,238,080 | 48,600,000 |
| Size | 254.9 MB | 46.3 MB |
| Events in quadrant A | 3,040,198 | 308,251 |
| Events in quadrant B | 2,092,153 | 316,885 |
| Events in quadrant C | 1,095,126 | 349,120 |
| Events in quadrant D | 1,707,816 | 330,674 |
| Mode M0 | |||
|---|---|---|---|
| Quadrant | BADHDUFLAG | Total packets | Discarded packets |
| A | 0 | 10641 | 0 |
| B | 0 | 7712 | 0 |
| C | 0 | 4673 | 0 |
| D | 0 | 6555 | 0 |
| Mode SS | |||
|---|---|---|---|
| Quadrant | BADHDUFLAG | Total packets | Discarded packets |
| A | 0 | 46 | 0 |
| B | 0 | 46 | 0 |
| C | 0 | 46 | 0 |
| D | 0 | 46 | 0 |
| Quadrant | Total seconds | Saturated seconds | Saturation percentage |
|---|---|---|---|
| A | 2305 | 608 | 26.377440% |
| B | 2305 | 387 | 16.789588% |
| C | 2305 | 3 | 0.130152% |
| D | 2305 | 148 | 6.420824% |
Noise dominated data is calculated using 1-second bins in cleaned event files. If a bin has >2000 counts, and if more than 50% of those come from <1% of pixels, then it is considered to be noise-dominated and hence unusable.
| Quadrant | # 1 sec bins | Bins with >0 counts | Bins with >2000 counts | High rate bins dominated by noise | Noise dominated (total time) | Noise dominated (detector-on time) | Marked lightcurve |
|---|---|---|---|---|---|---|---|
| A | 2306 | 2306 | 610 | 610 | 26.45% | 26.45% | 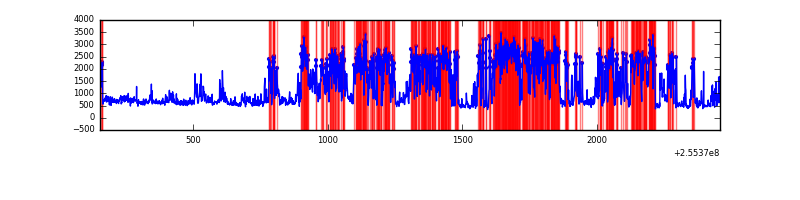 |
| B | 2306 | 2306 | 270 | 270 | 11.71% | 11.71% |  |
| C | 2306 | 2306 | 1 | 1 | 0.04% | 0.04% |  |
| D | 2306 | 2306 | 179 | 179 | 7.76% | 7.76% |  |
Top three noisy pixels from each quadrant. If the there are fewer than three noisy pixels in the level2.evt file, extra rows are filled as -1
| Pixel properties | Quadrant properties | ||||||
|---|---|---|---|---|---|---|---|
| Quadrant | DetID | PixID | Counts | Sigma | Mean | Median | Sigma |
| A | 15 | 239 | 2012101 | 37719.02 | 256 | 252 | 53.3 |
| A | 12 | 189 | 17178 | 317.34 | 256 | 252 | 53.3 |
| A | 15 | 174 | 11595 | 212.66 | 256 | 252 | 53.3 |
| B | 4 | 239 | 1027789 | 20447.0 | 255 | 251 | 50.3 |
| B | 3 | 209 | 22450 | 441.74 | 255 | 251 | 50.3 |
| B | 0 | 219 | 13376 | 261.17 | 255 | 251 | 50.3 |
| C | 9 | 221 | 13220 | 198.27 | 277 | 280 | 65.3 |
| C | 13 | 61 | 2072 | 27.46 | 277 | 280 | 65.3 |
| C | 8 | 222 | 1348 | 16.36 | 277 | 280 | 65.3 |
| D | 13 | 104 | 494296 | 7503.81 | 274 | 269 | 65.8 |
| D | 1 | 52 | 148746 | 2255.23 | 274 | 269 | 65.8 |
| D | 12 | 233 | 11053 | 163.8 | 274 | 269 | 65.8 |
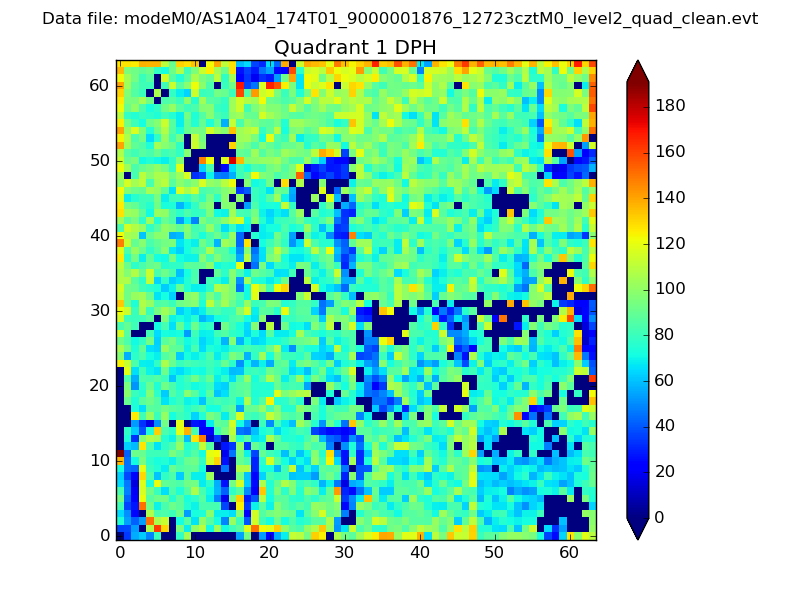
Histogram calculated using DETX and DETY for each event in the final _common_clean file
| Quadrant A | 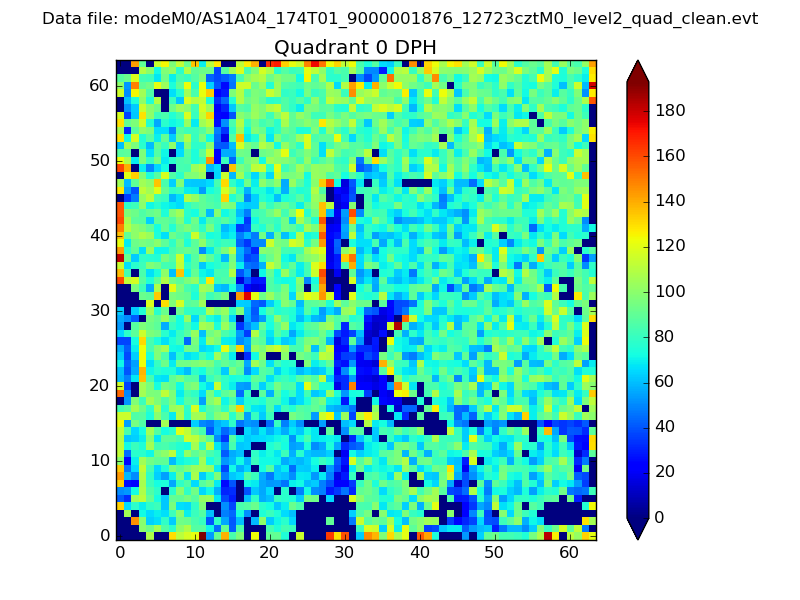 |
 |
Quadrant B |
|---|---|---|---|
| Quadrant D | 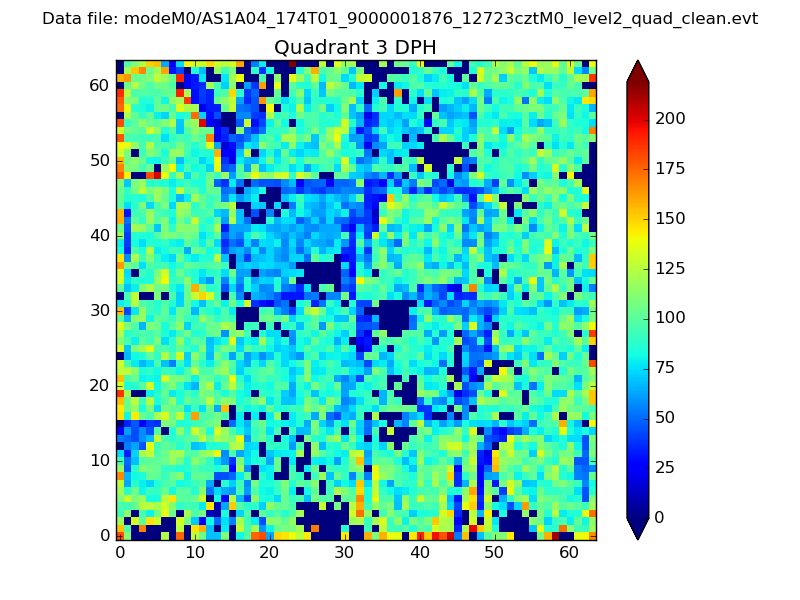 |
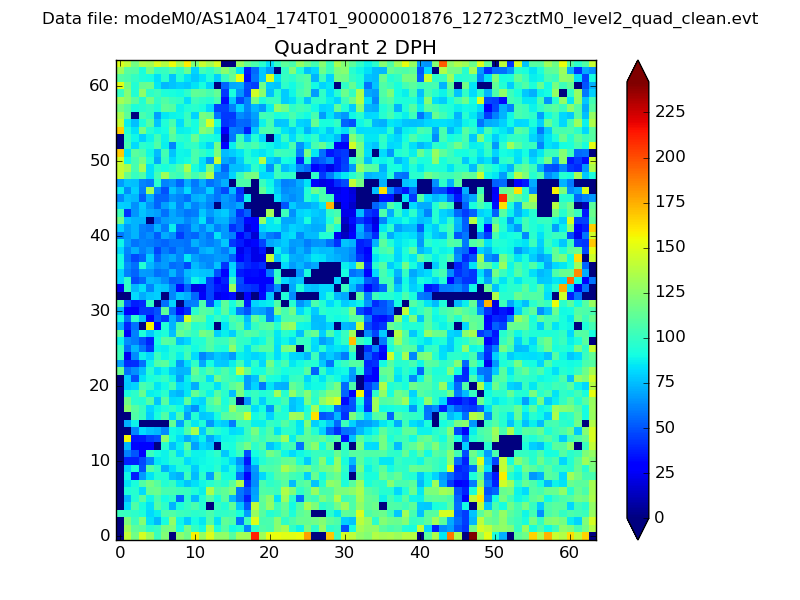 |
Quadrant C |
| Plot type | Count rate plots | Images |
|---|---|---|
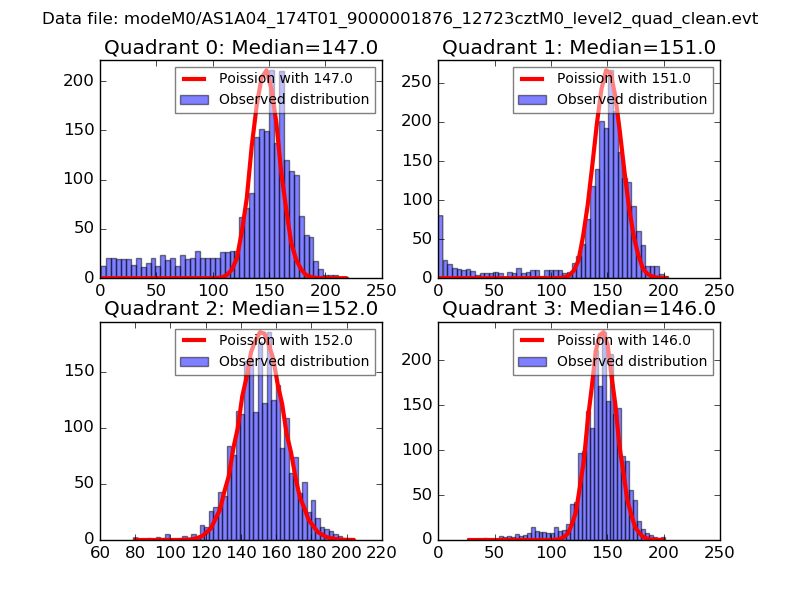
| Comparison with Poisson distribution Blue bars denote a histogram of data divided into 1 sec bins. Red curve is a Poisson curve with rate = median count rate of data. |
 |
 |
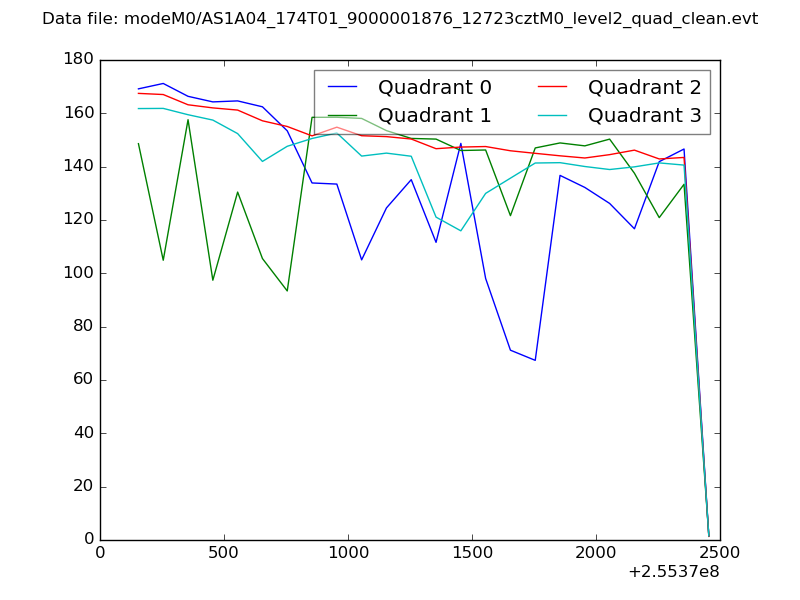
| Quadrant-wise count rates Data is divided into 100 sec bins |
 |
|
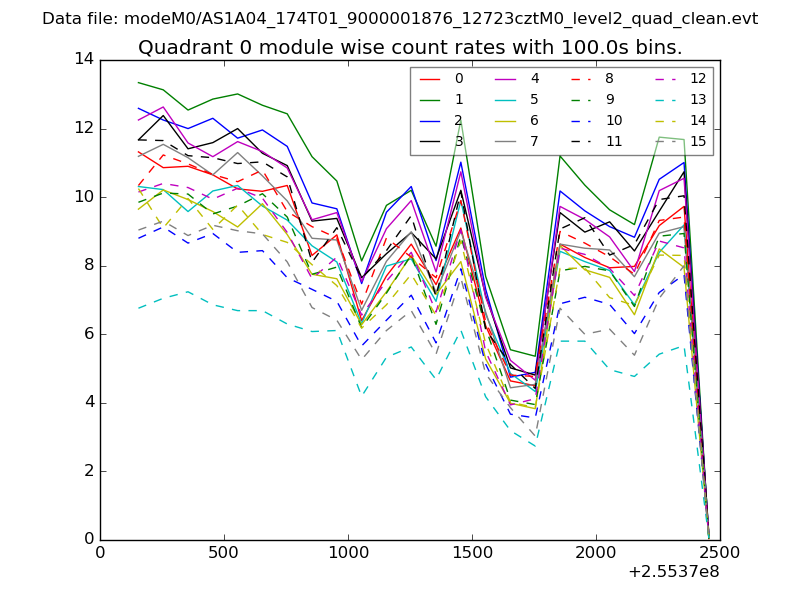
| Module-wise count rates for Quadrant A Data is divided into 100 sec bins |
 |
 |
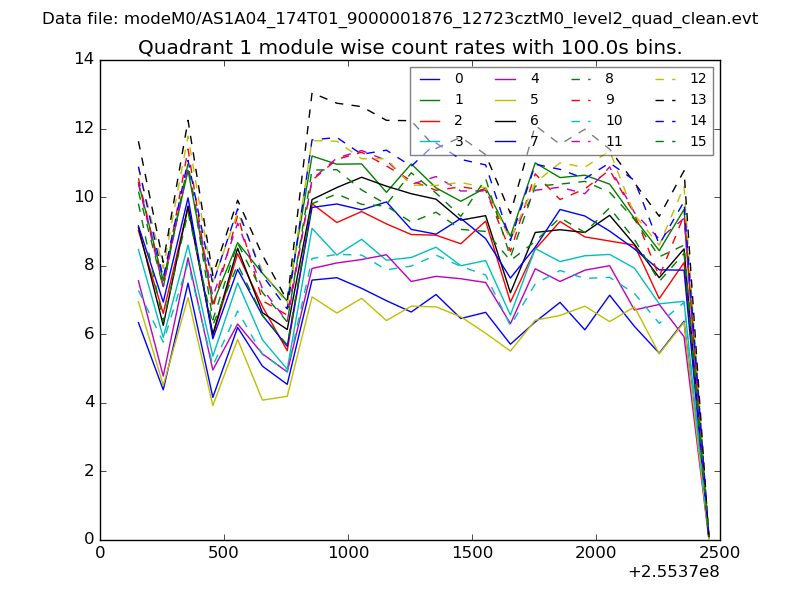
| Module-wise count rates for Quadrant B Data is divided into 100 sec bins |
 |
 |
| Module-wise count rates for Quadrant C Data is divided into 100 sec bins |
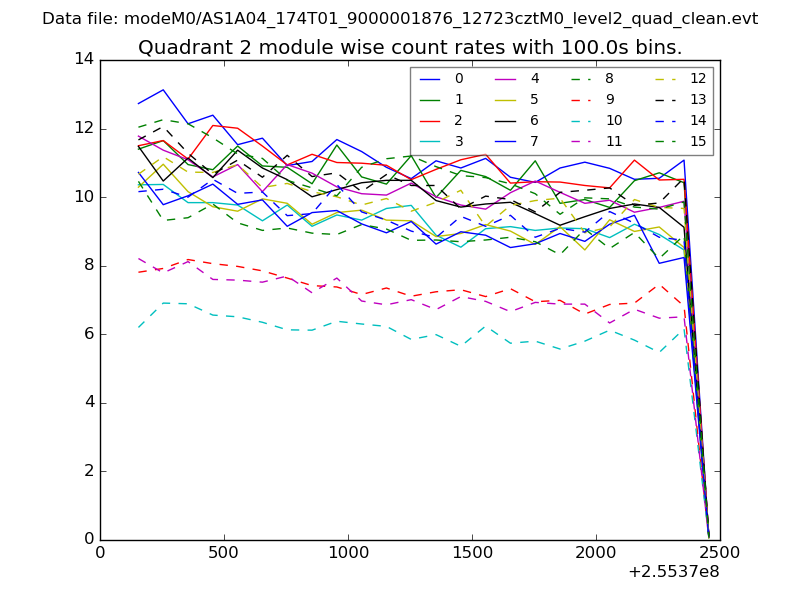 |
 |
| Module-wise count rates for Quadrant D Data is divided into 100 sec bins |
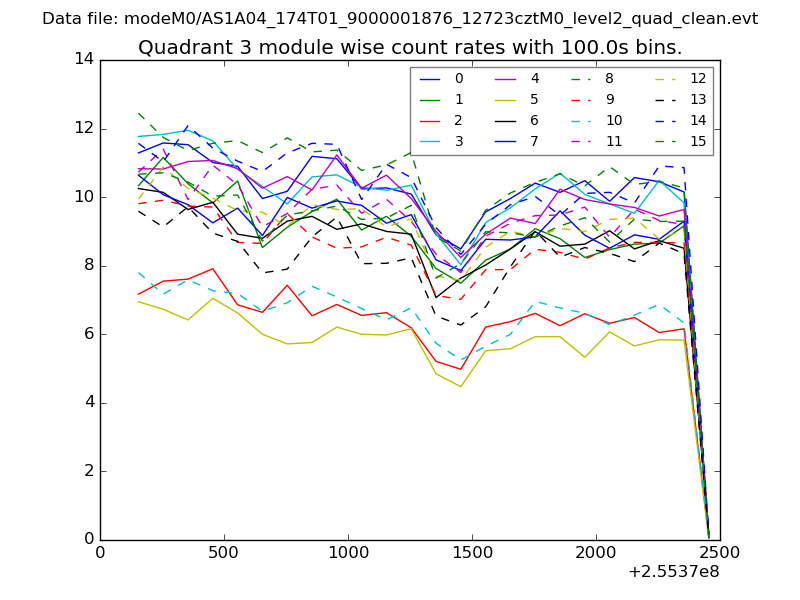 |
 |
| Parameter | Plot |
|---|---|
| CZT HV Monitor | 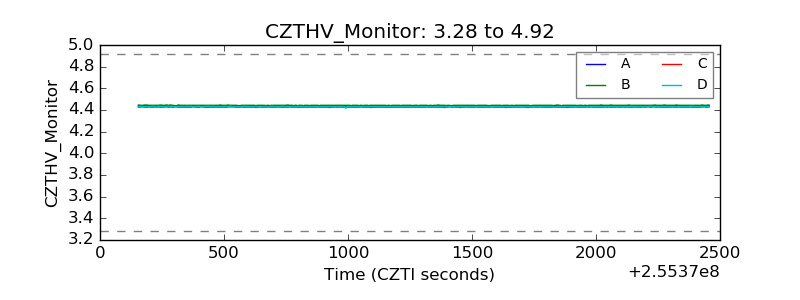 |
| D_VDD | 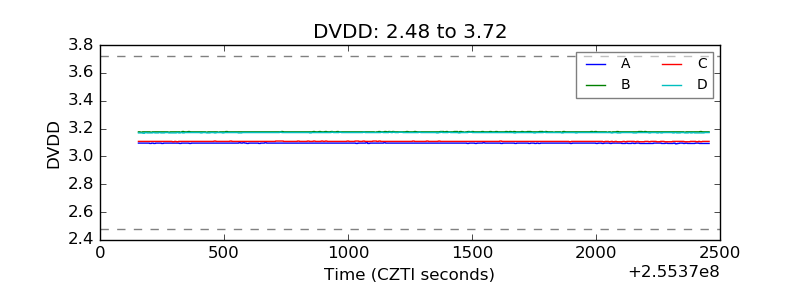 |
| Temperature 1 | 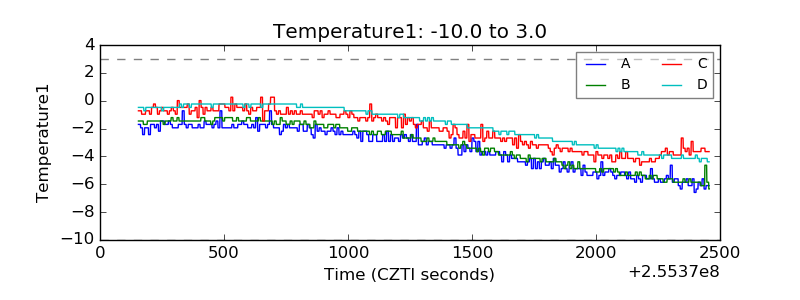 |
| Veto HV Monitor | 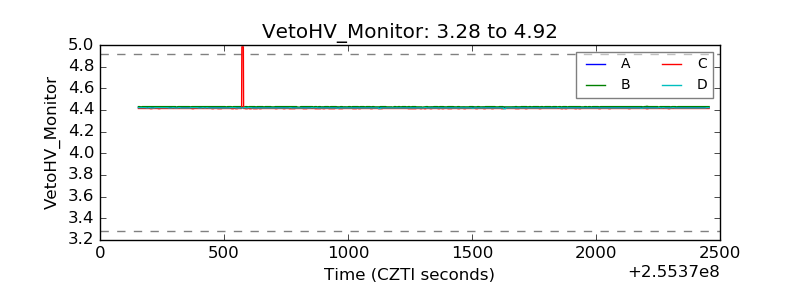 |
| Veto LLD | 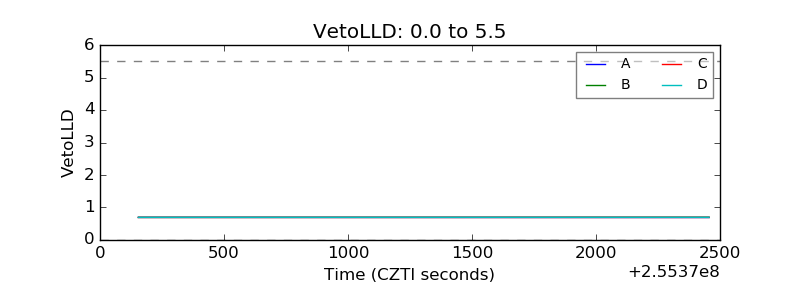 |
| Alpha Counter | 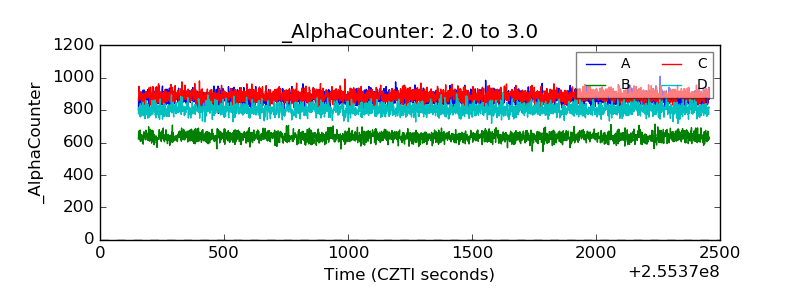 |
| _CPM_Rate | 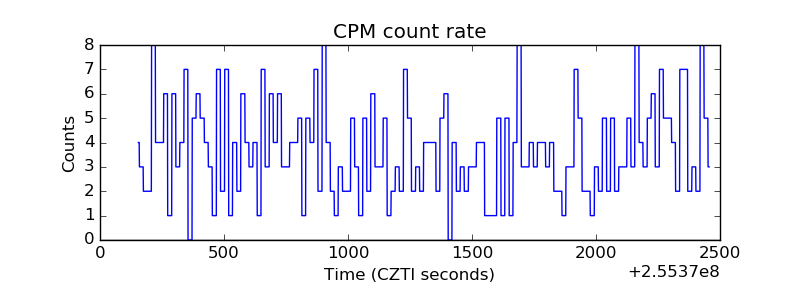 |
| CZT Counter | 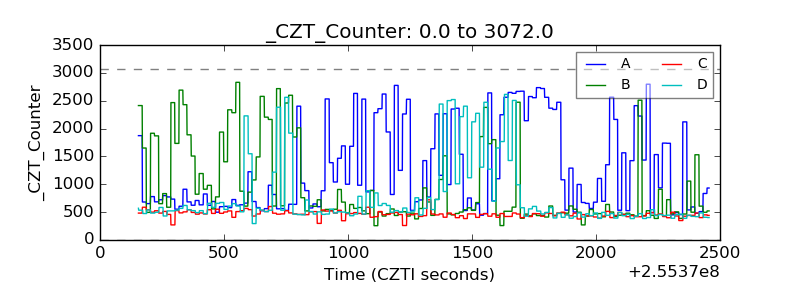 |
| +2.5 Volts monitor |  |
| +5 Volts monitor |  |
| _ROLL_ROT | 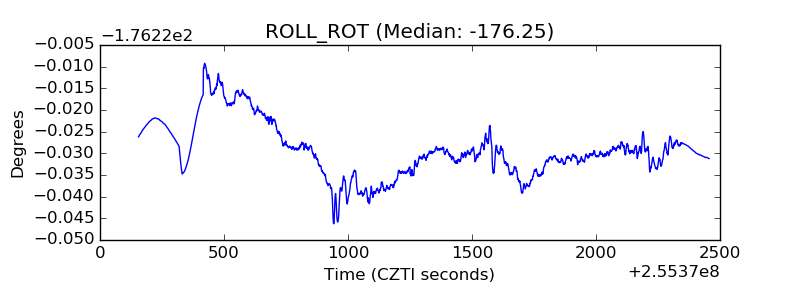 |
| _Roll_DEC | 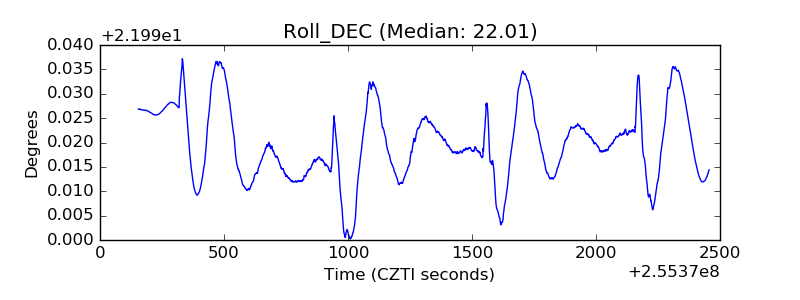 |
| _Roll_RA | 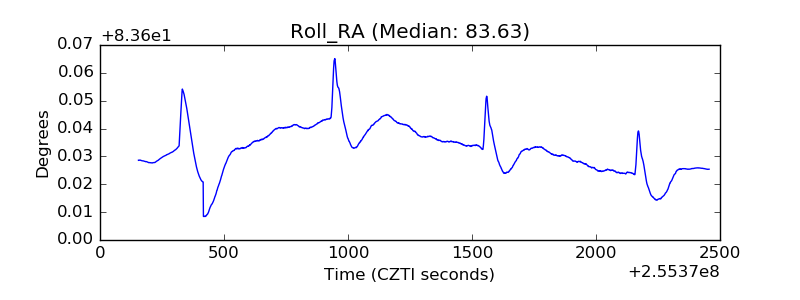 |
| Veto Counter | 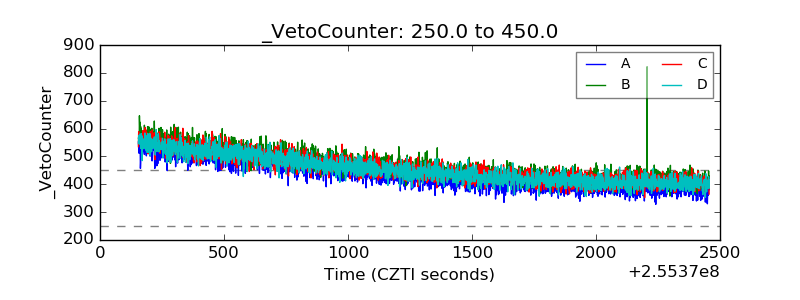 |