| Param | Original file | Final file |
|---|---|---|
| Filename | modeM0/AS1A04_130T04_9000001878cztM0_level2.fits | modeM0/AS1A04_130T04_9000001878cztM0_level2_quad_clean.evt |
| Size (bytes) | 165,096,000 | 166,386,240 |
| Size | 157.4 MB | 158.7 MB |
| Events in quadrant A | 986,728 | 992,514 |
| Events in quadrant B | 954,954 | 995,211 |
| Events in quadrant C | 1,000,246 | 970,904 |
| Events in quadrant D | 864,450 | 886,894 |
| Mode M0 | |||
|---|---|---|---|
| Quadrant | BADHDUFLAG | Total packets | Discarded packets |
| A | 0 | 47267 | 0 |
| B | 0 | 42221 | 0 |
| C | 0 | 35913 | 0 |
| D | 0 | 41522 | 0 |
| Mode M9 | |||
|---|---|---|---|
| Quadrant | BADHDUFLAG | Total packets | Discarded packets |
| A | 0 | 41 | 0 |
| B | 0 | 41 | 0 |
| C | 0 | 41 | 0 |
| D | 0 | 41 | 0 |
| Mode SS | |||
|---|---|---|---|
| Quadrant | BADHDUFLAG | Total packets | Discarded packets |
| A | 0 | 354 | 0 |
| B | 0 | 354 | 0 |
| C | 0 | 354 | 0 |
| D | 0 | 354 | 0 |
| Quadrant | Total seconds | Saturated seconds | Saturation percentage |
|---|---|---|---|
| A | 17302 | 1049 | 6.062883% |
| B | 17302 | 899 | 5.195931% |
| C | 17302 | 107 | 0.618426% |
| D | 17302 | 559 | 3.230840% |
Noise dominated data is calculated using 1-second bins in cleaned event files. If a bin has >2000 counts, and if more than 50% of those come from <1% of pixels, then it is considered to be noise-dominated and hence unusable.
| Quadrant | # 1 sec bins | Bins with >0 counts | Bins with >2000 counts | High rate bins dominated by noise | Noise dominated (total time) | Noise dominated (detector-on time) | Marked lightcurve |
|---|---|---|---|---|---|---|---|
| A | 21373 | 17296 | 0 | 0 | 0.00% | 0.00% |  |
| B | 21373 | 17222 | 0 | 0 | 0.00% | 0.00% |  |
| C | 21373 | 17302 | 0 | 0 | 0.00% | 0.00% |  |
| D | 21372 | 17301 | 0 | 0 | 0.00% | 0.00% |  |
Top three noisy pixels from each quadrant. If the there are fewer than three noisy pixels in the level2.evt file, extra rows are filled as -1
| Pixel properties | Quadrant properties | ||||||
|---|---|---|---|---|---|---|---|
| Quadrant | DetID | PixID | Counts | Sigma | Mean | Median | Sigma |
| A | 0 | 29 | 912 | 10.16 | 256 | 241 | 66.1 |
| A | 7 | 110 | 853 | 9.26 | 256 | 241 | 66.1 |
| A | 9 | 19 | 752 | 7.73 | 256 | 241 | 66.1 |
| B | 2 | 9 | 820 | 11.08 | 251 | 240 | 52.3 |
| B | 2 | 8 | 629 | 7.43 | 251 | 240 | 52.3 |
| B | 5 | 128 | 627 | 7.39 | 251 | 240 | 52.3 |
| C | 1 | 81 | 768 | 7.43 | 264 | 246 | 70.2 |
| C | 1 | 80 | 747 | 7.13 | 264 | 246 | 70.2 |
| C | 9 | 188 | 676 | 6.12 | 264 | 246 | 70.2 |
| D | 3 | 14 | 640 | 6.15 | 246 | 224 | 67.7 |
| D | 6 | 231 | 634 | 6.06 | 246 | 224 | 67.7 |
| D | 7 | 5 | 617 | 5.81 | 246 | 224 | 67.7 |
Histogram calculated using DETX and DETY for each event in the final _common_clean file
| Quadrant A |  |
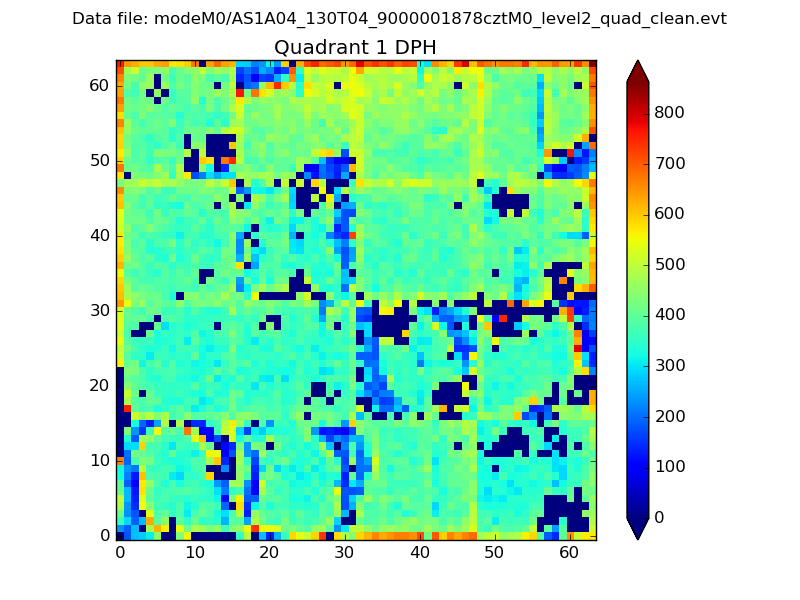 |
Quadrant B |
|---|---|---|---|
| Quadrant D |  |
 |
Quadrant C |
| Plot type | Count rate plots | Images |
|---|---|---|
| Comparison with Poisson distribution Blue bars denote a histogram of data divided into 1 sec bins. Red curve is a Poisson curve with rate = median count rate of data. |
 |
 |
| Quadrant-wise count rates Data is divided into 100 sec bins |
 |
|
| Module-wise count rates for Quadrant A Data is divided into 100 sec bins |
 |
 |
| Module-wise count rates for Quadrant B Data is divided into 100 sec bins |
 |
 |
| Module-wise count rates for Quadrant C Data is divided into 100 sec bins |
 |
 |
| Module-wise count rates for Quadrant D Data is divided into 100 sec bins |
 |
 |
| Parameter | Plot |
|---|---|
| CZT HV Monitor |  |
| D_VDD | 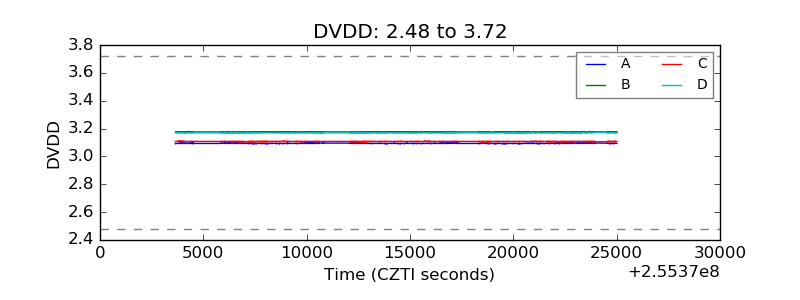 |
| Temperature 1 |  |
| Veto HV Monitor |  |
| Veto LLD |  |
| Alpha Counter |  |
| _CPM_Rate |  |
| CZT Counter |  |
| +2.5 Volts monitor |  |
| +5 Volts monitor |  |
| _ROLL_ROT | 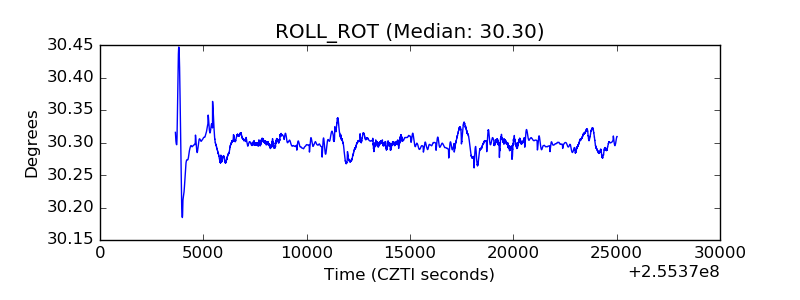 |
| _Roll_DEC | 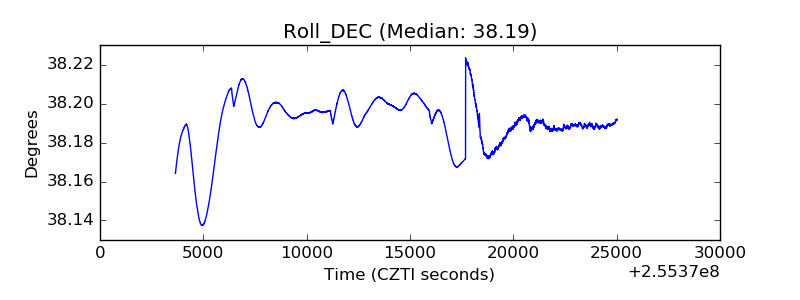 |
| _Roll_RA |  |
| Veto Counter |  |