| Param | Original file | Final file |
|---|---|---|
| Filename | modeM0/AS1A04_130T04_9000001878_12727cztM0_level2.evt | modeM0/AS1A04_130T04_9000001878_12727cztM0_level2_quad_clean.evt |
| Size (bytes) | 51,347,520 | 11,548,800 |
| Size | 49.0 MB | 11.0 MB |
| Events in quadrant A | 390,559 | 75,508 |
| Events in quadrant B | 355,272 | 78,457 |
| Events in quadrant C | 328,579 | 76,495 |
| Events in quadrant D | 438,603 | 71,094 |
| Mode M0 | |||
|---|---|---|---|
| Quadrant | BADHDUFLAG | Total packets | Discarded packets |
| A | 0 | 1537 | 1 |
| B | 0 | 1429 | 1 |
| C | 0 | 1343 | 1 |
| D | 0 | 1677 | 1 |
| Mode M9 | |||
|---|---|---|---|
| Quadrant | BADHDUFLAG | Total packets | Discarded packets |
| A | 0 | 6 | 0 |
| B | 0 | 6 | 0 |
| C | 0 | 6 | 0 |
| D | 0 | 6 | 0 |
| Mode SS | |||
|---|---|---|---|
| Quadrant | BADHDUFLAG | Total packets | Discarded packets |
| A | 0 | 14 | 0 |
| B | 0 | 14 | 0 |
| C | 0 | 14 | 0 |
| D | 0 | 14 | 0 |
| Quadrant | Total seconds | Saturated seconds | Saturation percentage |
|---|---|---|---|
| A | 568 | 45 | 7.922535% |
| B | 568 | 41 | 7.218310% |
| C | 568 | 9 | 1.584507% |
| D | 568 | 39 | 6.866197% |
Noise dominated data is calculated using 1-second bins in cleaned event files. If a bin has >2000 counts, and if more than 50% of those come from <1% of pixels, then it is considered to be noise-dominated and hence unusable.
| Quadrant | # 1 sec bins | Bins with >0 counts | Bins with >2000 counts | High rate bins dominated by noise | Noise dominated (total time) | Noise dominated (detector-on time) | Marked lightcurve |
|---|---|---|---|---|---|---|---|
| A | 1130 | 571 | 11 | 11 | 0.97% | 1.93% | 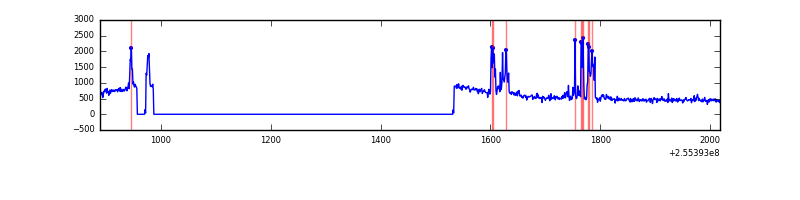 |
| B | 1130 | 571 | 0 | 0 | 0.00% | 0.00% | 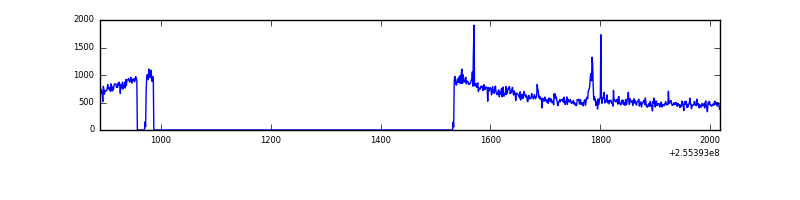 |
| C | 1130 | 571 | 0 | 0 | 0.00% | 0.00% | 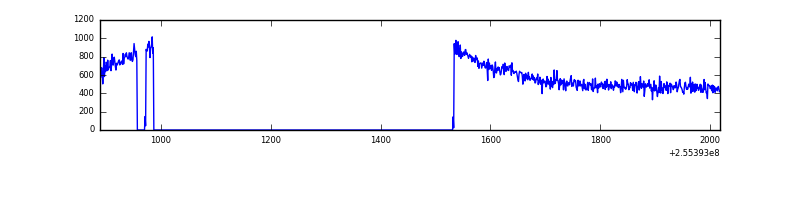 |
| D | 1130 | 571 | 14 | 14 | 1.24% | 2.45% | 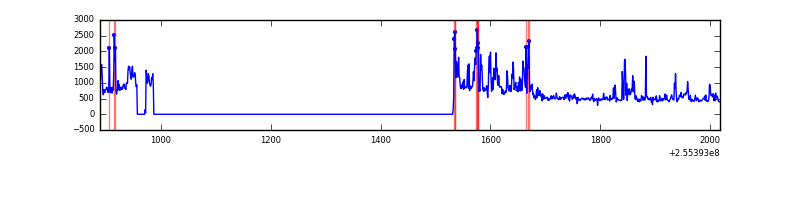 |
Top three noisy pixels from each quadrant. If the there are fewer than three noisy pixels in the level2.evt file, extra rows are filled as -1
| Pixel properties | Quadrant properties | ||||||
|---|---|---|---|---|---|---|---|
| Quadrant | DetID | PixID | Counts | Sigma | Mean | Median | Sigma |
| A | 15 | 239 | 68449 | 3438.59 | 83 | 81 | 19.9 |
| A | 12 | 189 | 1109 | 51.7 | 83 | 81 | 19.9 |
| A | 0 | 226 | 703 | 31.28 | 83 | 81 | 19.9 |
| B | 4 | 239 | 13451 | 680.89 | 86 | 83 | 19.6 |
| B | 12 | 111 | 2071 | 101.26 | 86 | 83 | 19.6 |
| B | 11 | 111 | 1795 | 87.2 | 86 | 83 | 19.6 |
| C | 13 | 61 | 585 | 22.83 | 84 | 84 | 21.9 |
| C | -1 | -1 | -1 | -1.0 | 84 | 84 | 21.9 |
| C | -1 | -1 | -1 | -1.0 | 84 | 84 | 21.9 |
| D | 1 | 52 | 90892 | 4266.9 | 80 | 77 | 21.3 |
| D | 10 | 253 | 25890 | 1212.81 | 80 | 77 | 21.3 |
| D | 2 | 136 | 7134 | 331.57 | 80 | 77 | 21.3 |
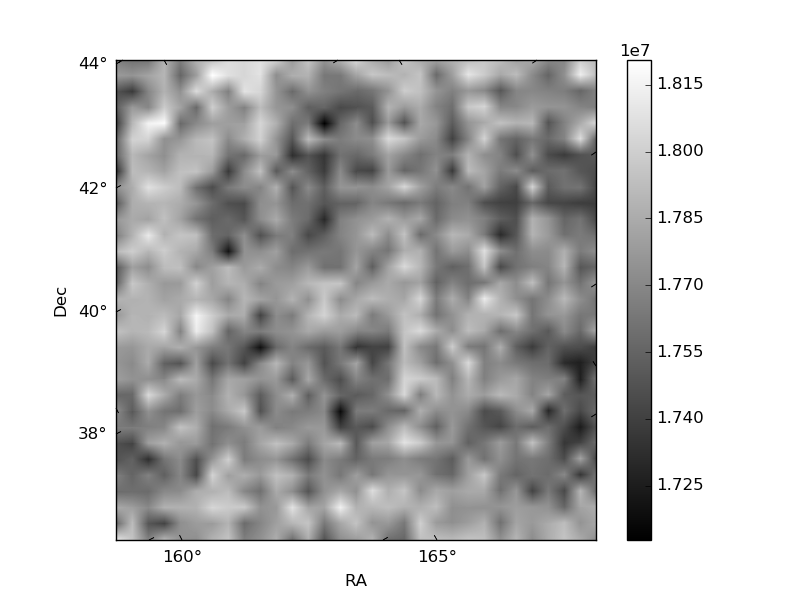
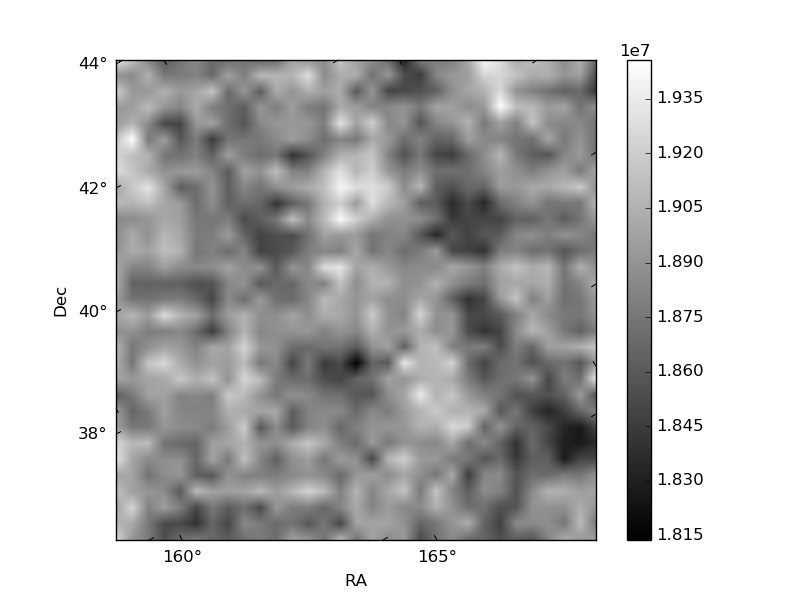
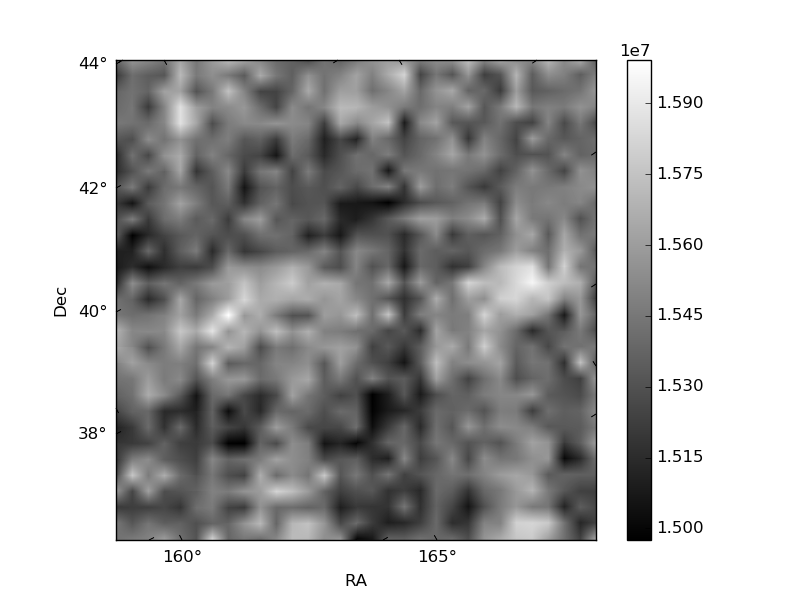
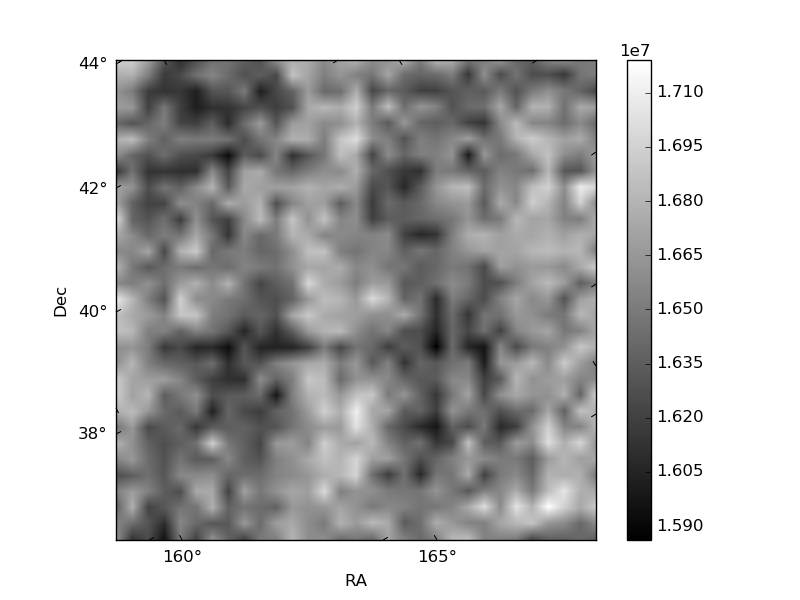
Histogram calculated using DETX and DETY for each event in the final _common_clean file
| Quadrant A | 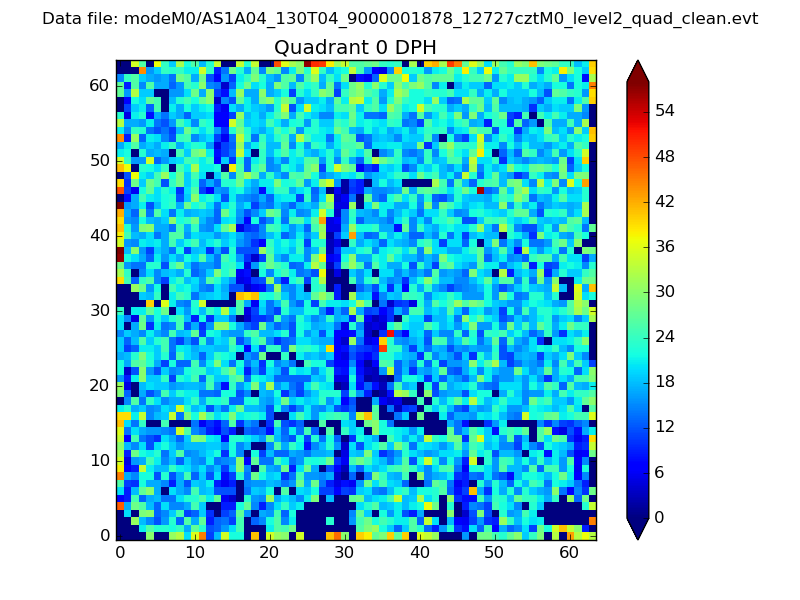 |
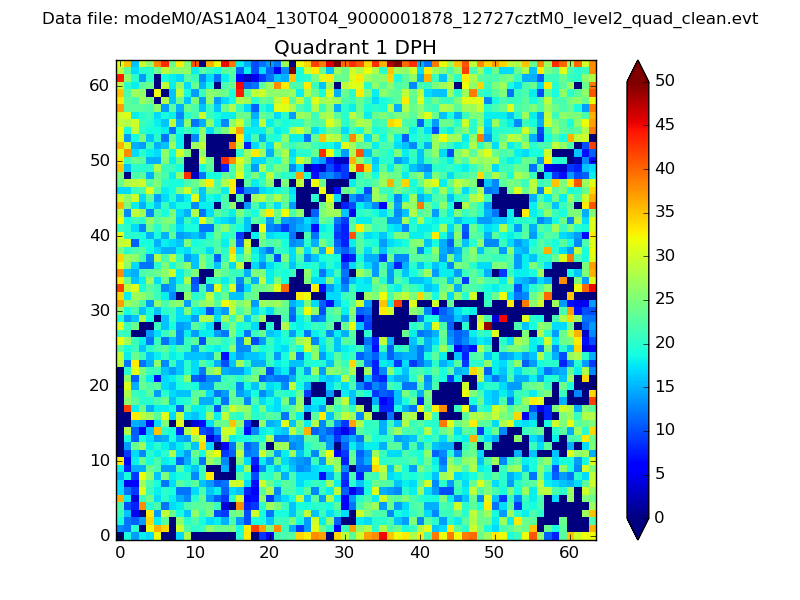 |
Quadrant B |
|---|---|---|---|
| Quadrant D |  |
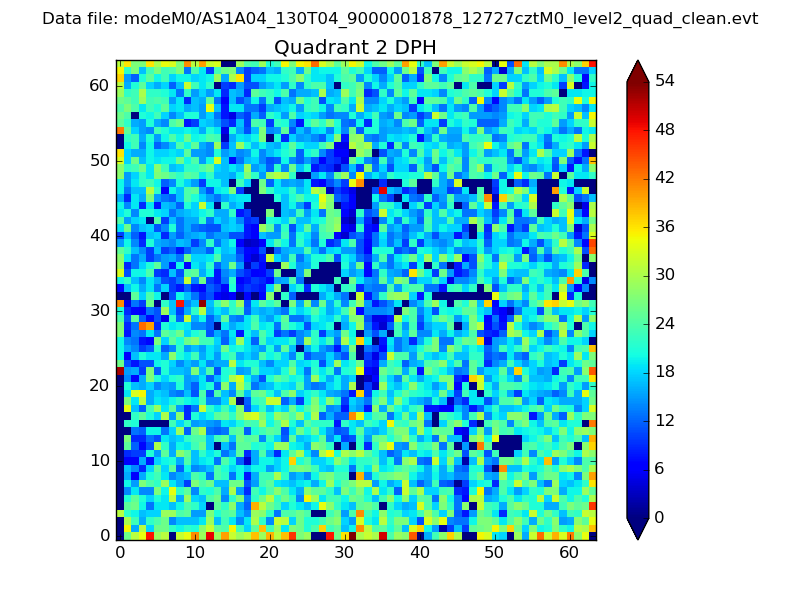 |
Quadrant C |
| Plot type | Count rate plots | Images |
|---|---|---|
| Comparison with Poisson distribution Blue bars denote a histogram of data divided into 1 sec bins. Red curve is a Poisson curve with rate = median count rate of data. |
 |
 |
| Quadrant-wise count rates Data is divided into 100 sec bins |
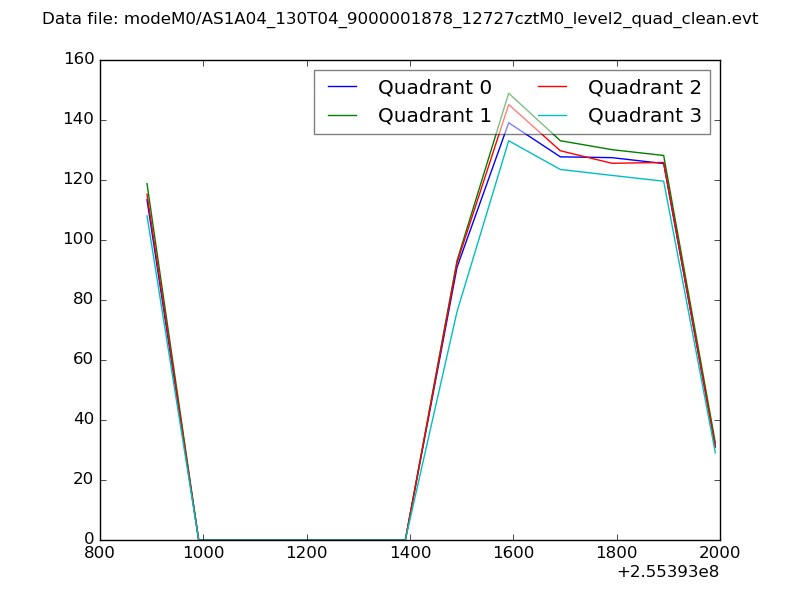 |
|
| Module-wise count rates for Quadrant A Data is divided into 100 sec bins |
 |
 |
| Module-wise count rates for Quadrant B Data is divided into 100 sec bins |
 |
 |
| Module-wise count rates for Quadrant C Data is divided into 100 sec bins |
 |
 |
| Module-wise count rates for Quadrant D Data is divided into 100 sec bins |
 |
 |
| Parameter | Plot |
|---|---|
| CZT HV Monitor |  |
| D_VDD | 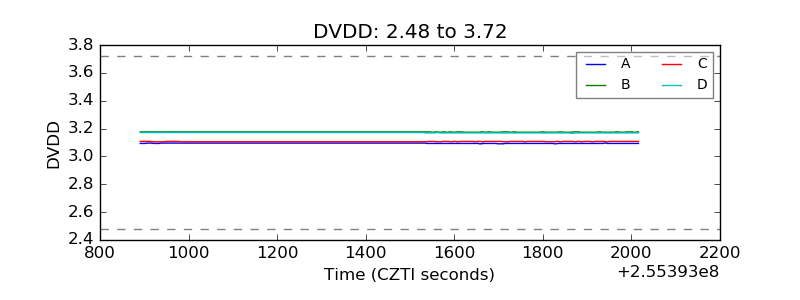 |
| Temperature 1 | 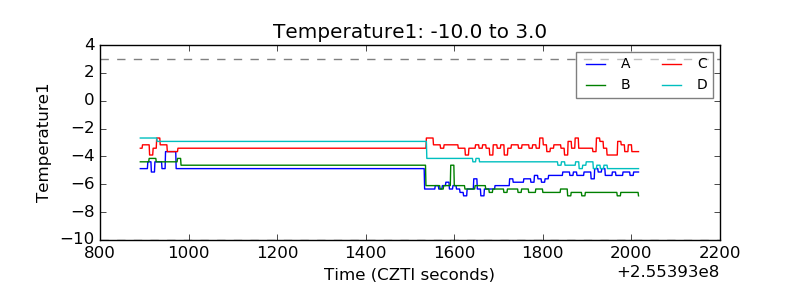 |
| Veto HV Monitor | 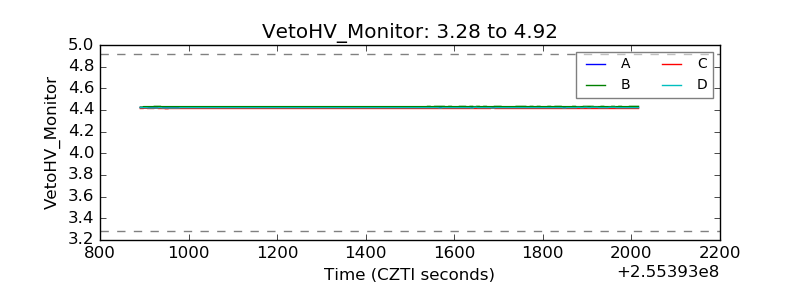 |
| Veto LLD | 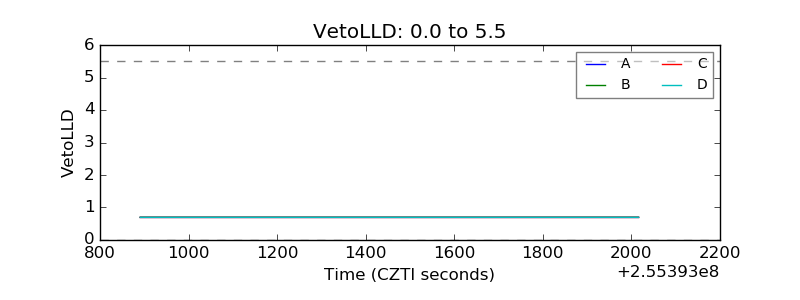 |
| Alpha Counter | 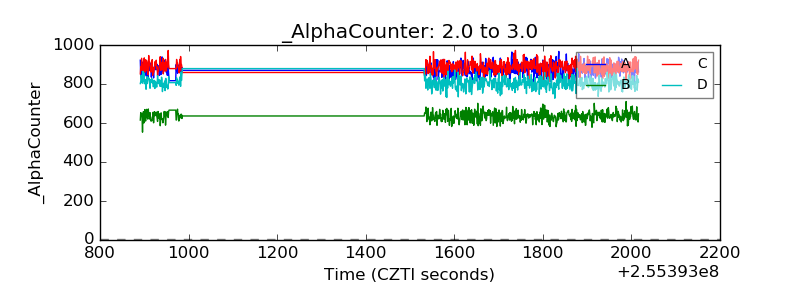 |
| _CPM_Rate | 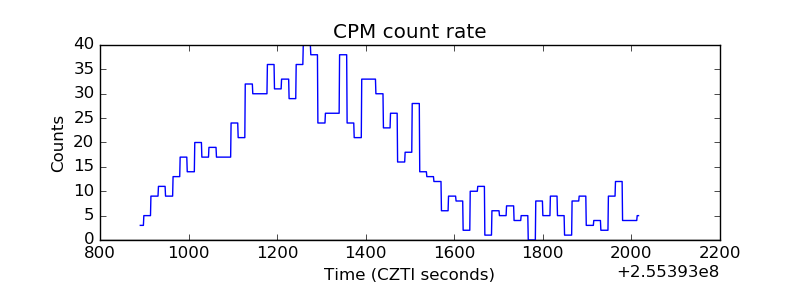 |
| CZT Counter | 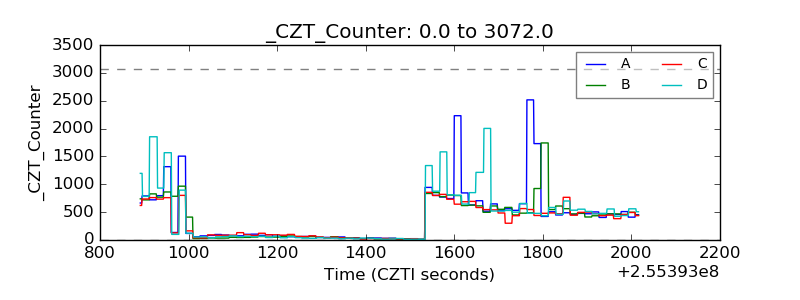 |
| +2.5 Volts monitor |  |
| +5 Volts monitor |  |
| _ROLL_ROT | 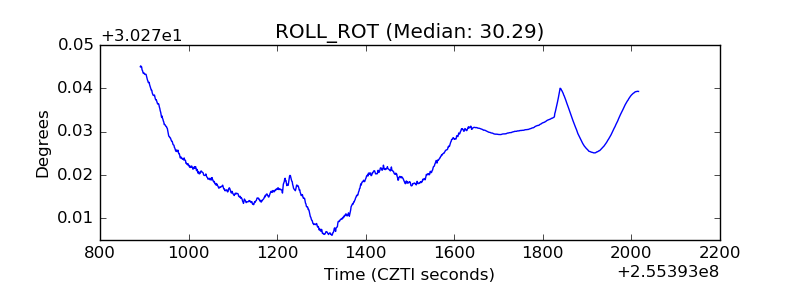 |
| _Roll_DEC | 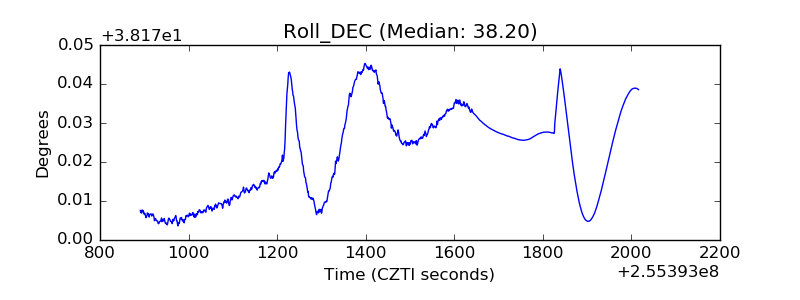 |
| _Roll_RA | 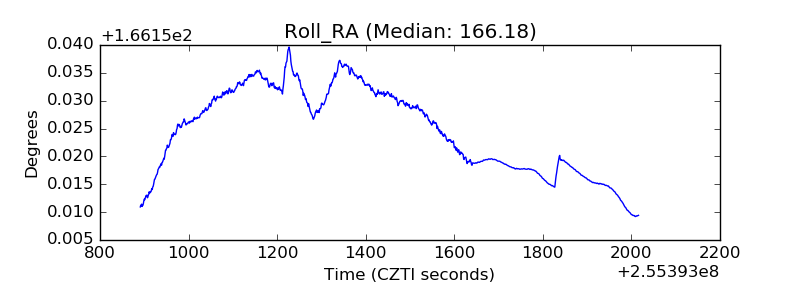 |
| Veto Counter |  |