| Param | Original file | Final file |
|---|---|---|
| Filename | modeM0/AS1G08_021T01_9000001880cztM0_level2.fits | modeM0/AS1G08_021T01_9000001880cztM0_level2_quad_clean.evt |
| Size (bytes) | 656,210,880 | 755,225,280 |
| Size | 625.8 MB | 720.2 MB |
| Events in quadrant A | 3,980,808 | 4,777,488 |
| Events in quadrant B | 3,700,104 | 4,475,719 |
| Events in quadrant C | 3,911,444 | 4,560,400 |
| Events in quadrant D | 3,327,620 | 4,110,224 |
| Mode M0 | |||
|---|---|---|---|
| Quadrant | BADHDUFLAG | Total packets | Discarded packets |
| A | 0 | 155672 | 0 |
| B | 0 | 190213 | 0 |
| C | 0 | 146857 | 0 |
| D | 0 | 195505 | 0 |
| Mode SS | |||
|---|---|---|---|
| Quadrant | BADHDUFLAG | Total packets | Discarded packets |
| A | 0 | 1466 | 0 |
| B | 0 | 1466 | 0 |
| C | 0 | 1466 | 0 |
| D | 0 | 1466 | 0 |
| Mode M9 | |||
|---|---|---|---|
| Quadrant | BADHDUFLAG | Total packets | Discarded packets |
| A | 0 | 92 | 0 |
| B | 0 | 92 | 0 |
| C | 0 | 92 | 0 |
| D | 0 | 92 | 0 |
| Quadrant | Total seconds | Saturated seconds | Saturation percentage |
|---|---|---|---|
| A | 72185 | 1151 | 1.594514% |
| B | 72185 | 5713 | 7.914387% |
| C | 72185 | 550 | 0.761931% |
| D | 72185 | 3360 | 4.654707% |
Noise dominated data is calculated using 1-second bins in cleaned event files. If a bin has >2000 counts, and if more than 50% of those come from <1% of pixels, then it is considered to be noise-dominated and hence unusable.
| Quadrant | # 1 sec bins | Bins with >0 counts | Bins with >2000 counts | High rate bins dominated by noise | Noise dominated (total time) | Noise dominated (detector-on time) | Marked lightcurve |
|---|---|---|---|---|---|---|---|
| A | 115064 | 72180 | 0 | 0 | 0.00% | 0.00% |  |
| B | 115064 | 71740 | 0 | 0 | 0.00% | 0.00% |  |
| C | 115063 | 72180 | 0 | 0 | 0.00% | 0.00% |  |
| D | 115063 | 72160 | 0 | 0 | 0.00% | 0.00% |  |
Top three noisy pixels from each quadrant. If the there are fewer than three noisy pixels in the level2.evt file, extra rows are filled as -1
| Pixel properties | Quadrant properties | ||||||
|---|---|---|---|---|---|---|---|
| Quadrant | DetID | PixID | Counts | Sigma | Mean | Median | Sigma |
| A | 0 | 29 | 3753 | 10.9 | 1038 | 974 | 255.1 |
| A | 9 | 19 | 2985 | 7.88 | 1038 | 974 | 255.1 |
| A | 0 | 30 | 2917 | 7.62 | 1038 | 974 | 255.1 |
| B | 2 | 9 | 3255 | 12.35 | 976 | 933 | 188.0 |
| B | 14 | 254 | 2488 | 8.27 | 976 | 933 | 188.0 |
| B | 5 | 128 | 2461 | 8.13 | 976 | 933 | 188.0 |
| C | 12 | 241 | 2795 | 6.83 | 1034 | 962 | 268.5 |
| C | 2 | 191 | 2723 | 6.56 | 1034 | 962 | 268.5 |
| C | 3 | 126 | 2591 | 6.07 | 1034 | 962 | 268.5 |
| D | 6 | 231 | 2485 | 6.42 | 948 | 862 | 252.7 |
| D | 3 | 14 | 2474 | 6.38 | 948 | 862 | 252.7 |
| D | 7 | 3 | 2325 | 5.79 | 948 | 862 | 252.7 |
Histogram calculated using DETX and DETY for each event in the final _common_clean file
| Quadrant A |  |
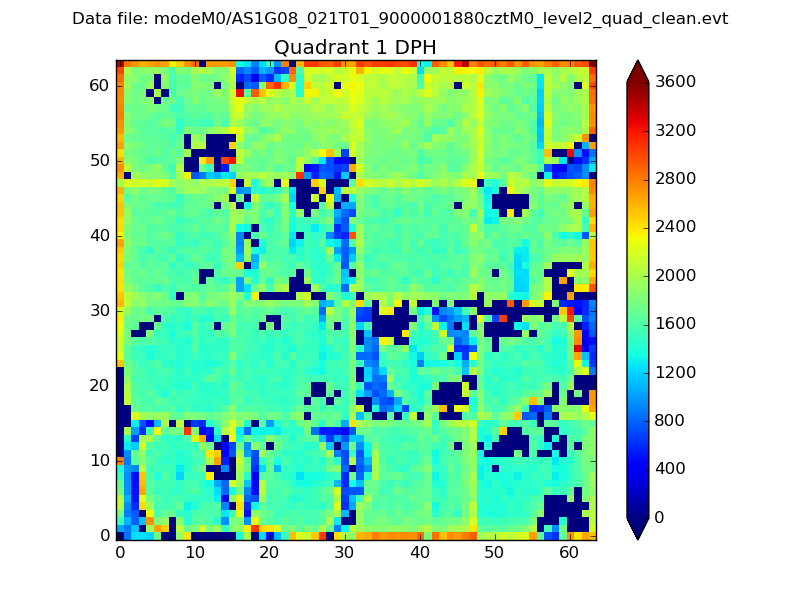 |
Quadrant B |
|---|---|---|---|
| Quadrant D |  |
 |
Quadrant C |
| Plot type | Count rate plots | Images |
|---|---|---|
| Comparison with Poisson distribution Blue bars denote a histogram of data divided into 1 sec bins. Red curve is a Poisson curve with rate = median count rate of data. |
 |
 |
| Quadrant-wise count rates Data is divided into 100 sec bins |
 |
|
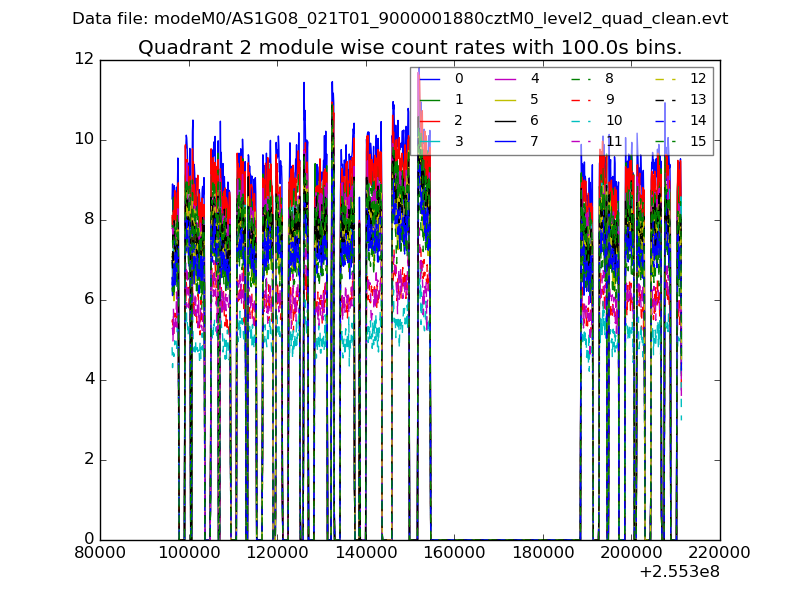
| Module-wise count rates for Quadrant A Data is divided into 100 sec bins |
 |
 |
| Module-wise count rates for Quadrant B Data is divided into 100 sec bins |
 |
 |
| Module-wise count rates for Quadrant C Data is divided into 100 sec bins |
 |
 |
| Module-wise count rates for Quadrant D Data is divided into 100 sec bins |
 |
 |
| Parameter | Plot |
|---|---|
| CZT HV Monitor |  |
| D_VDD | 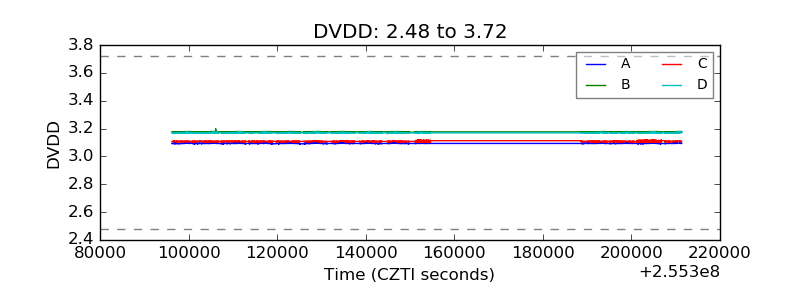 |
| Temperature 1 |  |
| Veto HV Monitor |  |
| Veto LLD |  |
| Alpha Counter |  |
| _CPM_Rate |  |
| CZT Counter | 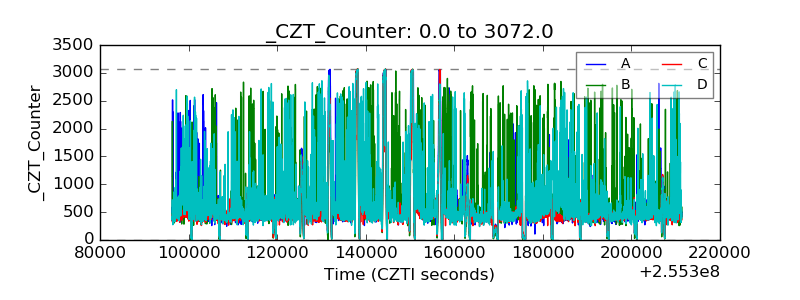 |
| +2.5 Volts monitor |  |
| +5 Volts monitor | 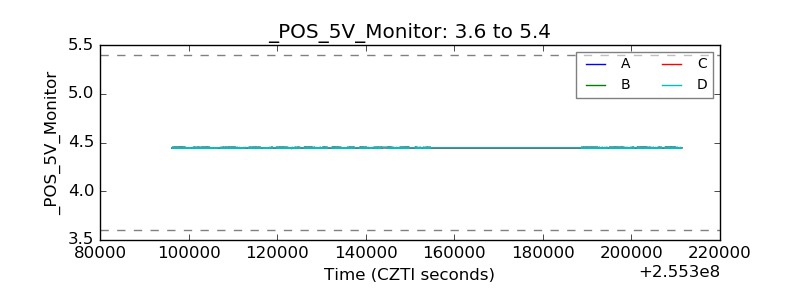 |
| _ROLL_ROT |  |
| _Roll_DEC |  |
| _Roll_RA |  |
| Veto Counter |  |