| Param | Original file | Final file |
|---|---|---|
| Filename | modeM0/AS1G08_021T01_9000001880_12727cztM0_level2.evt | modeM0/AS1G08_021T01_9000001880_12727cztM0_level2_quad_clean.evt |
| Size (bytes) | 512,323,200 | 80,824,320 |
| Size | 488.6 MB | 77.1 MB |
| Events in quadrant A | 4,379,719 | 511,280 |
| Events in quadrant B | 3,345,168 | 518,757 |
| Events in quadrant C | 2,523,366 | 521,772 |
| Events in quadrant D | 4,872,945 | 488,784 |
| Mode M0 | |||
|---|---|---|---|
| Quadrant | BADHDUFLAG | Total packets | Discarded packets |
| A | 0 | 16964 | 3 |
| B | 0 | 13914 | 2 |
| C | 0 | 11745 | 2 |
| D | 0 | 18618 | 2 |
| Mode SS | |||
|---|---|---|---|
| Quadrant | BADHDUFLAG | Total packets | Discarded packets |
| A | 0 | 120 | 0 |
| B | 0 | 120 | 0 |
| C | 0 | 120 | 0 |
| D | 0 | 120 | 0 |
| Mode M9 | |||
|---|---|---|---|
| Quadrant | BADHDUFLAG | Total packets | Discarded packets |
| A | 0 | 3 | 0 |
| B | 0 | 3 | 0 |
| C | 0 | 3 | 0 |
| D | 0 | 3 | 0 |
| Quadrant | Total seconds | Saturated seconds | Saturation percentage |
|---|---|---|---|
| A | 5811 | 365 | 6.281191% |
| B | 5811 | 324 | 5.575632% |
| C | 5811 | 15 | 0.258131% |
| D | 5811 | 293 | 5.042161% |
Noise dominated data is calculated using 1-second bins in cleaned event files. If a bin has >2000 counts, and if more than 50% of those come from <1% of pixels, then it is considered to be noise-dominated and hence unusable.
| Quadrant | # 1 sec bins | Bins with >0 counts | Bins with >2000 counts | High rate bins dominated by noise | Noise dominated (total time) | Noise dominated (detector-on time) | Marked lightcurve |
|---|---|---|---|---|---|---|---|
| A | 6137 | 5813 | 283 | 283 | 4.61% | 4.87% | 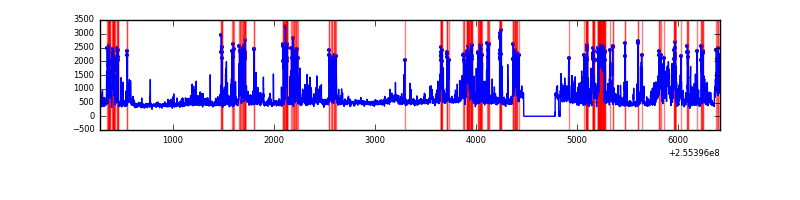 |
| B | 6137 | 5813 | 139 | 139 | 2.26% | 2.39% | 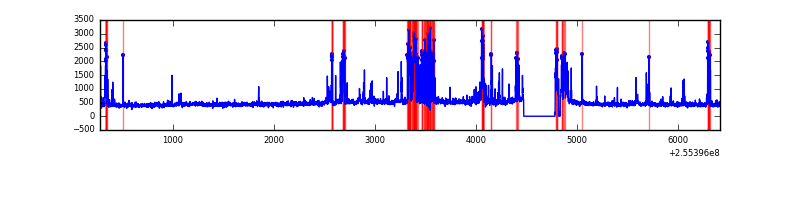 |
| C | 6137 | 5813 | 0 | 0 | 0.00% | 0.00% | 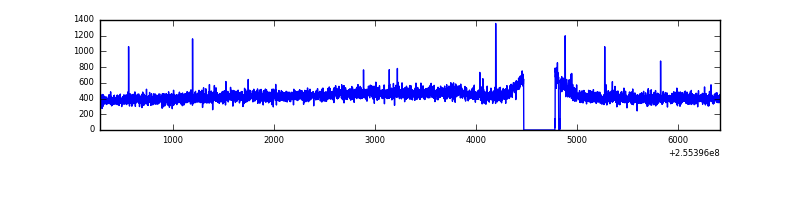 |
| D | 6137 | 5813 | 213 | 213 | 3.47% | 3.66% | 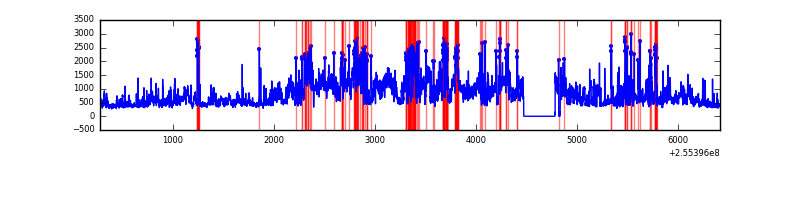 |
Top three noisy pixels from each quadrant. If the there are fewer than three noisy pixels in the level2.evt file, extra rows are filled as -1
| Pixel properties | Quadrant properties | ||||||
|---|---|---|---|---|---|---|---|
| Quadrant | DetID | PixID | Counts | Sigma | Mean | Median | Sigma |
| A | 15 | 239 | 1810131 | 13848.3 | 647 | 633 | 130.7 |
| A | 12 | 189 | 32121 | 240.98 | 647 | 633 | 130.7 |
| A | 15 | 222 | 26181 | 195.52 | 647 | 633 | 130.7 |
| B | 4 | 239 | 709691 | 5758.46 | 647 | 630 | 123.1 |
| B | 3 | 64 | 30091 | 239.26 | 647 | 630 | 123.1 |
| B | 0 | 205 | 24481 | 193.7 | 647 | 630 | 123.1 |
| C | 13 | 61 | 4752 | 27.44 | 645 | 647 | 149.6 |
| C | 14 | 234 | 3700 | 20.41 | 645 | 647 | 149.6 |
| C | 15 | 208 | 3674 | 20.24 | 645 | 647 | 149.6 |
| D | 1 | 52 | 2083213 | 14109.7 | 625 | 609 | 147.6 |
| D | 10 | 199 | 134491 | 907.05 | 625 | 609 | 147.6 |
| D | 8 | 195 | 68927 | 462.86 | 625 | 609 | 147.6 |
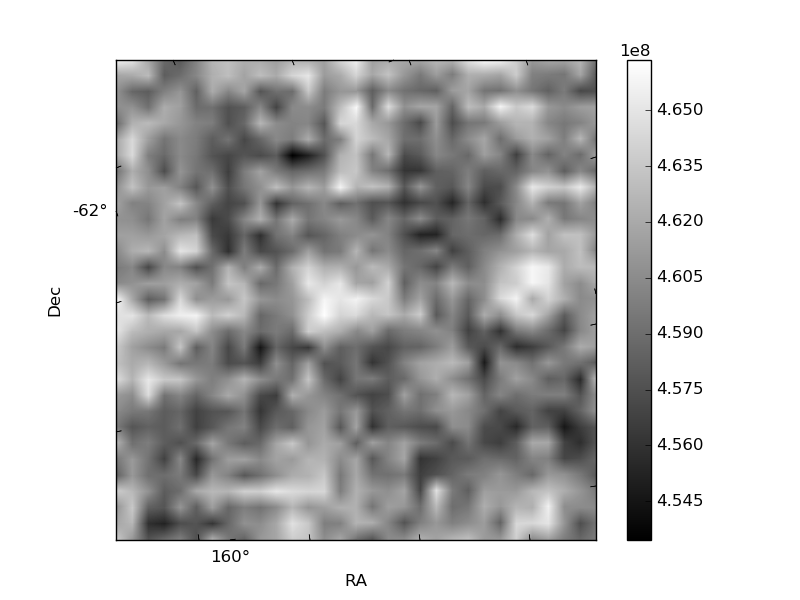
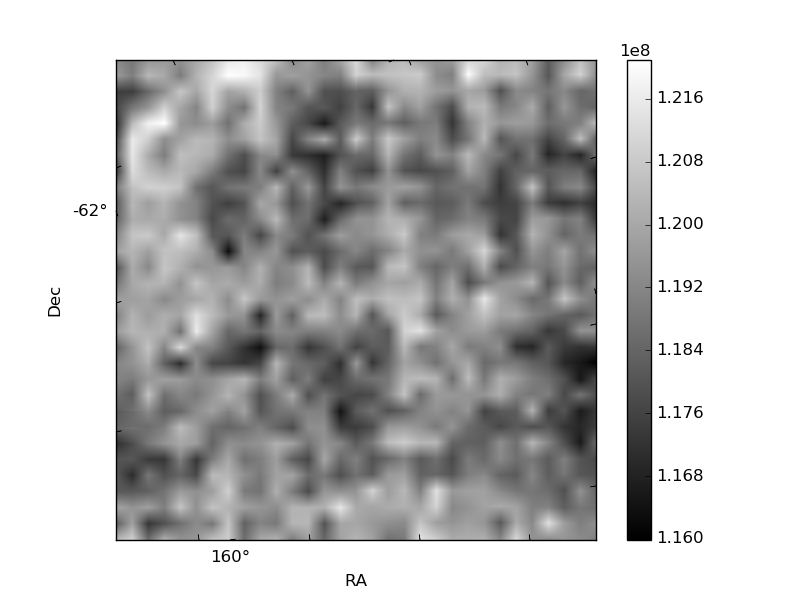
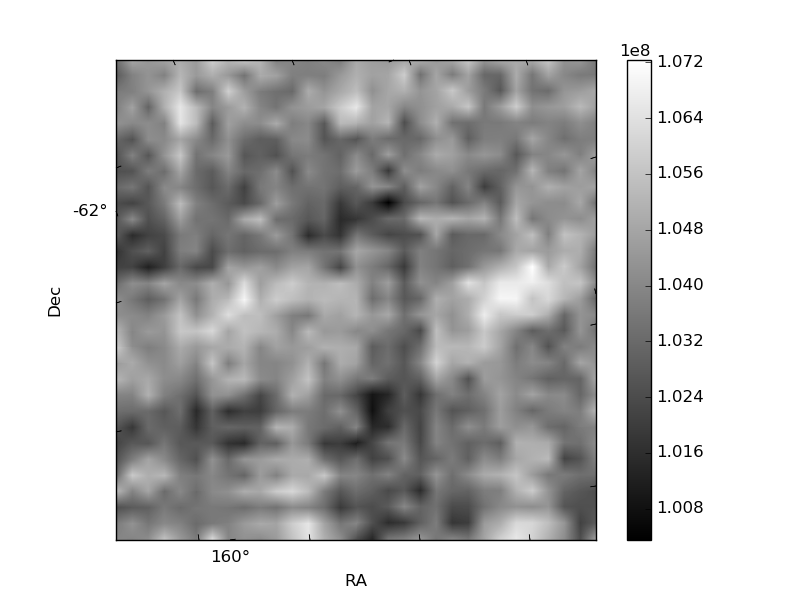
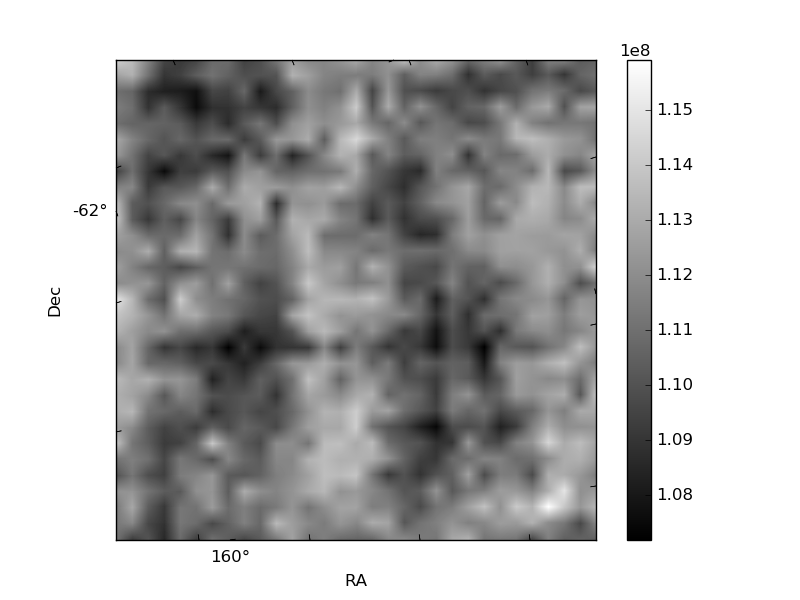
Histogram calculated using DETX and DETY for each event in the final _common_clean file
| Quadrant A | 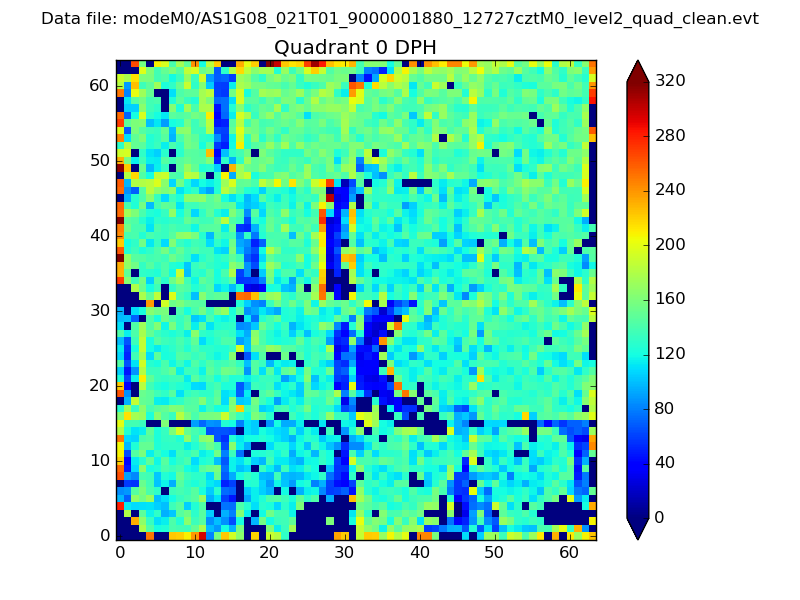 |
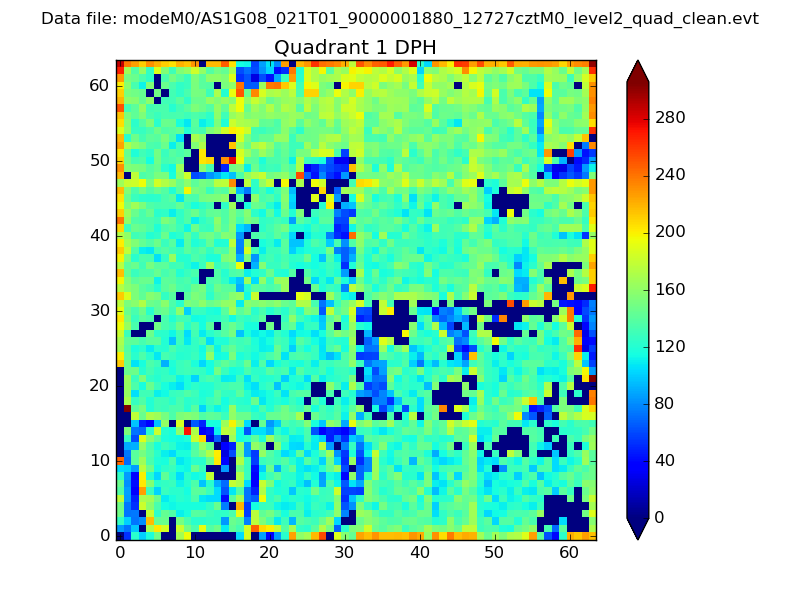 |
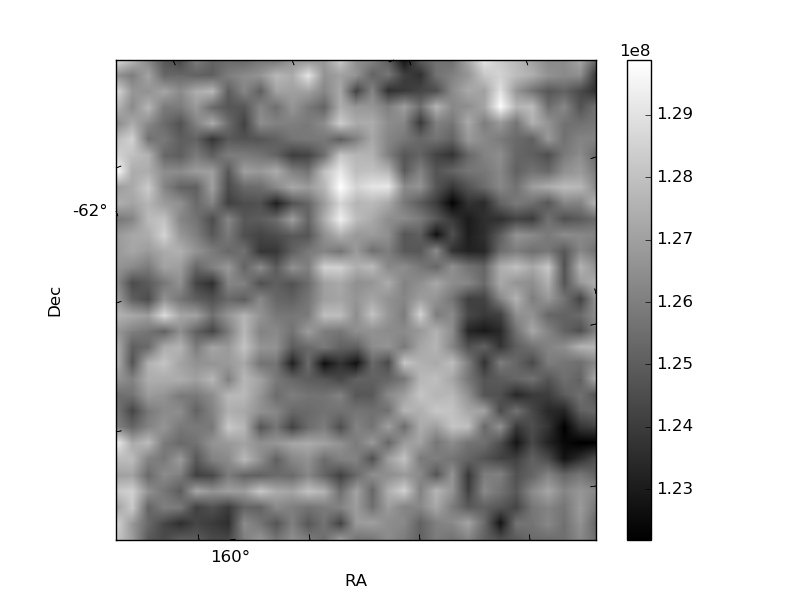
Quadrant B |
|---|---|---|---|
| Quadrant D | 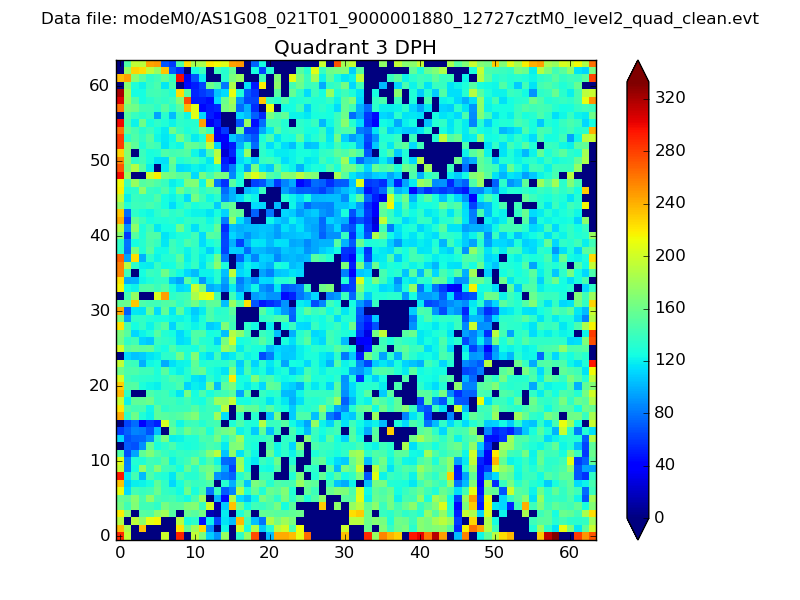 |
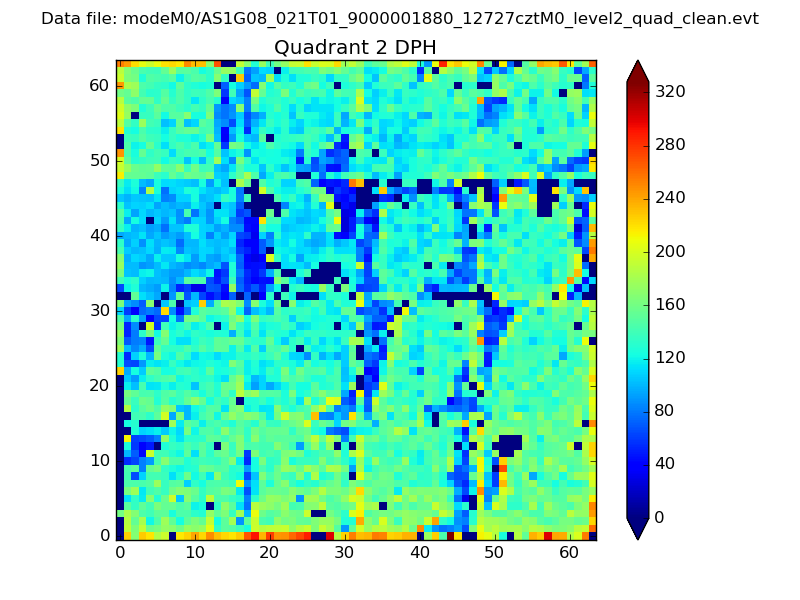 |
Quadrant C |
| Plot type | Count rate plots | Images |
|---|---|---|
| Comparison with Poisson distribution Blue bars denote a histogram of data divided into 1 sec bins. Red curve is a Poisson curve with rate = median count rate of data. |
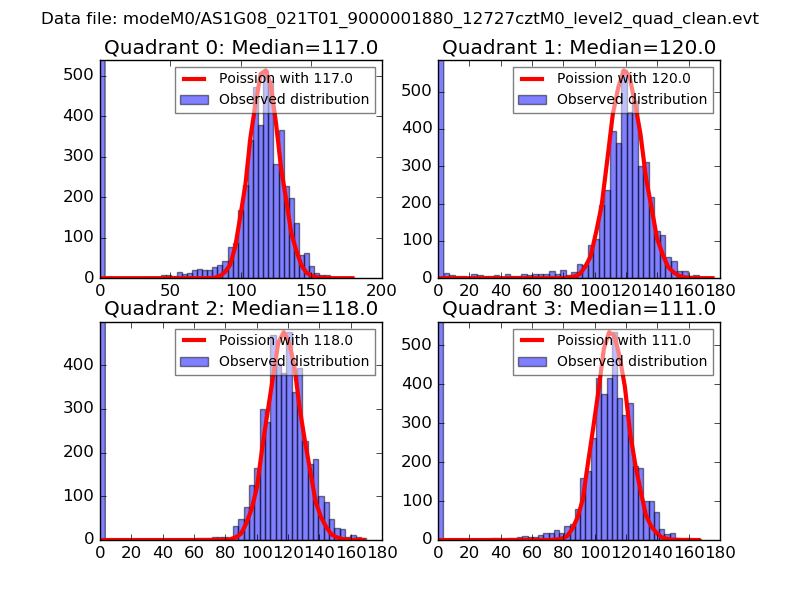 |
 |
| Quadrant-wise count rates Data is divided into 100 sec bins |
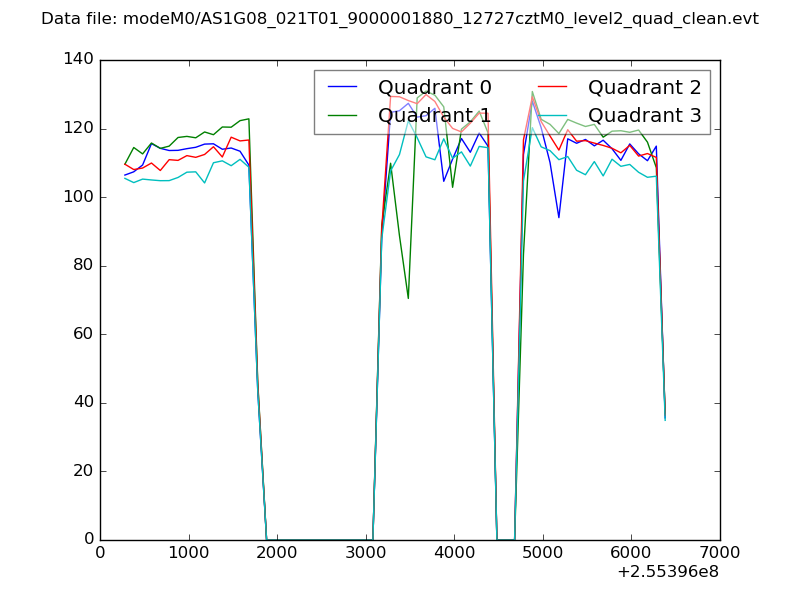 |
|
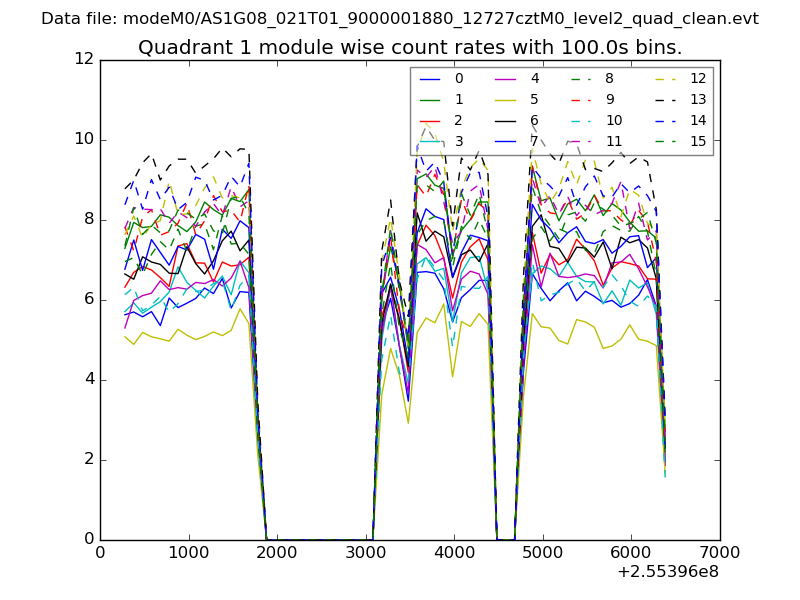
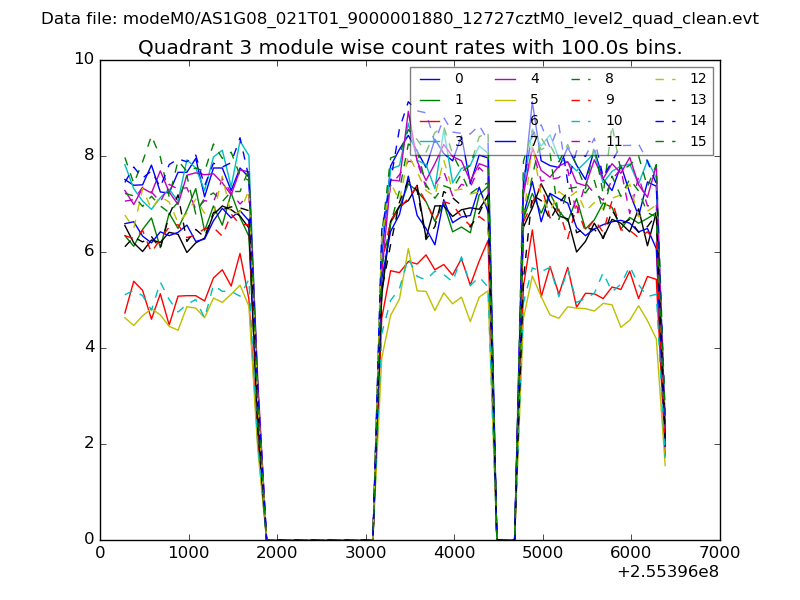
| Module-wise count rates for Quadrant A Data is divided into 100 sec bins |
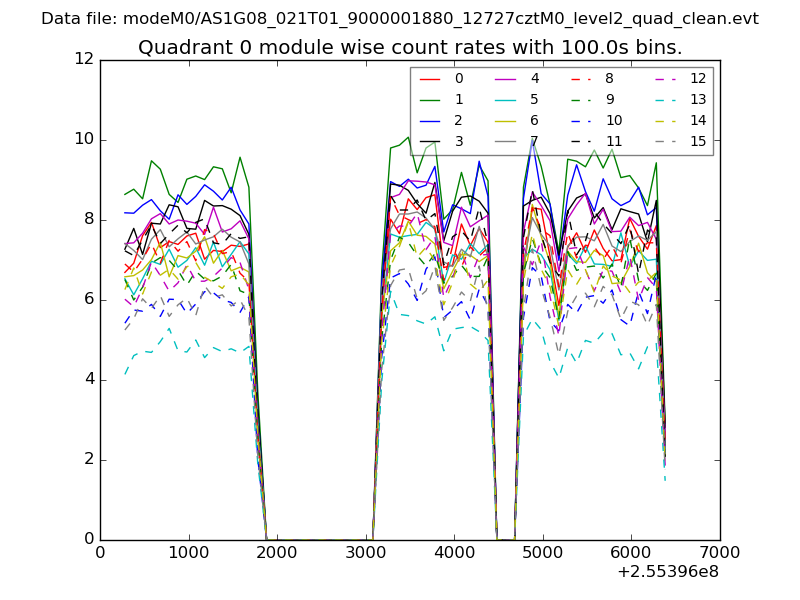 |
 |
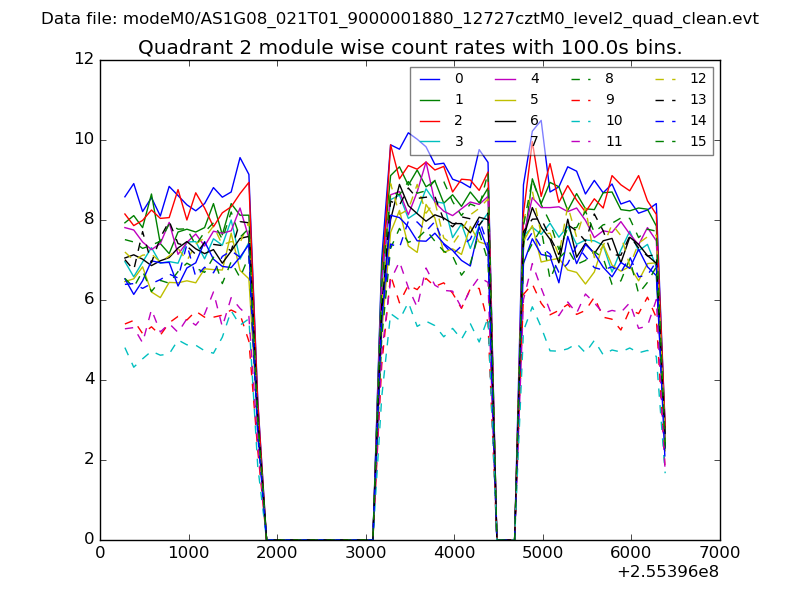
| Module-wise count rates for Quadrant B Data is divided into 100 sec bins |
 |
 |
| Module-wise count rates for Quadrant C Data is divided into 100 sec bins |
 |
 |
| Module-wise count rates for Quadrant D Data is divided into 100 sec bins |
 |
 |
| Parameter | Plot |
|---|---|
| CZT HV Monitor | 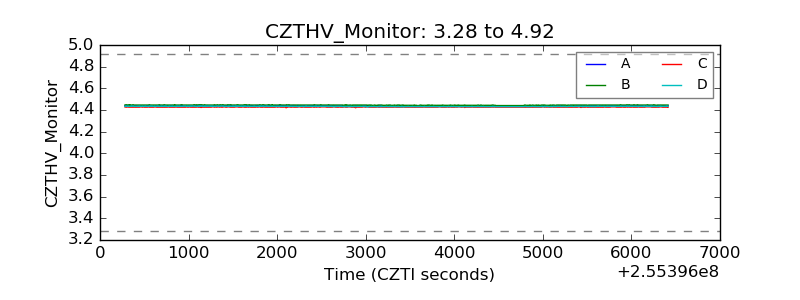 |
| D_VDD | 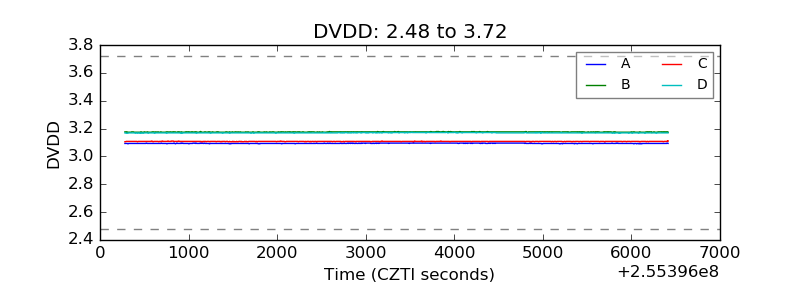 |
| Temperature 1 | 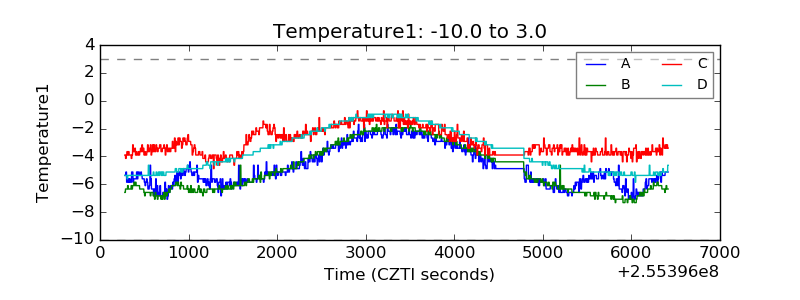 |
| Veto HV Monitor | 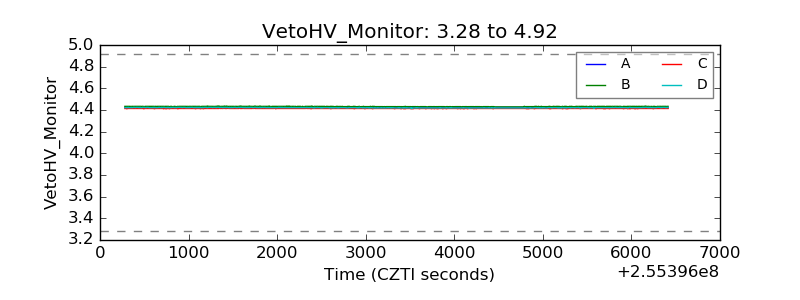 |
| Veto LLD |  |
| Alpha Counter | 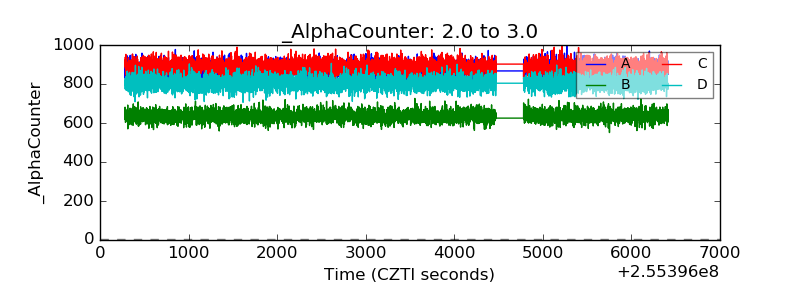 |
| _CPM_Rate | 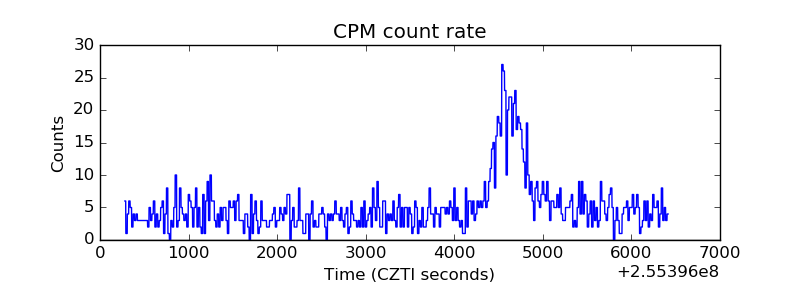 |
| CZT Counter | 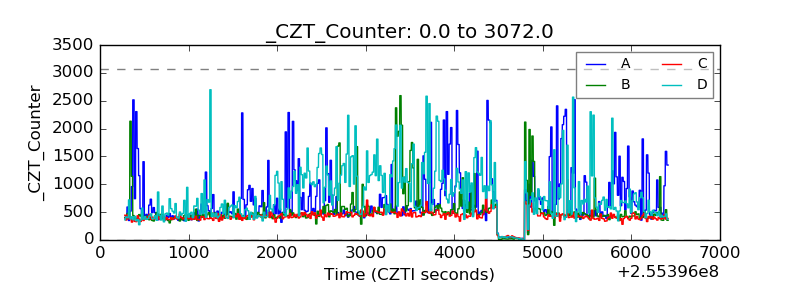 |
| +2.5 Volts monitor | 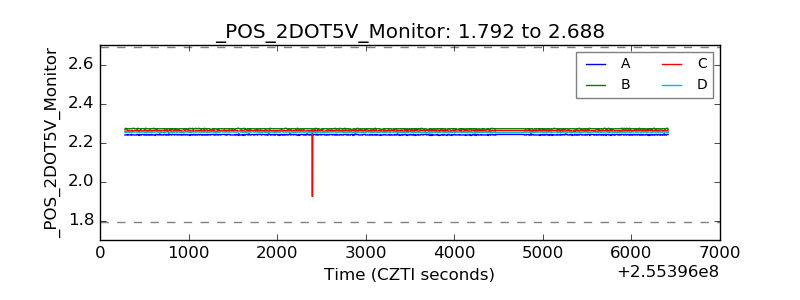 |
| +5 Volts monitor | 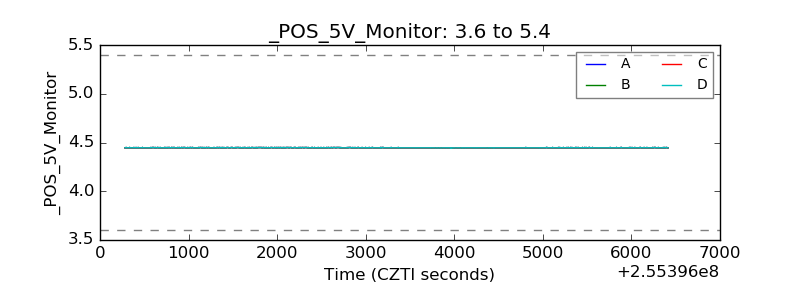 |
| _ROLL_ROT | 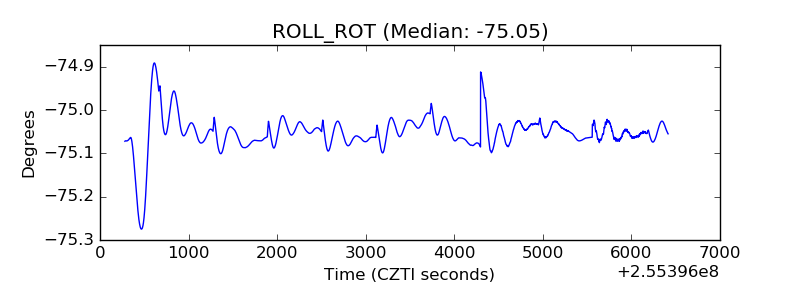 |
| _Roll_DEC | 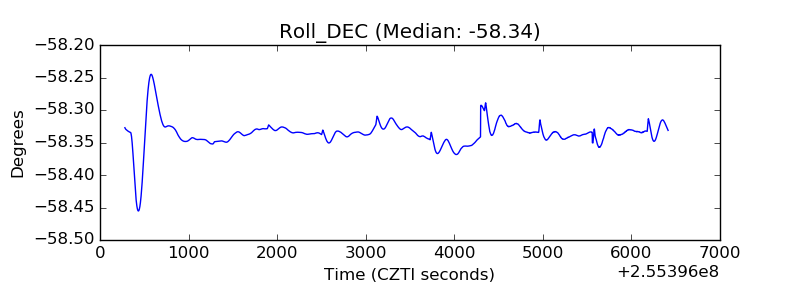 |
| _Roll_RA | 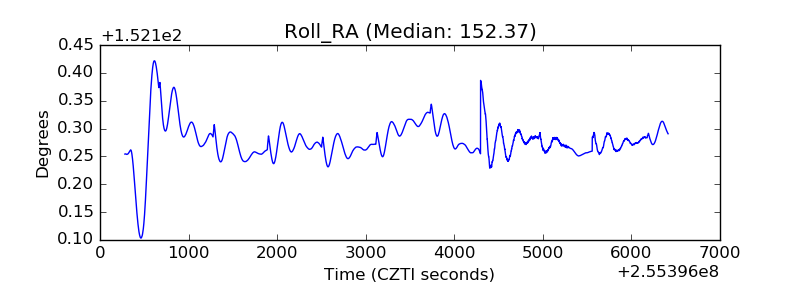 |
| Veto Counter | 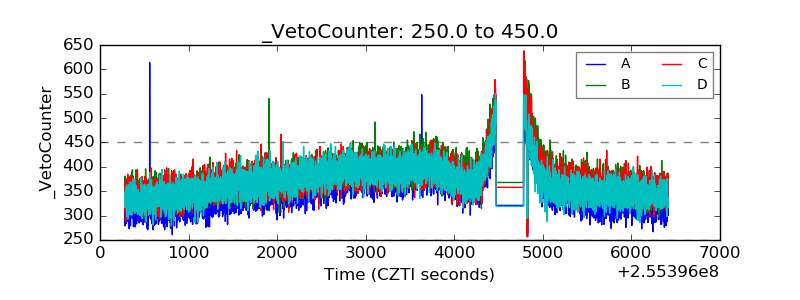 |