| Param | Original file | Final file |
|---|---|---|
| Filename | modeM0/AS1G08_021T01_9000001880_12728cztM0_level2.evt | modeM0/AS1G08_021T01_9000001880_12728cztM0_level2_quad_clean.evt |
| Size (bytes) | 568,670,400 | 107,193,600 |
| Size | 542.3 MB | 102.2 MB |
| Events in quadrant A | 4,473,908 | 701,421 |
| Events in quadrant B | 4,698,625 | 656,542 |
| Events in quadrant C | 3,158,330 | 702,333 |
| Events in quadrant D | 4,391,681 | 673,393 |
| Mode M0 | |||
|---|---|---|---|
| Quadrant | BADHDUFLAG | Total packets | Discarded packets |
| A | 0 | 18378 | 2 |
| B | 0 | 19102 | 1 |
| C | 0 | 14878 | 1 |
| D | 0 | 18259 | 1 |
| Mode SS | |||
|---|---|---|---|
| Quadrant | BADHDUFLAG | Total packets | Discarded packets |
| A | 0 | 148 | 0 |
| B | 0 | 148 | 0 |
| C | 0 | 148 | 0 |
| D | 0 | 148 | 0 |
| Mode M9 | |||
|---|---|---|---|
| Quadrant | BADHDUFLAG | Total packets | Discarded packets |
| A | 0 | 4 | 0 |
| B | 0 | 4 | 0 |
| C | 0 | 4 | 0 |
| D | 0 | 4 | 0 |
| Quadrant | Total seconds | Saturated seconds | Saturation percentage |
|---|---|---|---|
| A | 7366 | 273 | 3.706218% |
| B | 7366 | 766 | 10.399131% |
| C | 7366 | 54 | 0.733098% |
| D | 7366 | 121 | 1.642683% |
Noise dominated data is calculated using 1-second bins in cleaned event files. If a bin has >2000 counts, and if more than 50% of those come from <1% of pixels, then it is considered to be noise-dominated and hence unusable.
| Quadrant | # 1 sec bins | Bins with >0 counts | Bins with >2000 counts | High rate bins dominated by noise | Noise dominated (total time) | Noise dominated (detector-on time) | Marked lightcurve |
|---|---|---|---|---|---|---|---|
| A | 7697 | 7368 | 216 | 216 | 2.81% | 2.93% | 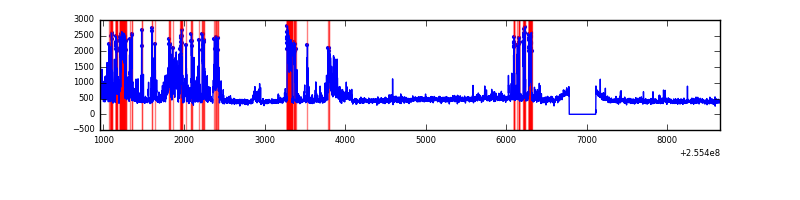 |
| B | 7697 | 7368 | 436 | 436 | 5.66% | 5.92% | 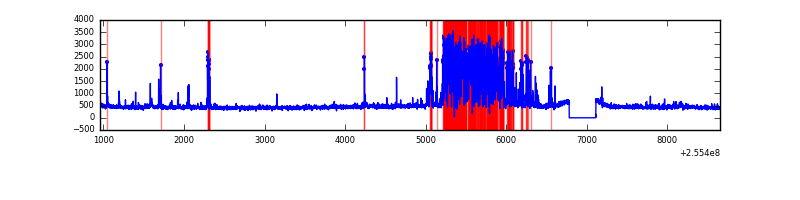 |
| C | 7697 | 7368 | 0 | 0 | 0.00% | 0.00% | 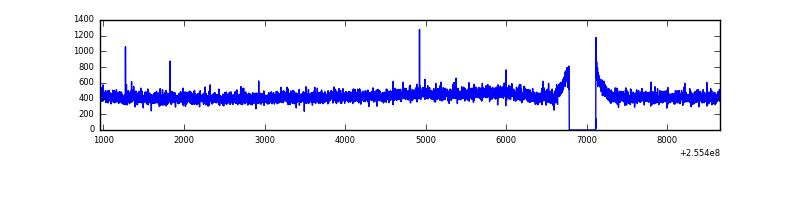 |
| D | 7697 | 7368 | 76 | 76 | 0.99% | 1.03% | 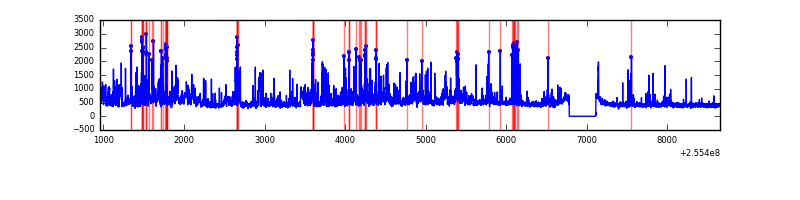 |
Top three noisy pixels from each quadrant. If the there are fewer than three noisy pixels in the level2.evt file, extra rows are filled as -1
| Pixel properties | Quadrant properties | ||||||
|---|---|---|---|---|---|---|---|
| Quadrant | DetID | PixID | Counts | Sigma | Mean | Median | Sigma |
| A | 15 | 239 | 1290513 | 7728.01 | 822 | 804 | 166.9 |
| A | 12 | 189 | 10555 | 58.43 | 822 | 804 | 166.9 |
| A | 8 | 15 | 9282 | 50.8 | 822 | 804 | 166.9 |
| B | 4 | 239 | 1568370 | 10779.59 | 775 | 754 | 145.4 |
| B | 0 | 214 | 37350 | 251.65 | 775 | 754 | 145.4 |
| B | 12 | 111 | 17255 | 113.47 | 775 | 754 | 145.4 |
| C | 13 | 61 | 5870 | 27.03 | 808 | 811 | 187.1 |
| C | 12 | 4 | 2812 | 10.69 | 808 | 811 | 187.1 |
| C | 9 | 221 | 2636 | 9.75 | 808 | 811 | 187.1 |
| D | 1 | 52 | 758041 | 4048.26 | 792 | 770 | 187.1 |
| D | 10 | 199 | 182999 | 974.17 | 792 | 770 | 187.1 |
| D | 8 | 195 | 149046 | 792.66 | 792 | 770 | 187.1 |
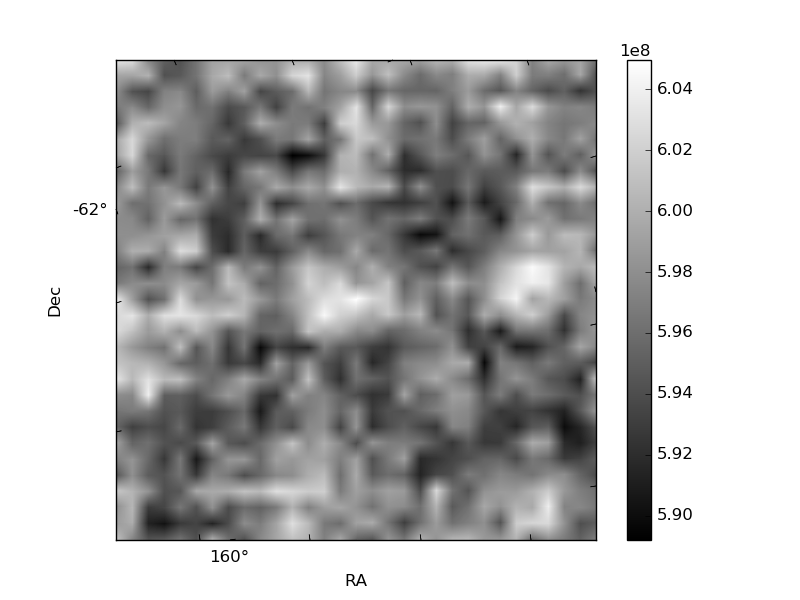
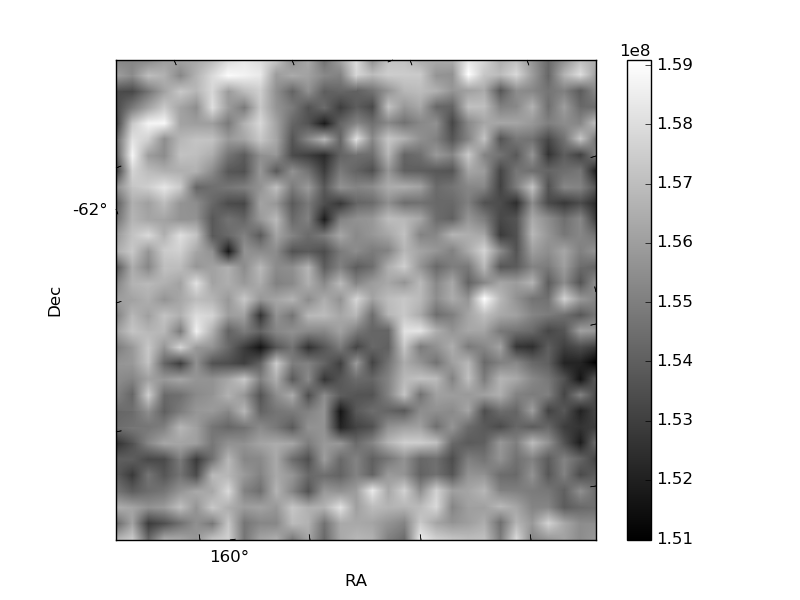
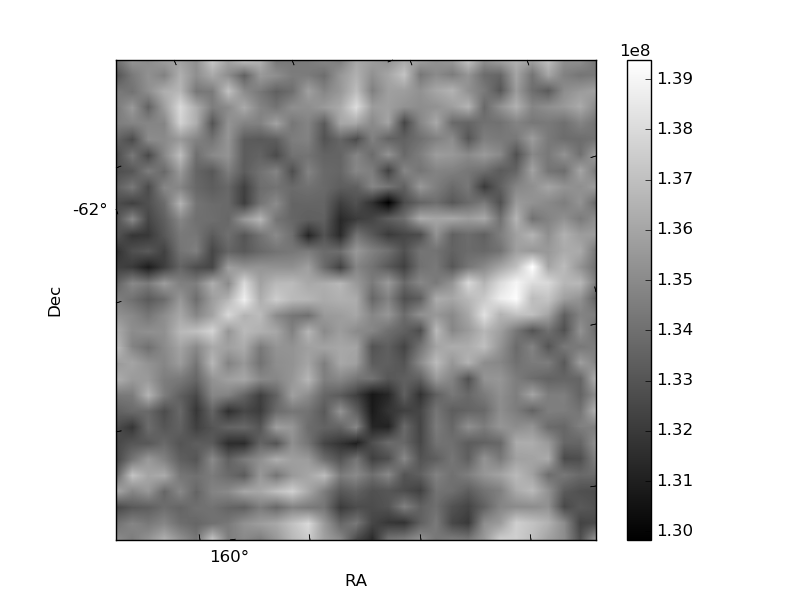
Histogram calculated using DETX and DETY for each event in the final _common_clean file
| Quadrant A | 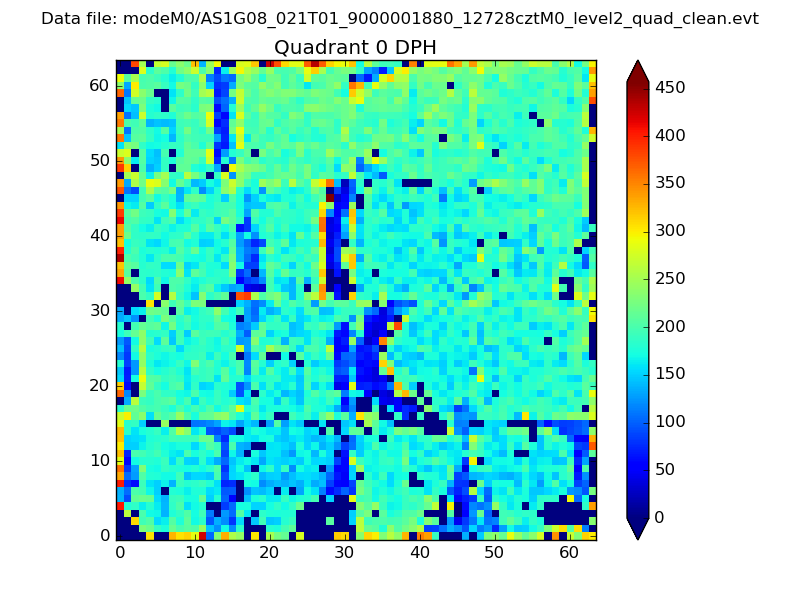 |
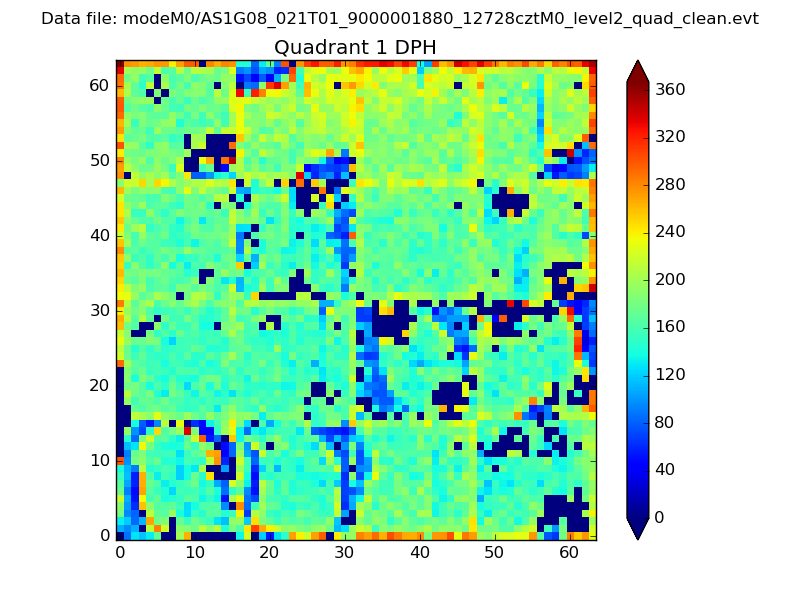 |
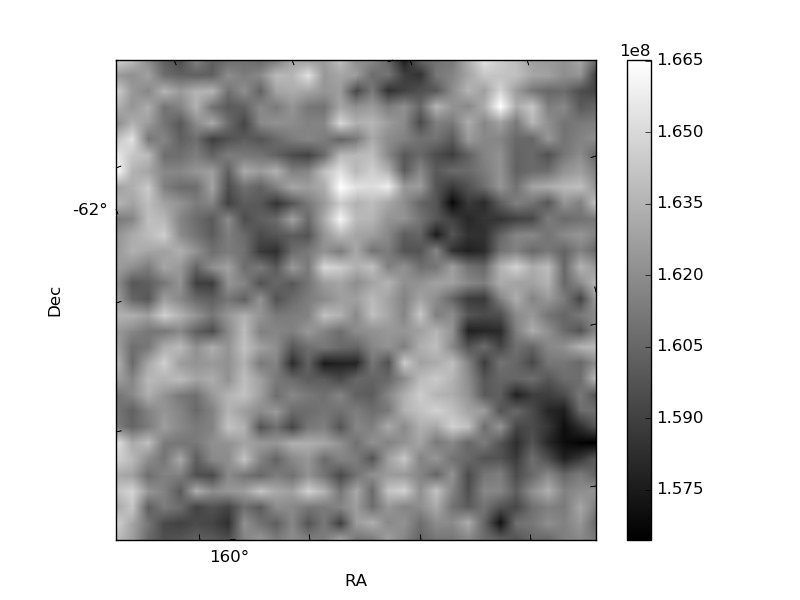
Quadrant B |
|---|---|---|---|
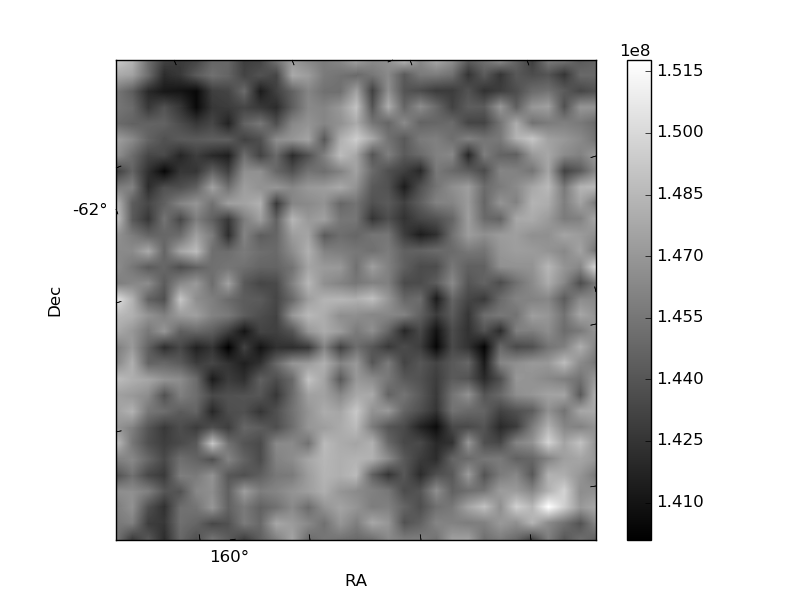
| Quadrant D | 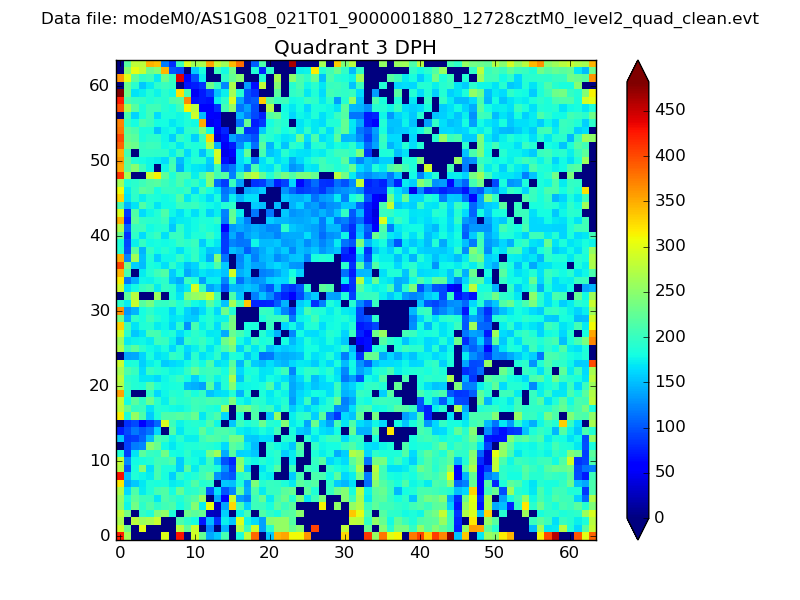 |
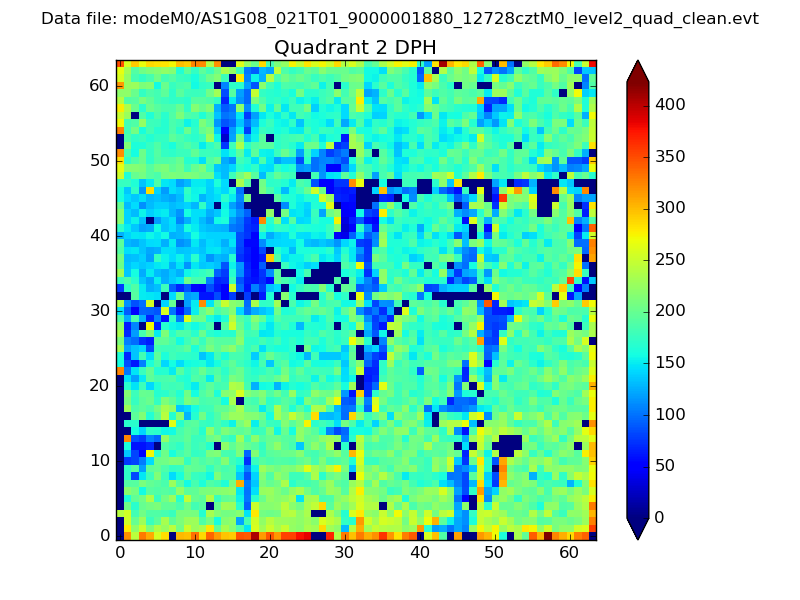 |
Quadrant C |
| Plot type | Count rate plots | Images |
|---|---|---|
| Comparison with Poisson distribution Blue bars denote a histogram of data divided into 1 sec bins. Red curve is a Poisson curve with rate = median count rate of data. |
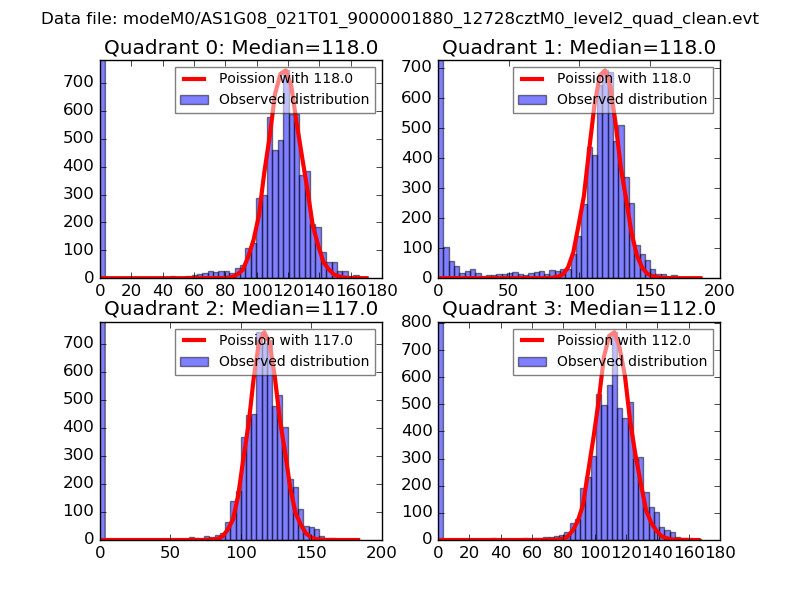 |
 |
| Quadrant-wise count rates Data is divided into 100 sec bins |
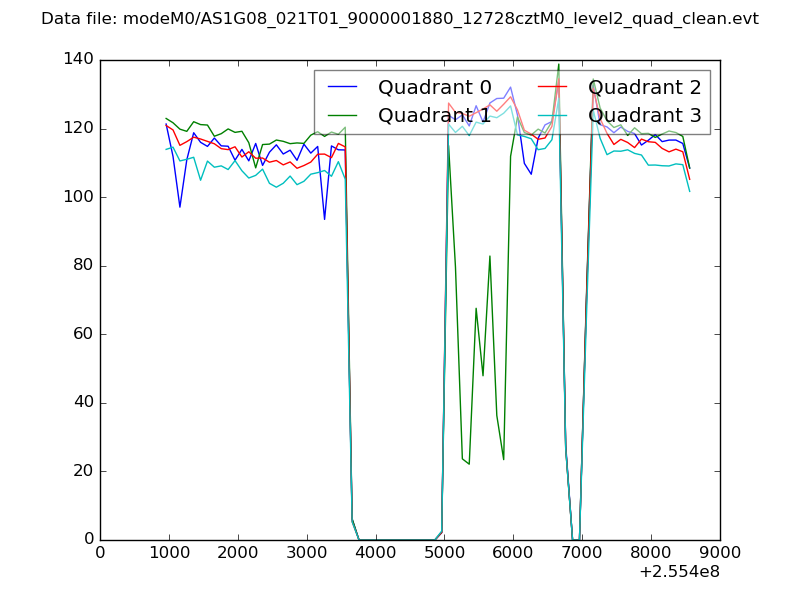 |
|
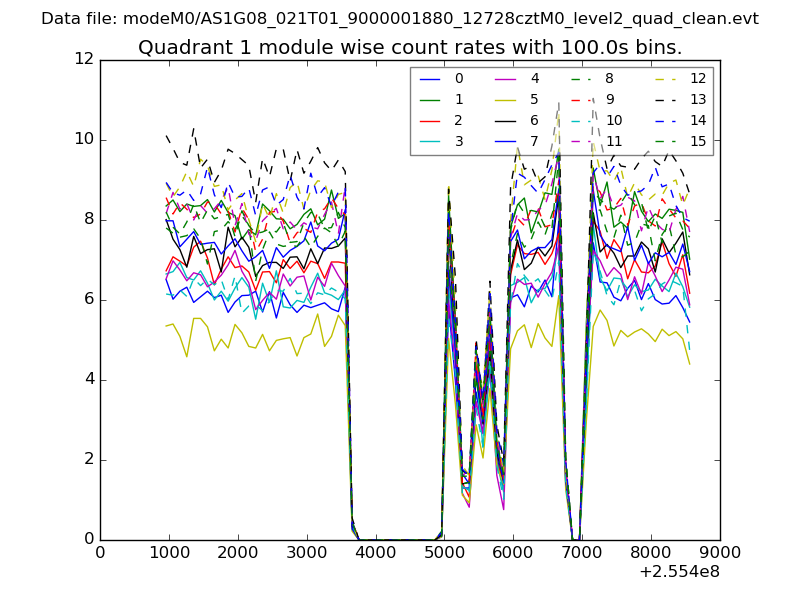
| Module-wise count rates for Quadrant A Data is divided into 100 sec bins |
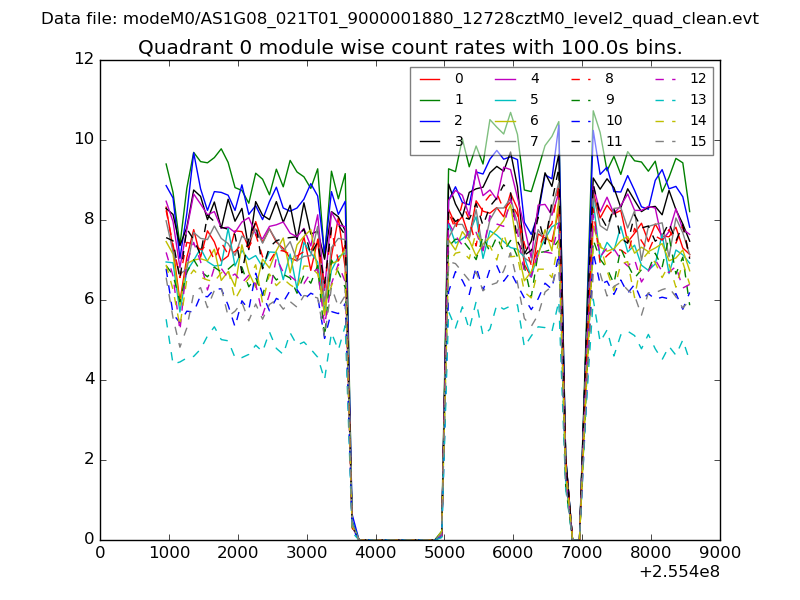 |
 |
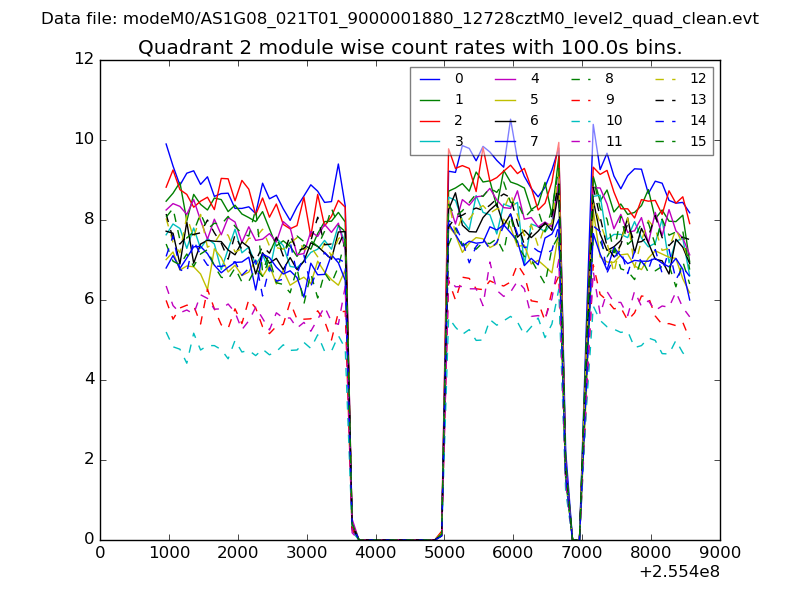
| Module-wise count rates for Quadrant B Data is divided into 100 sec bins |
 |
 |
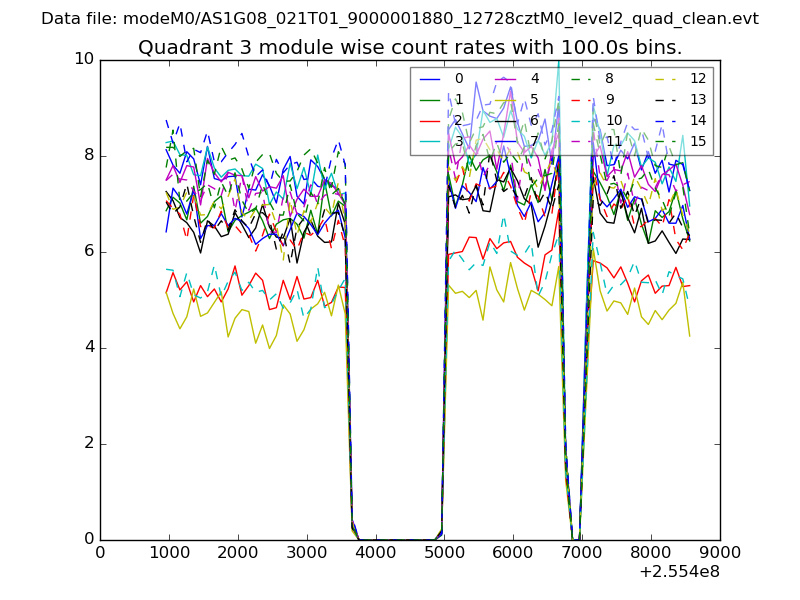
| Module-wise count rates for Quadrant C Data is divided into 100 sec bins |
 |
 |
| Module-wise count rates for Quadrant D Data is divided into 100 sec bins |
 |
 |
| Parameter | Plot |
|---|---|
| CZT HV Monitor | 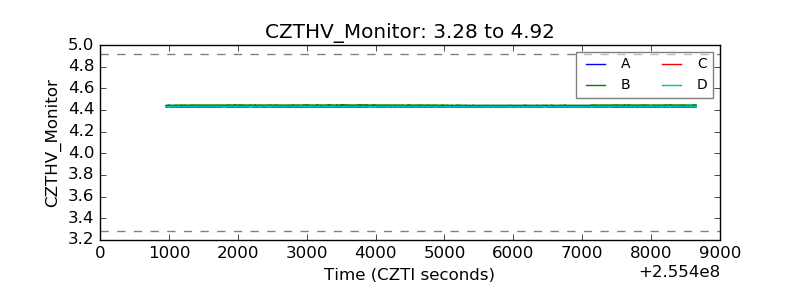 |
| D_VDD | 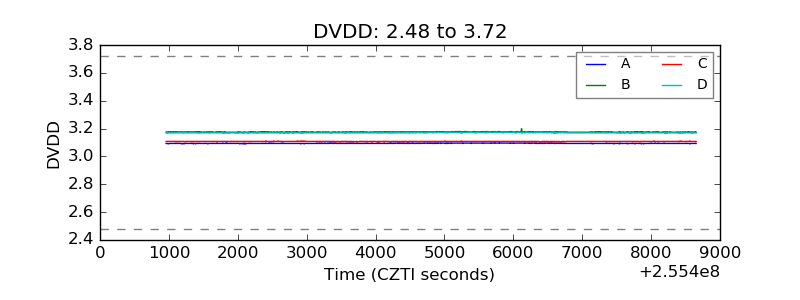 |
| Temperature 1 | 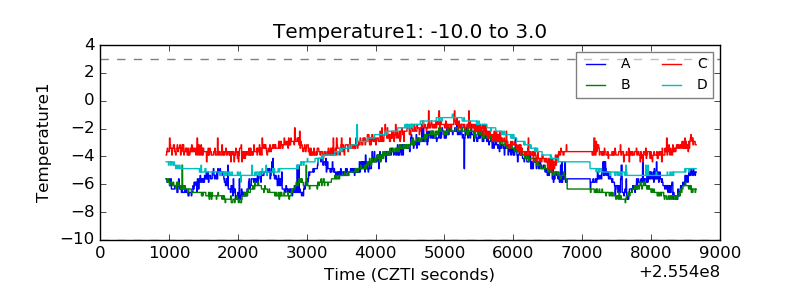 |
| Veto HV Monitor | 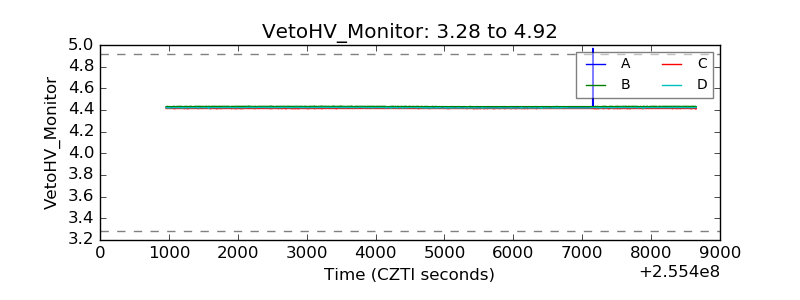 |
| Veto LLD | 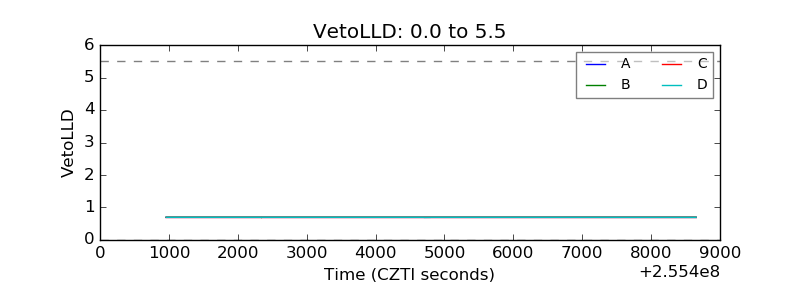 |
| Alpha Counter | 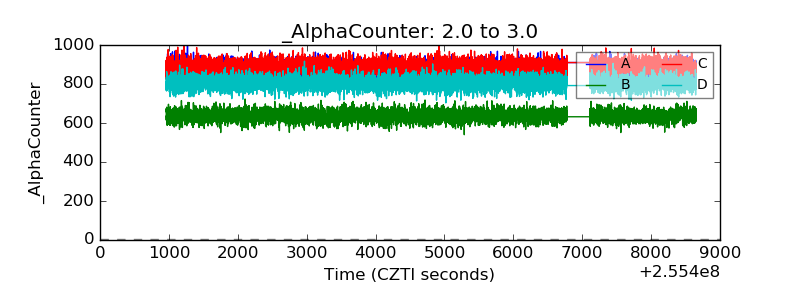 |
| _CPM_Rate |  |
| CZT Counter | 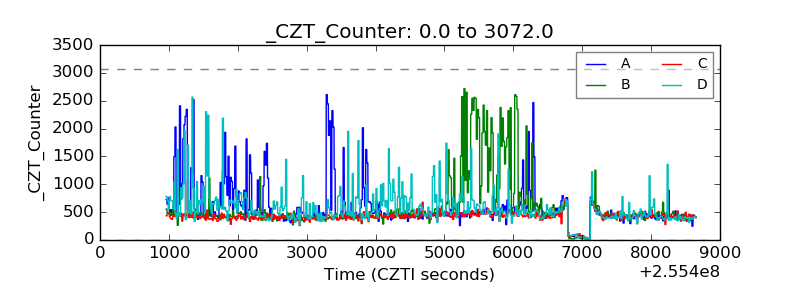 |
| +2.5 Volts monitor |  |
| +5 Volts monitor | 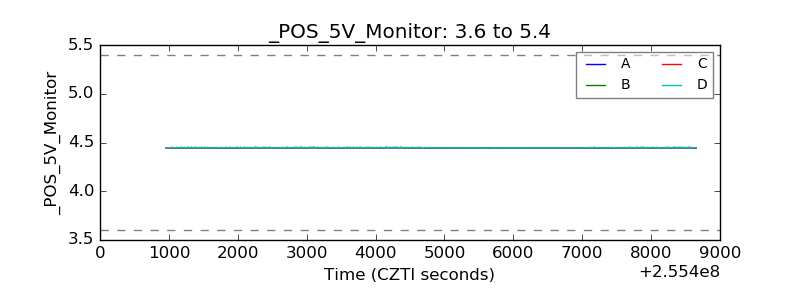 |
| _ROLL_ROT | 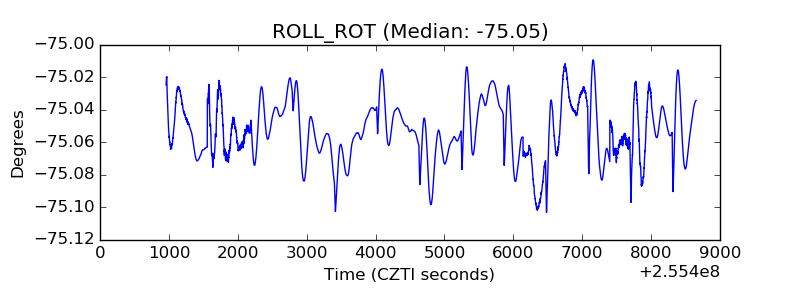 |
| _Roll_DEC | 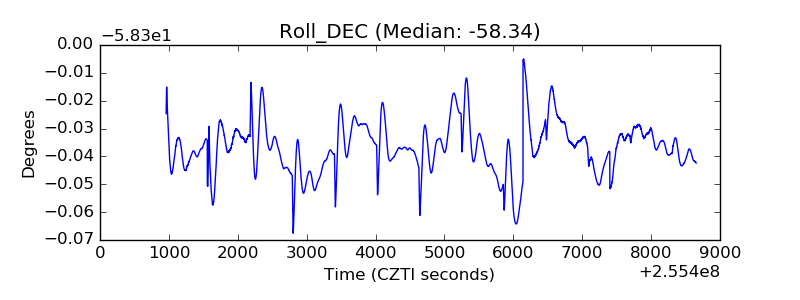 |
| _Roll_RA | 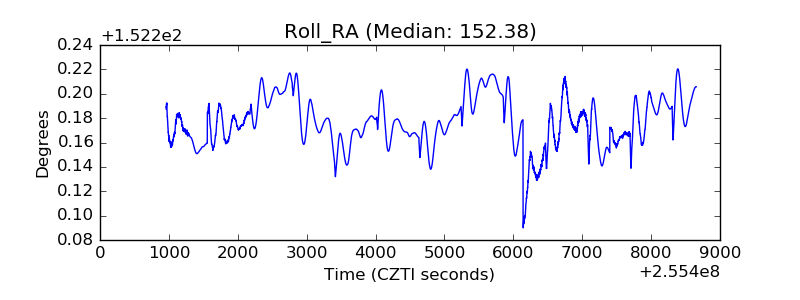 |
| Veto Counter | 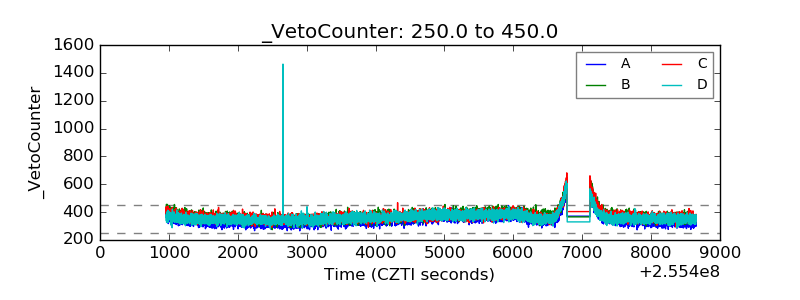 |