| Param | Original file | Final file |
|---|---|---|
| Filename | modeM0/AS1G08_021T01_9000001880_12731cztM0_level2.evt | modeM0/AS1G08_021T01_9000001880_12731cztM0_level2_quad_clean.evt |
| Size (bytes) | 1,347,629,760 | 266,621,760 |
| Size | 1.3 GB | 254.3 MB |
| Events in quadrant A | 8,627,086 | 1,722,624 |
| Events in quadrant B | 11,152,024 | 1,696,109 |
| Events in quadrant C | 8,283,880 | 1,713,661 |
| Events in quadrant D | 11,472,037 | 1,640,711 |
| Mode M0 | |||
|---|---|---|---|
| Quadrant | BADHDUFLAG | Total packets | Discarded packets |
| A | 0 | 38731 | 5 |
| B | 0 | 45665 | 4 |
| C | 0 | 38322 | 4 |
| D | 0 | 47334 | 4 |
| Mode SS | |||
|---|---|---|---|
| Quadrant | BADHDUFLAG | Total packets | Discarded packets |
| A | 0 | 384 | 0 |
| B | 0 | 384 | 0 |
| C | 0 | 384 | 0 |
| D | 0 | 384 | 0 |
| Mode M9 | |||
|---|---|---|---|
| Quadrant | BADHDUFLAG | Total packets | Discarded packets |
| A | 0 | 24 | 0 |
| B | 0 | 24 | 0 |
| C | 0 | 24 | 0 |
| D | 0 | 24 | 0 |
| Quadrant | Total seconds | Saturated seconds | Saturation percentage |
|---|---|---|---|
| A | 18906 | 217 | 1.147784% |
| B | 18906 | 1048 | 5.543214% |
| C | 18906 | 185 | 0.978525% |
| D | 18906 | 702 | 3.713107% |
Noise dominated data is calculated using 1-second bins in cleaned event files. If a bin has >2000 counts, and if more than 50% of those come from <1% of pixels, then it is considered to be noise-dominated and hence unusable.
| Quadrant | # 1 sec bins | Bins with >0 counts | Bins with >2000 counts | High rate bins dominated by noise | Noise dominated (total time) | Noise dominated (detector-on time) | Marked lightcurve |
|---|---|---|---|---|---|---|---|
| A | 21232 | 18913 | 26 | 26 | 0.12% | 0.14% | 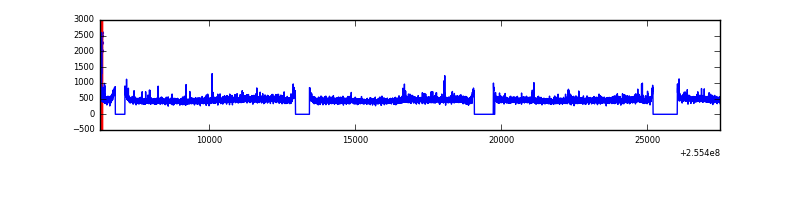 |
| B | 21232 | 18913 | 553 | 553 | 2.60% | 2.92% | 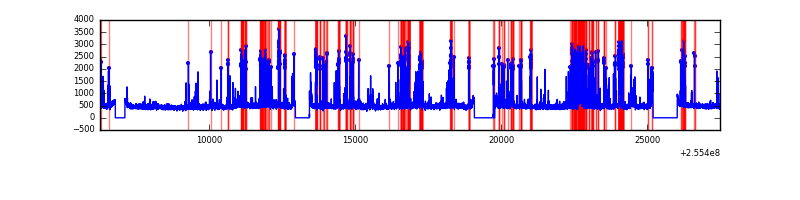 |
| C | 21232 | 18913 | 3 | 3 | 0.01% | 0.02% | 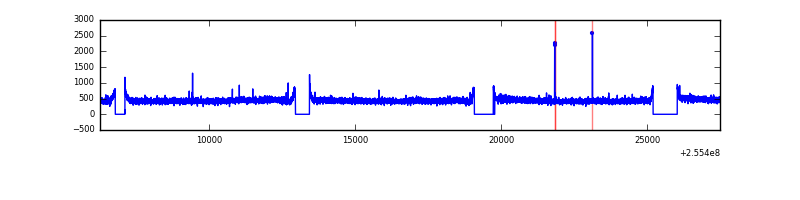 |
| D | 21232 | 18913 | 502 | 502 | 2.36% | 2.65% | 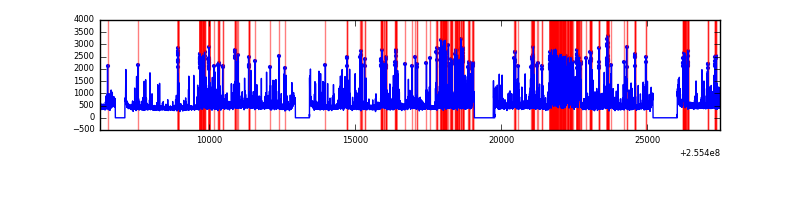 |
Top three noisy pixels from each quadrant. If the there are fewer than three noisy pixels in the level2.evt file, extra rows are filled as -1
| Pixel properties | Quadrant properties | ||||||
|---|---|---|---|---|---|---|---|
| Quadrant | DetID | PixID | Counts | Sigma | Mean | Median | Sigma |
| A | 15 | 239 | 150732 | 337.36 | 2170 | 2119 | 440.5 |
| A | 12 | 189 | 121570 | 271.16 | 2170 | 2119 | 440.5 |
| A | 0 | 226 | 19438 | 39.31 | 2170 | 2119 | 440.5 |
| B | 4 | 239 | 2470412 | 6182.87 | 2127 | 2072 | 399.2 |
| B | 0 | 214 | 105038 | 257.92 | 2127 | 2072 | 399.2 |
| B | 3 | 64 | 81004 | 197.71 | 2127 | 2072 | 399.2 |
| C | 13 | 61 | 15324 | 27.04 | 2117 | 2130 | 488.0 |
| C | 14 | 234 | 14365 | 25.07 | 2117 | 2130 | 488.0 |
| C | 15 | 208 | 9910 | 15.94 | 2117 | 2130 | 488.0 |
| D | 1 | 52 | 2070978 | 4231.57 | 2075 | 2023 | 488.9 |
| D | 10 | 199 | 701988 | 1431.62 | 2075 | 2023 | 488.9 |
| D | 2 | 136 | 384878 | 783.04 | 2075 | 2023 | 488.9 |
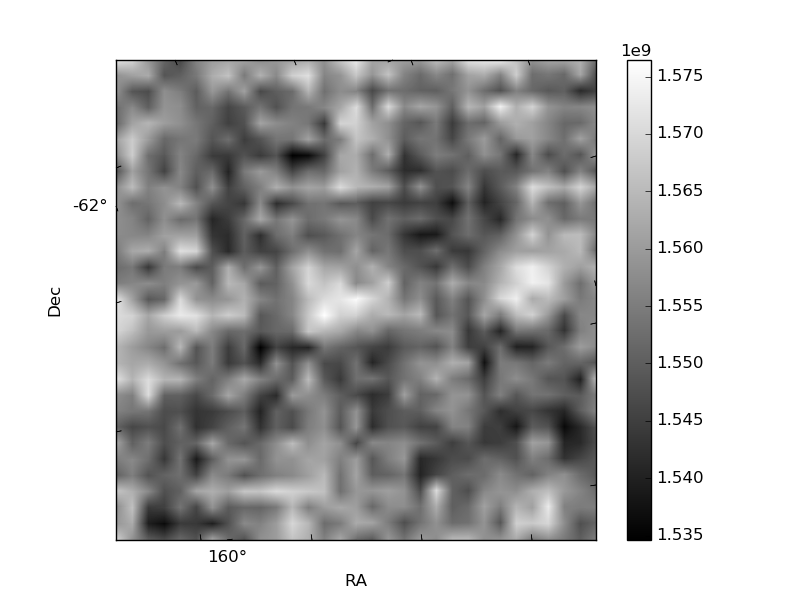
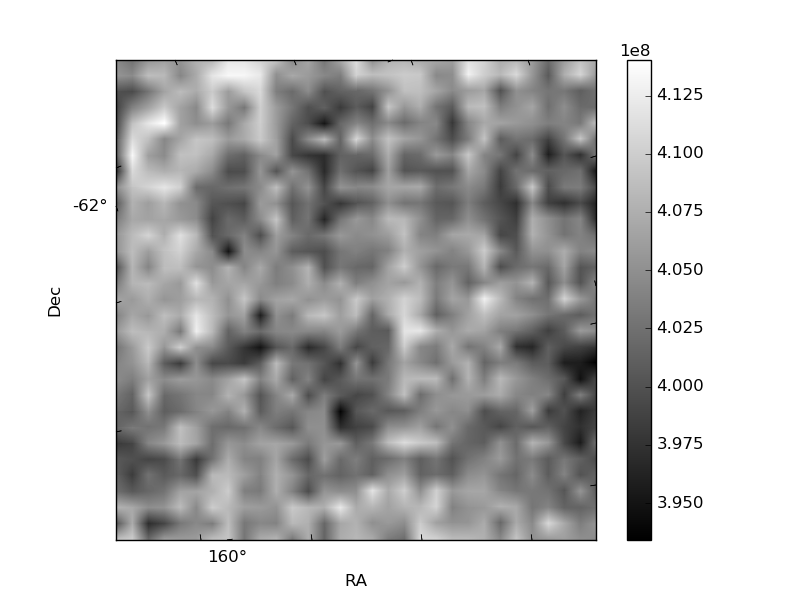
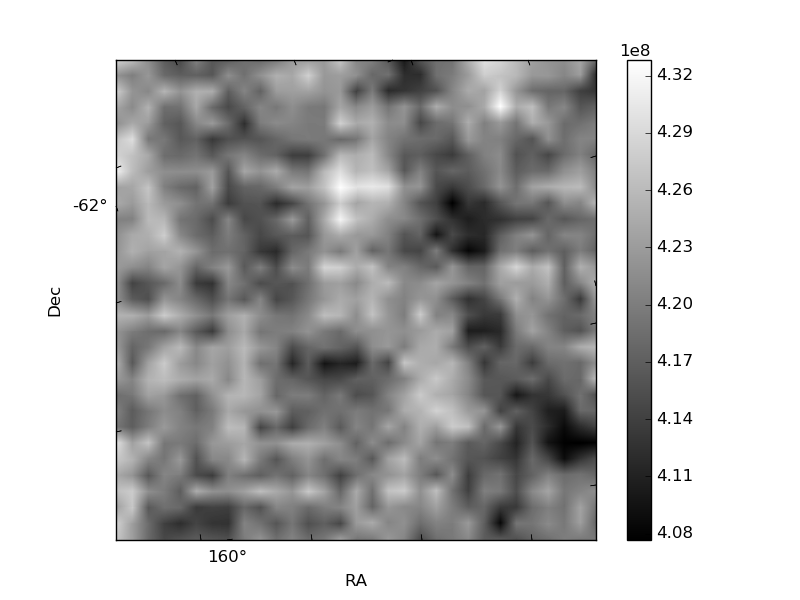
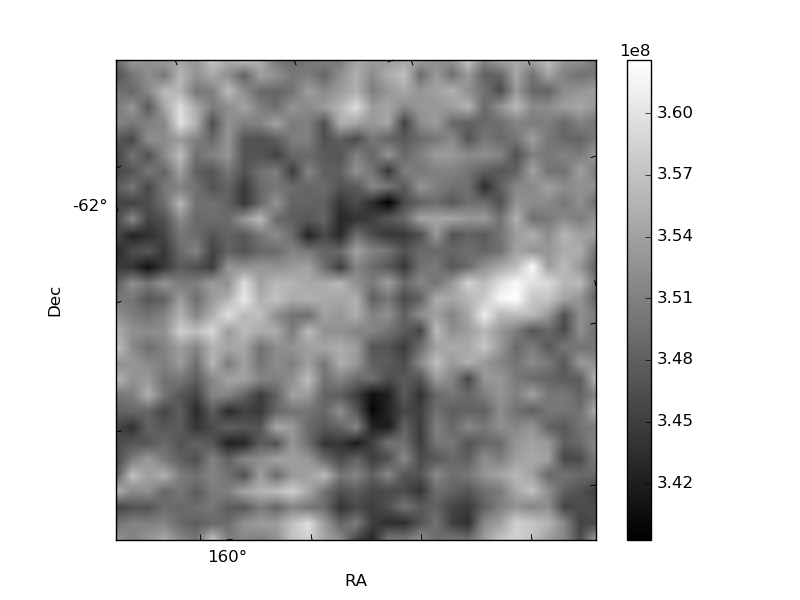
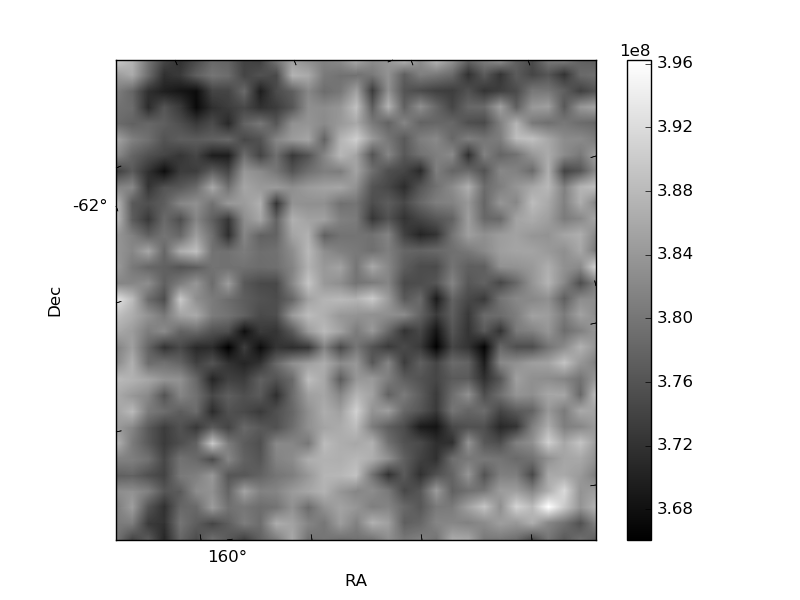
Histogram calculated using DETX and DETY for each event in the final _common_clean file
| Quadrant A | 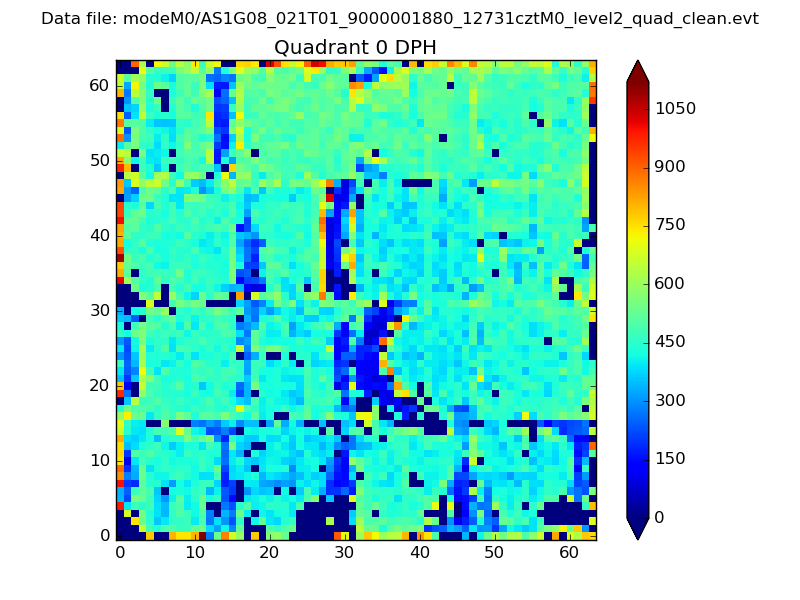 |
 |
Quadrant B |
|---|---|---|---|
| Quadrant D | 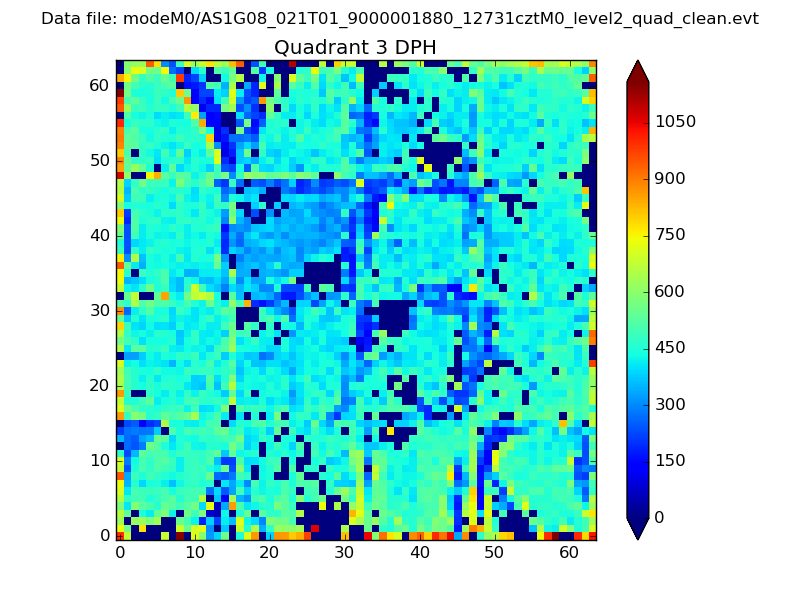 |
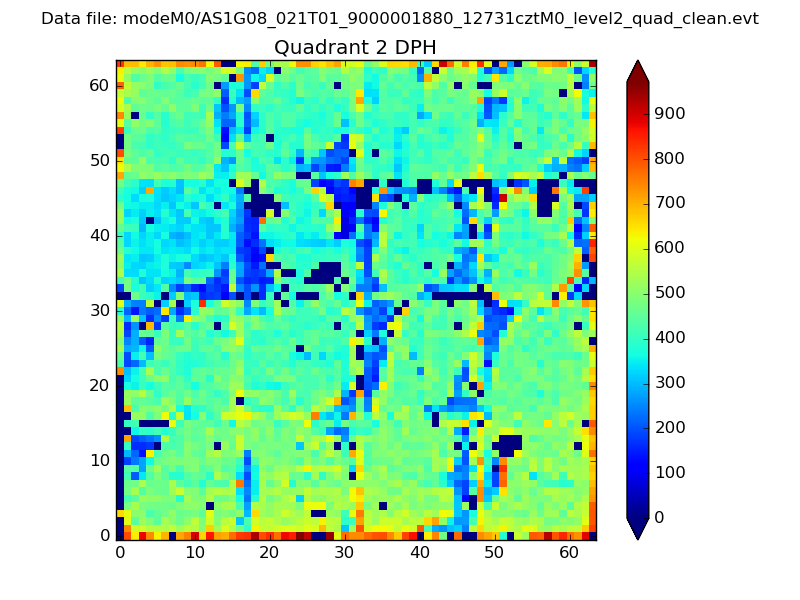 |
Quadrant C |
| Plot type | Count rate plots | Images |
|---|---|---|
| Comparison with Poisson distribution Blue bars denote a histogram of data divided into 1 sec bins. Red curve is a Poisson curve with rate = median count rate of data. |
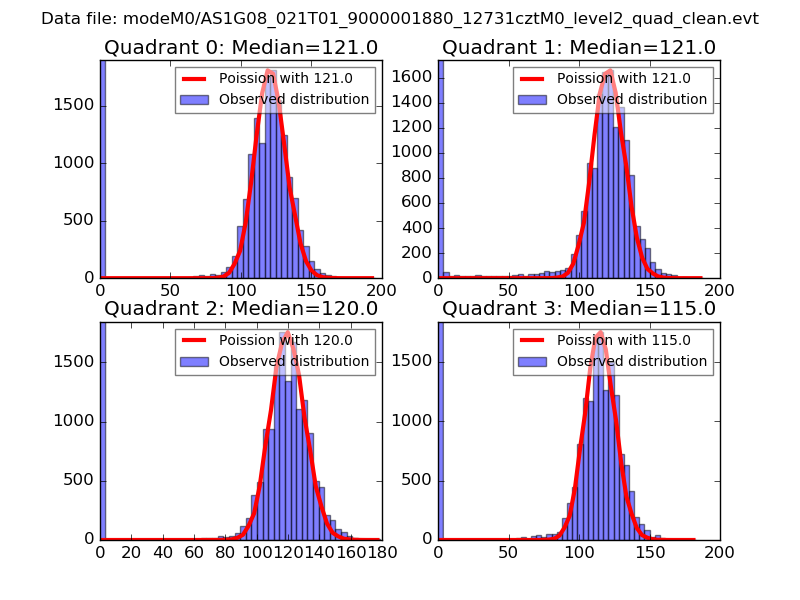 |
 |
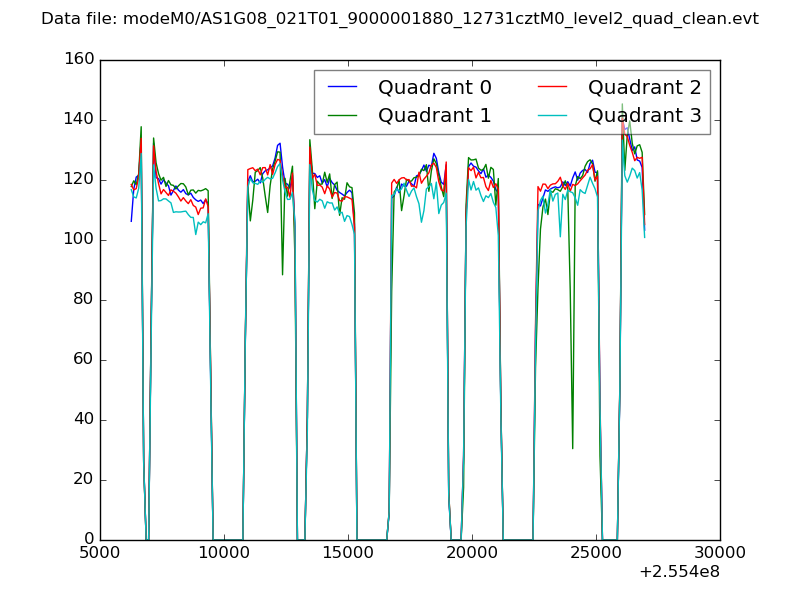
| Quadrant-wise count rates Data is divided into 100 sec bins |
 |
|
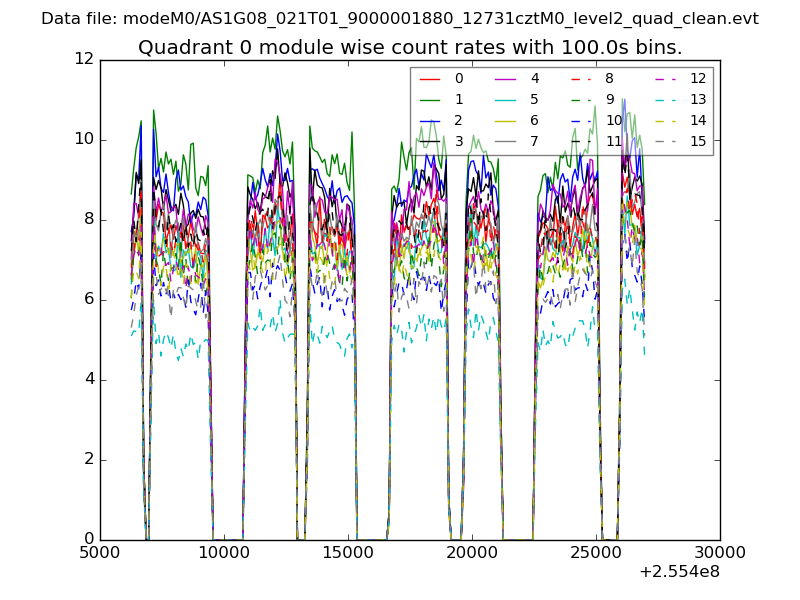
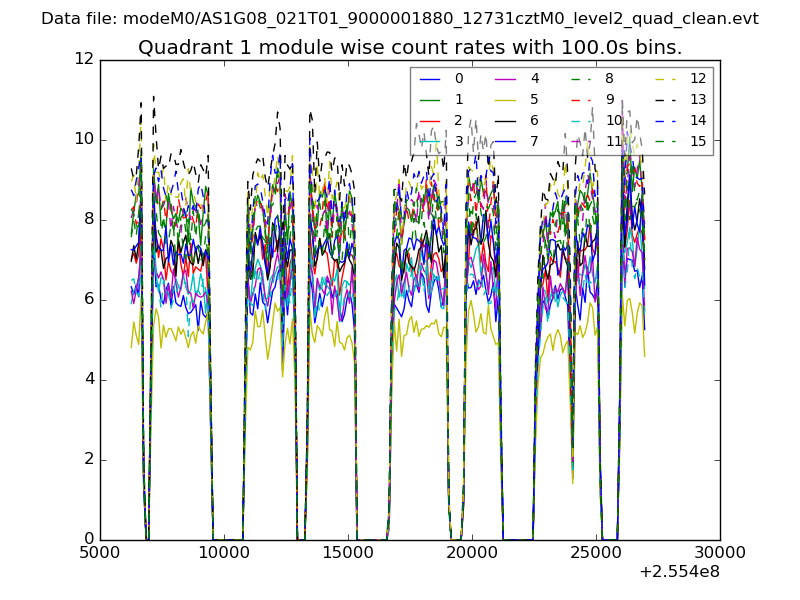
| Module-wise count rates for Quadrant A Data is divided into 100 sec bins |
 |
 |
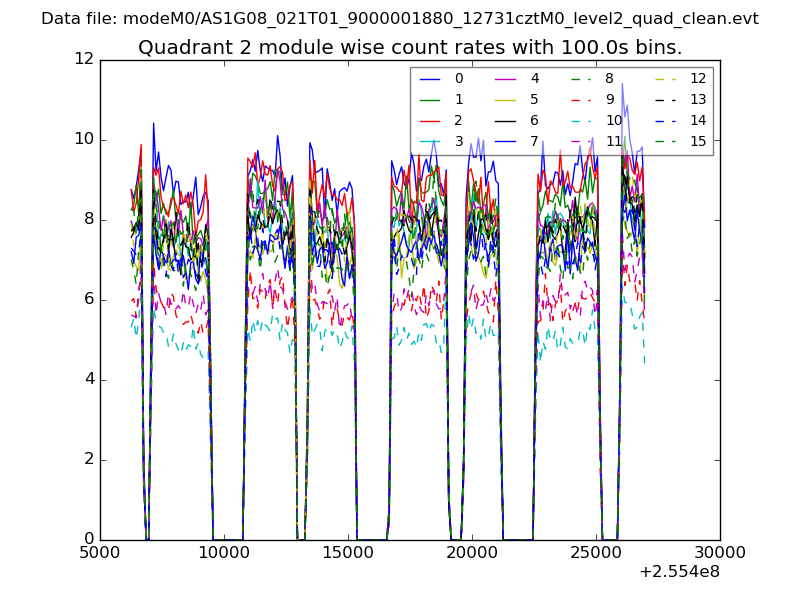
| Module-wise count rates for Quadrant B Data is divided into 100 sec bins |
 |
 |
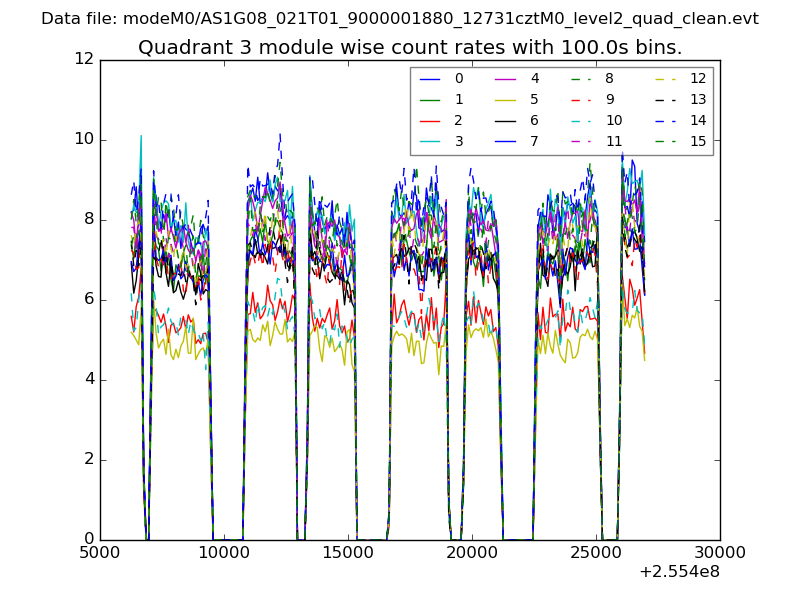
| Module-wise count rates for Quadrant C Data is divided into 100 sec bins |
 |
 |
| Module-wise count rates for Quadrant D Data is divided into 100 sec bins |
 |
 |
| Parameter | Plot |
|---|---|
| CZT HV Monitor | 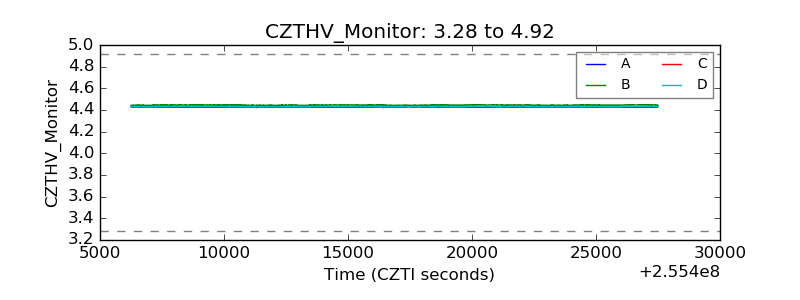 |
| D_VDD | 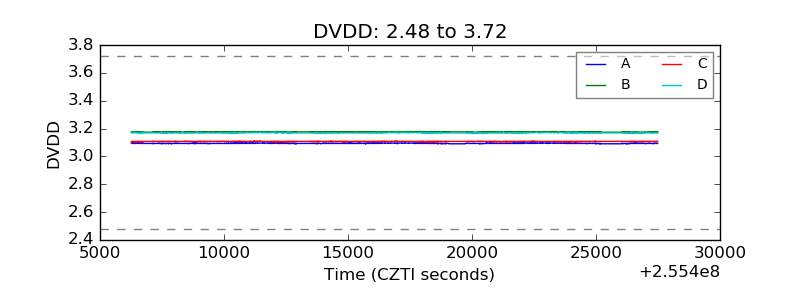 |
| Temperature 1 | 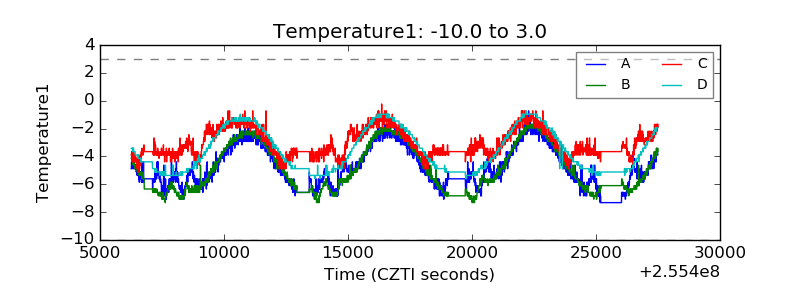 |
| Veto HV Monitor |  |
| Veto LLD | 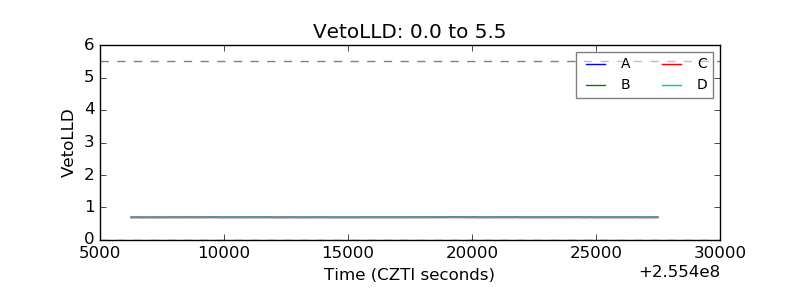 |
| Alpha Counter | 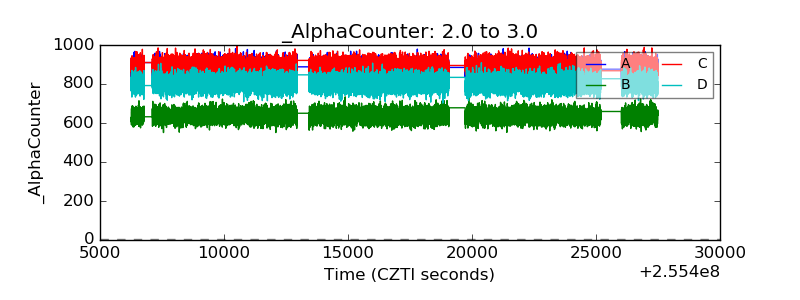 |
| _CPM_Rate | 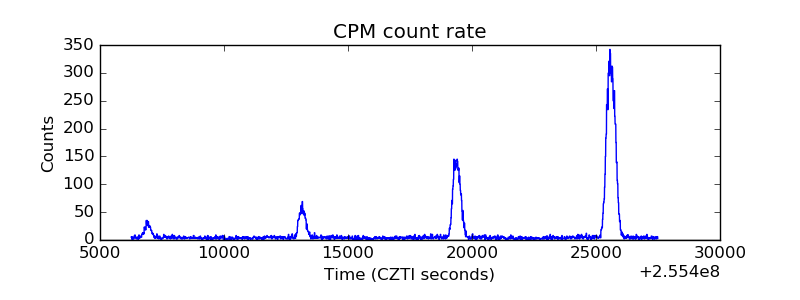 |
| CZT Counter | 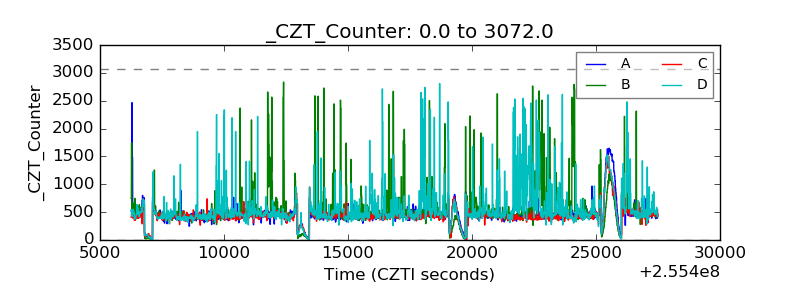 |
| +2.5 Volts monitor | 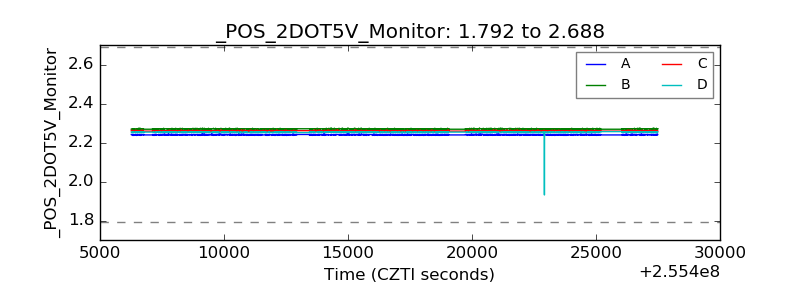 |
| +5 Volts monitor | 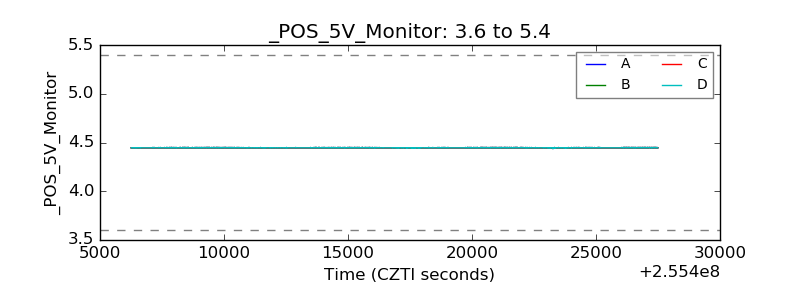 |
| _ROLL_ROT | 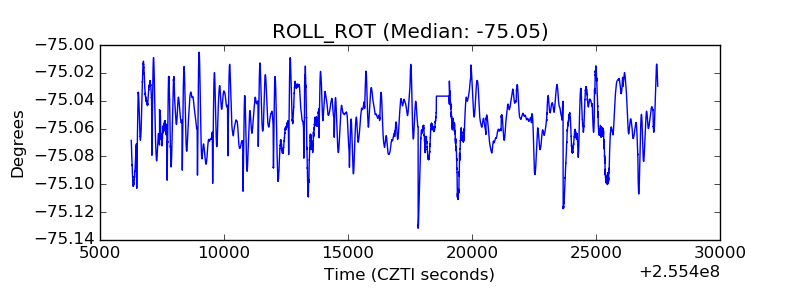 |
| _Roll_DEC | 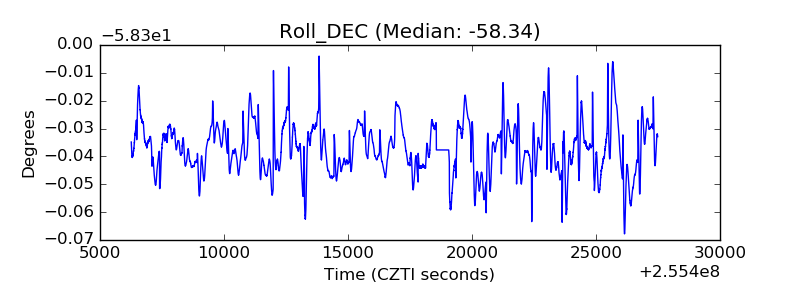 |
| _Roll_RA | 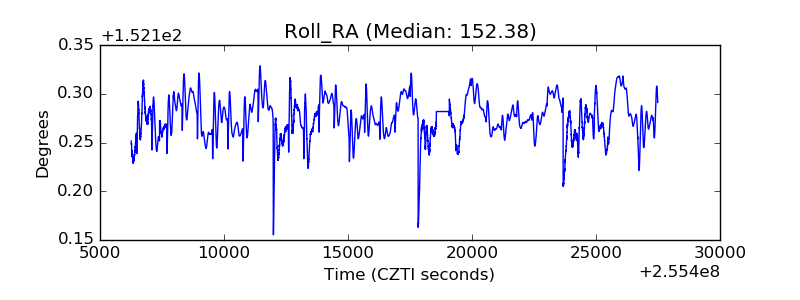 |
| Veto Counter | 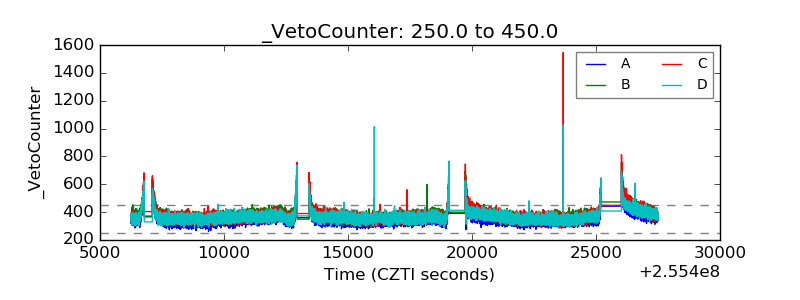 |