| Param | Original file | Final file |
|---|---|---|
| Filename | modeM0/AS1G08_021T01_9000001880_12732cztM0_level2.evt | modeM0/AS1G08_021T01_9000001880_12732cztM0_level2_quad_clean.evt |
| Size (bytes) | 534,458,880 | 78,848,640 |
| Size | 509.7 MB | 75.2 MB |
| Events in quadrant A | 2,926,262 | 506,499 |
| Events in quadrant B | 4,499,958 | 477,372 |
| Events in quadrant C | 2,758,268 | 506,445 |
| Events in quadrant D | 5,583,589 | 466,724 |
| Mode M0 | |||
|---|---|---|---|
| Quadrant | BADHDUFLAG | Total packets | Discarded packets |
| A | 0 | 12871 | 2 |
| B | 0 | 17296 | 1 |
| C | 0 | 12529 | 1 |
| D | 0 | 20765 | 1 |
| Mode SS | |||
|---|---|---|---|
| Quadrant | BADHDUFLAG | Total packets | Discarded packets |
| A | 0 | 126 | 0 |
| B | 0 | 126 | 0 |
| C | 0 | 126 | 0 |
| D | 0 | 126 | 0 |
| Mode M9 | |||
|---|---|---|---|
| Quadrant | BADHDUFLAG | Total packets | Discarded packets |
| A | 0 | 10 | 0 |
| B | 0 | 10 | 0 |
| C | 0 | 10 | 0 |
| D | 0 | 10 | 0 |
| Quadrant | Total seconds | Saturated seconds | Saturation percentage |
|---|---|---|---|
| A | 6159 | 77 | 1.250203% |
| B | 6159 | 618 | 10.034096% |
| C | 6159 | 44 | 0.714402% |
| D | 6159 | 589 | 9.563241% |
Noise dominated data is calculated using 1-second bins in cleaned event files. If a bin has >2000 counts, and if more than 50% of those come from <1% of pixels, then it is considered to be noise-dominated and hence unusable.
| Quadrant | # 1 sec bins | Bins with >0 counts | Bins with >2000 counts | High rate bins dominated by noise | Noise dominated (total time) | Noise dominated (detector-on time) | Marked lightcurve |
|---|---|---|---|---|---|---|---|
| A | 7125 | 6161 | 22 | 22 | 0.31% | 0.36% | 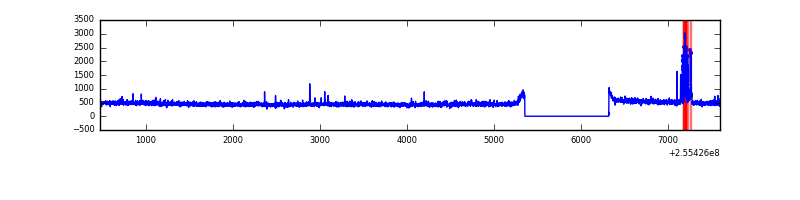 |
| B | 7125 | 6161 | 494 | 494 | 6.93% | 8.02% | 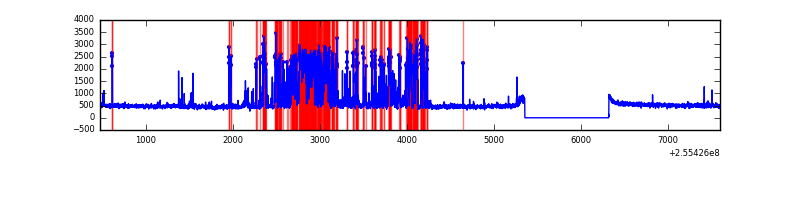 |
| C | 7125 | 6161 | 0 | 0 | 0.00% | 0.00% | 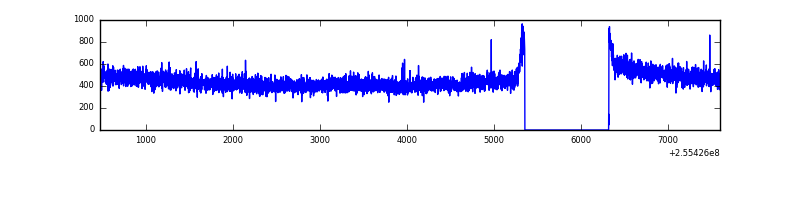 |
| D | 7125 | 6161 | 612 | 612 | 8.59% | 9.93% | 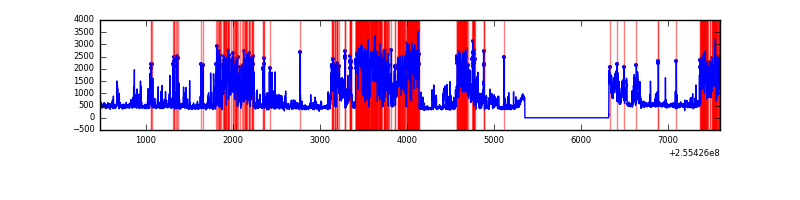 |
Top three noisy pixels from each quadrant. If the there are fewer than three noisy pixels in the level2.evt file, extra rows are filled as -1
| Pixel properties | Quadrant properties | ||||||
|---|---|---|---|---|---|---|---|
| Quadrant | DetID | PixID | Counts | Sigma | Mean | Median | Sigma |
| A | 9 | 143 | 102614 | 695.5 | 723 | 706 | 146.5 |
| A | 12 | 189 | 21995 | 145.29 | 723 | 706 | 146.5 |
| A | 15 | 239 | 13048 | 84.23 | 723 | 706 | 146.5 |
| B | 4 | 239 | 1680668 | 12817.76 | 696 | 678 | 131.1 |
| B | 0 | 214 | 21680 | 160.24 | 696 | 678 | 131.1 |
| B | 3 | 209 | 16881 | 123.62 | 696 | 678 | 131.1 |
| C | 13 | 61 | 5159 | 27.11 | 707 | 710 | 164.1 |
| C | 3 | 202 | 1724 | 6.18 | 707 | 710 | 164.1 |
| C | 15 | 208 | 1543 | 5.08 | 707 | 710 | 164.1 |
| D | 1 | 52 | 2662596 | 16419.94 | 683 | 664 | 162.1 |
| D | 10 | 199 | 207637 | 1276.7 | 683 | 664 | 162.1 |
| D | 2 | 136 | 89521 | 548.11 | 683 | 664 | 162.1 |
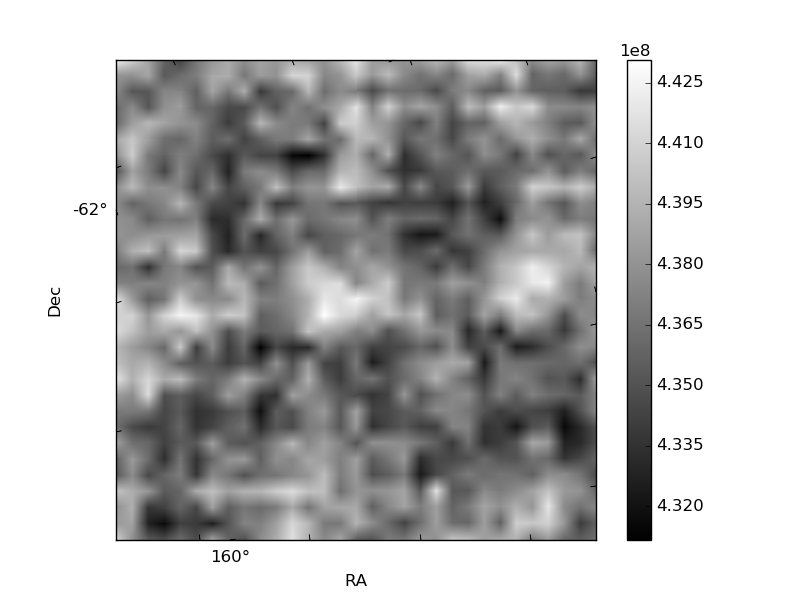
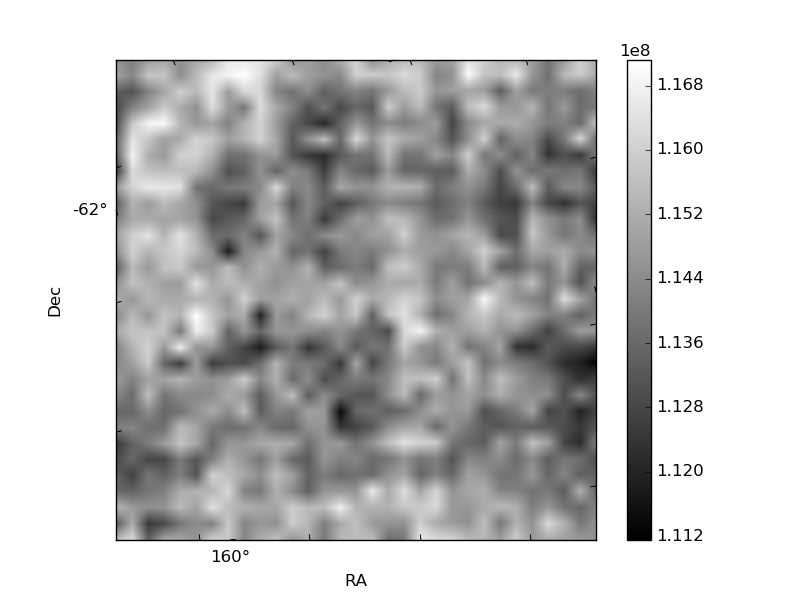
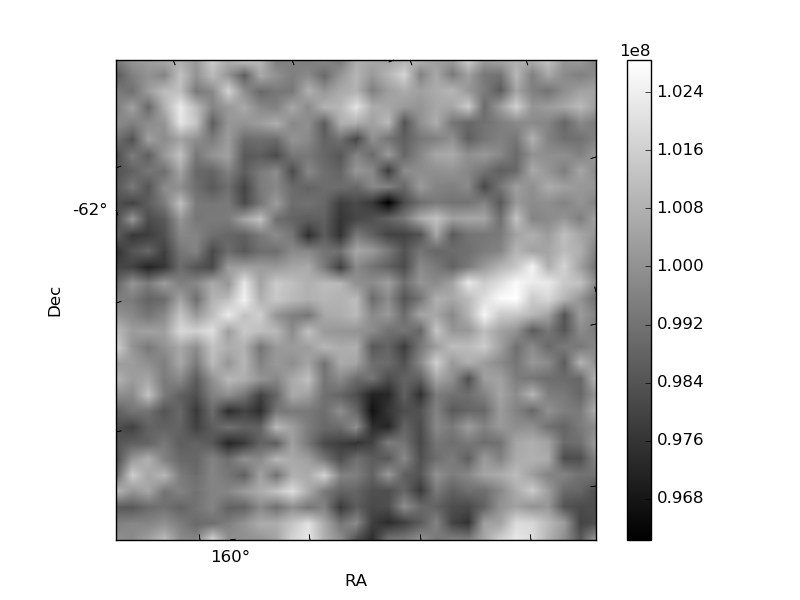
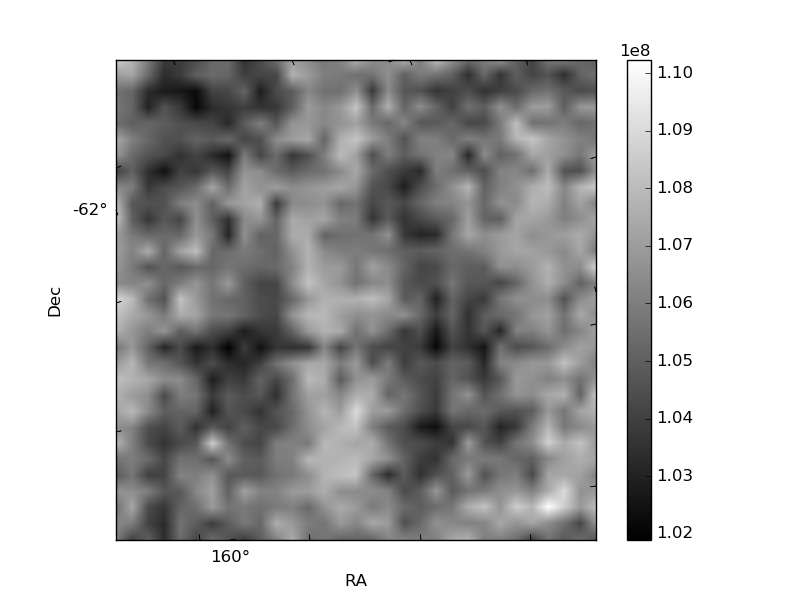
Histogram calculated using DETX and DETY for each event in the final _common_clean file
| Quadrant A | 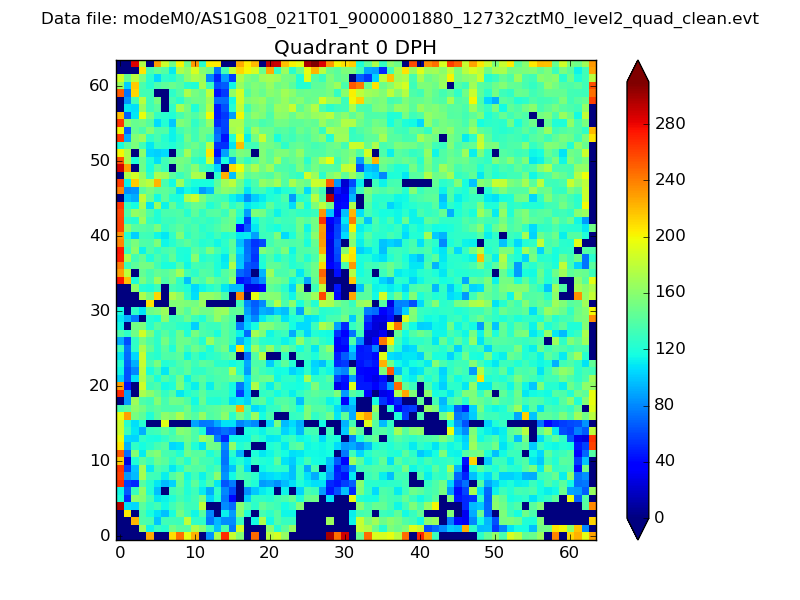 |
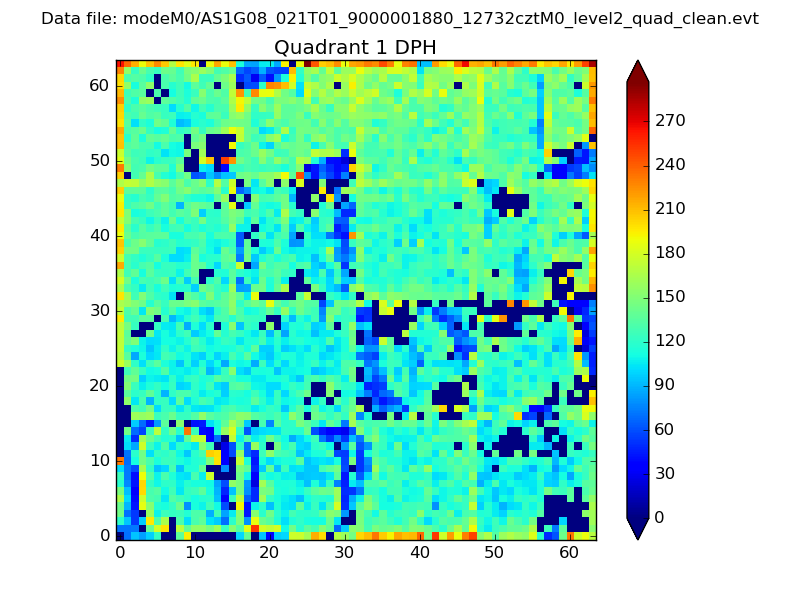 |
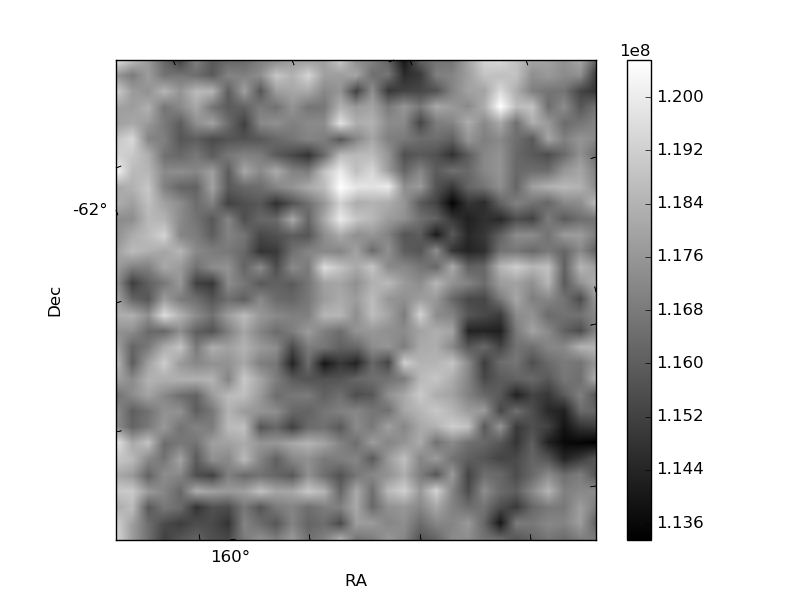
Quadrant B |
|---|---|---|---|
| Quadrant D | 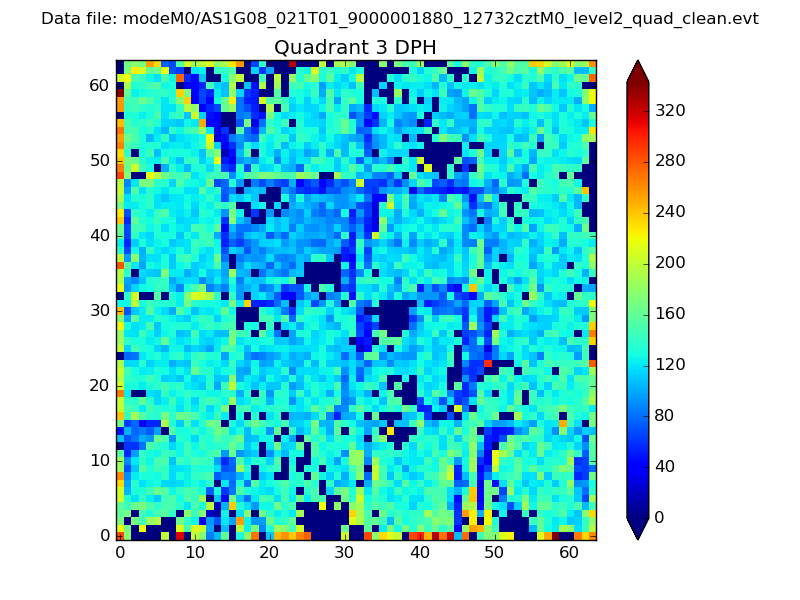 |
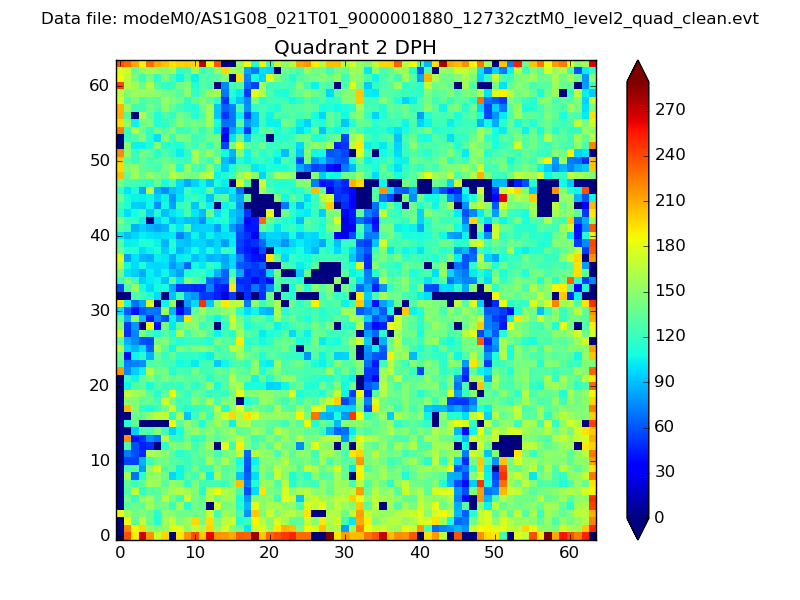 |
Quadrant C |
| Plot type | Count rate plots | Images |
|---|---|---|
| Comparison with Poisson distribution Blue bars denote a histogram of data divided into 1 sec bins. Red curve is a Poisson curve with rate = median count rate of data. |
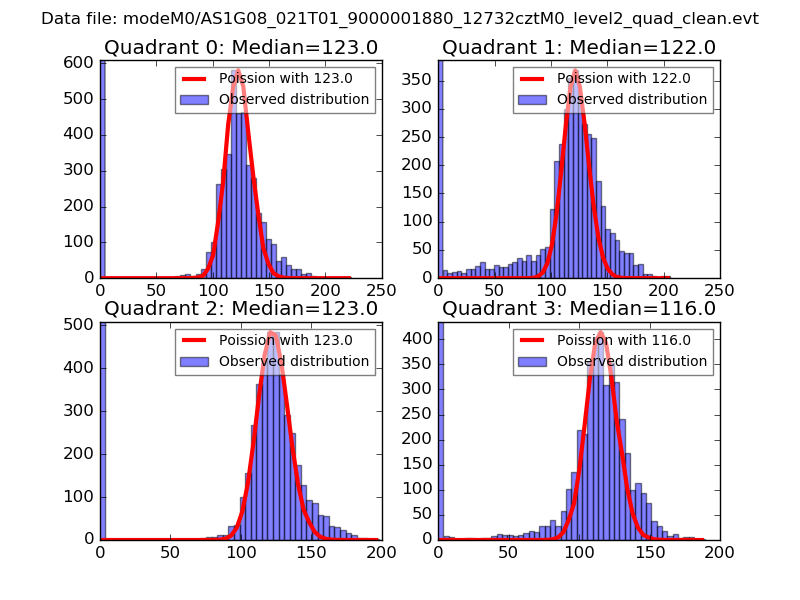 |
 |
| Quadrant-wise count rates Data is divided into 100 sec bins |
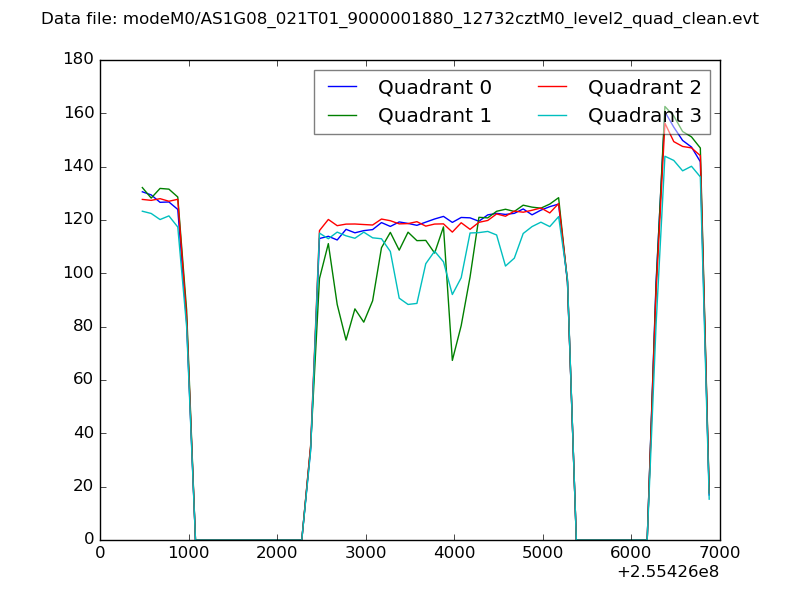 |
|
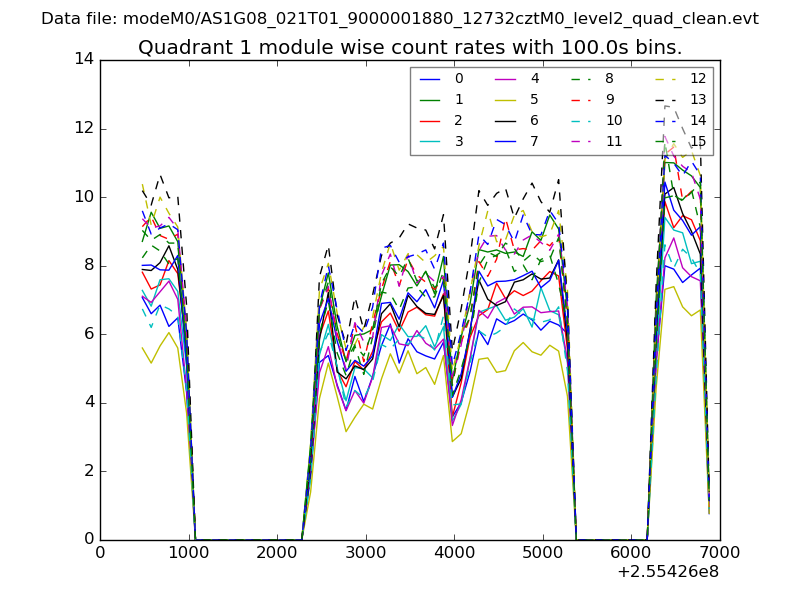
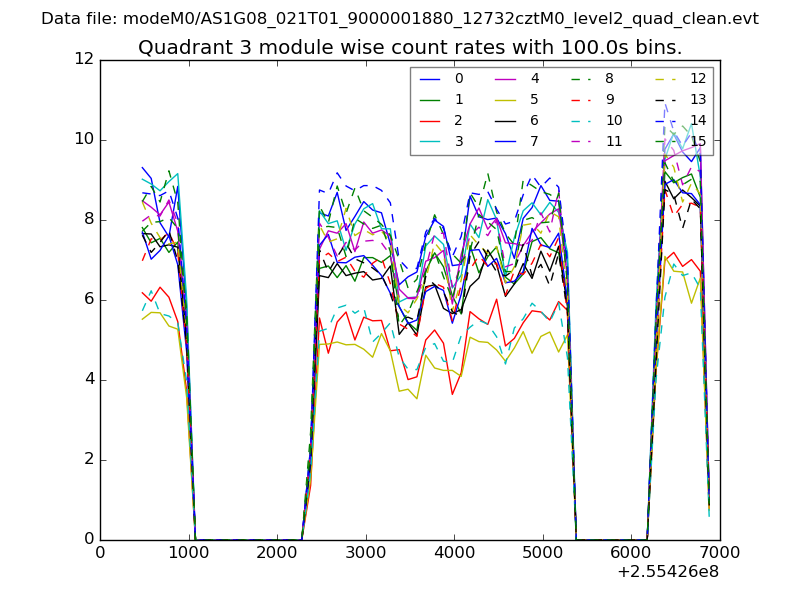
| Module-wise count rates for Quadrant A Data is divided into 100 sec bins |
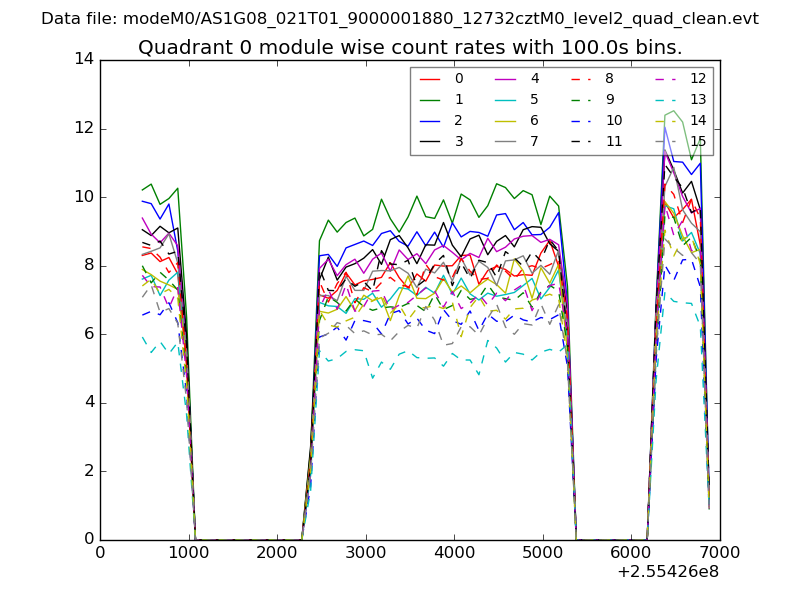 |
 |
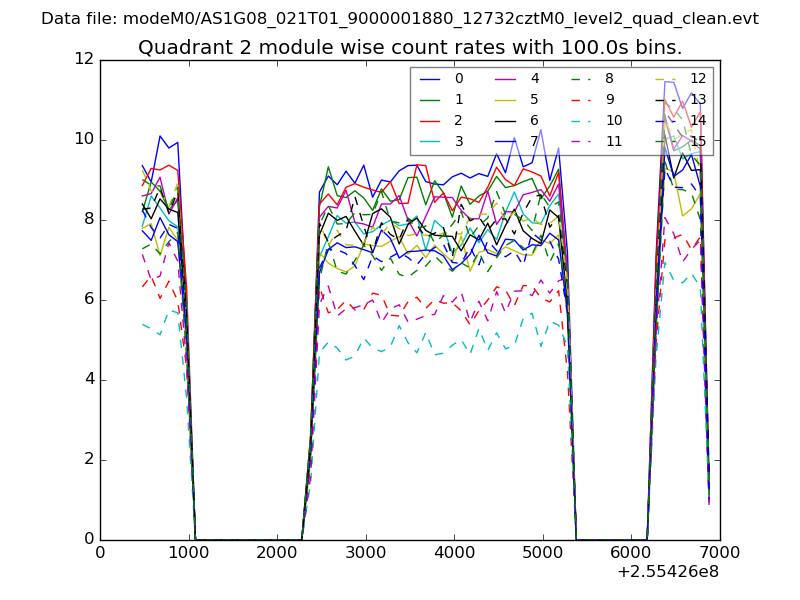
| Module-wise count rates for Quadrant B Data is divided into 100 sec bins |
 |
 |
| Module-wise count rates for Quadrant C Data is divided into 100 sec bins |
 |
 |
| Module-wise count rates for Quadrant D Data is divided into 100 sec bins |
 |
 |
| Parameter | Plot |
|---|---|
| CZT HV Monitor | 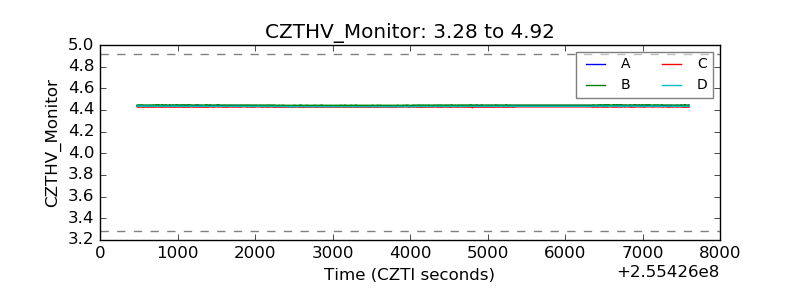 |
| D_VDD | 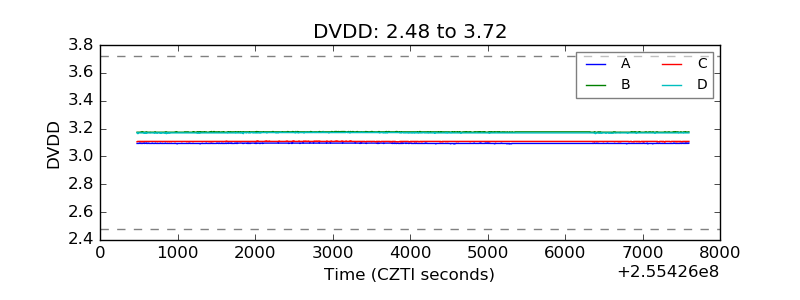 |
| Temperature 1 | 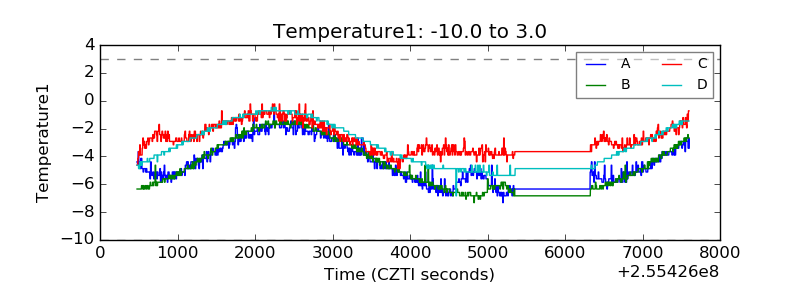 |
| Veto HV Monitor | 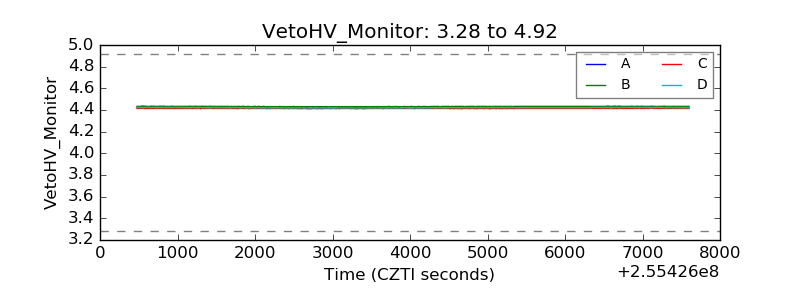 |
| Veto LLD | 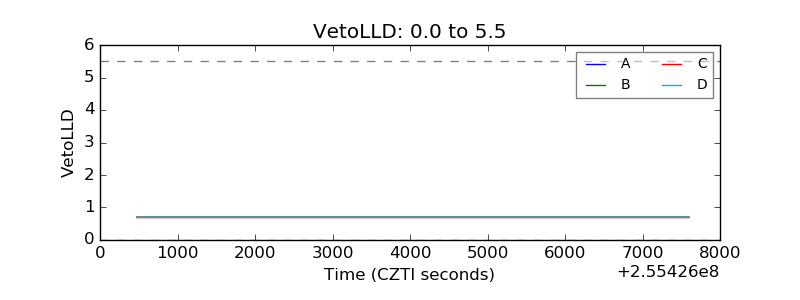 |
| Alpha Counter | 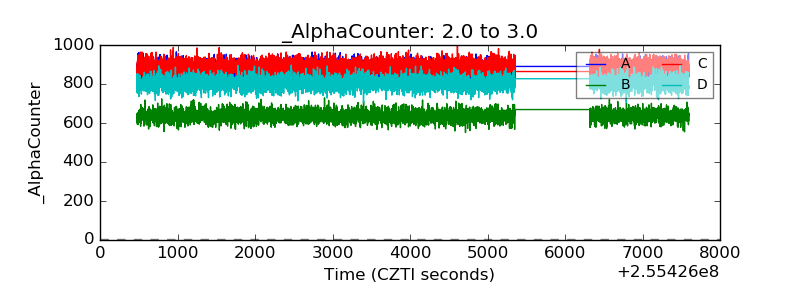 |
| _CPM_Rate | 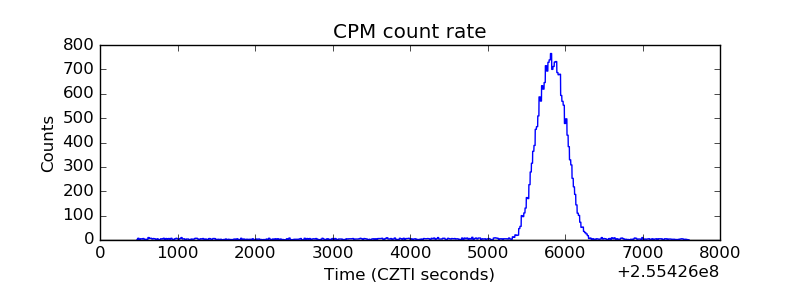 |
| CZT Counter | 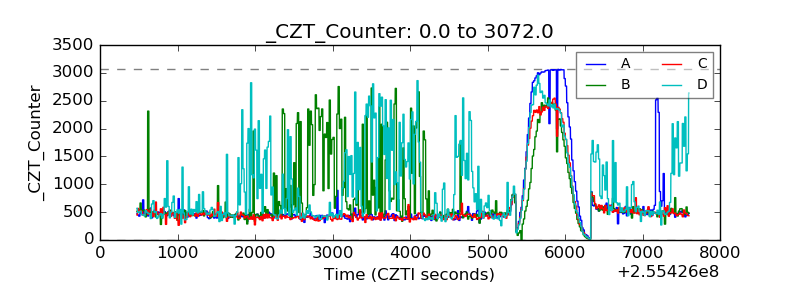 |
| +2.5 Volts monitor |  |
| +5 Volts monitor |  |
| _ROLL_ROT | 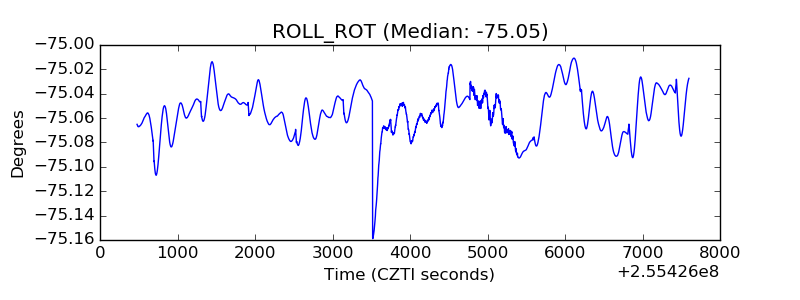 |
| _Roll_DEC |  |
| _Roll_RA | 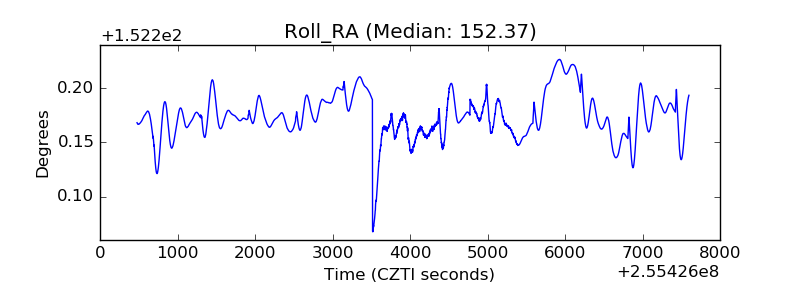 |
| Veto Counter | 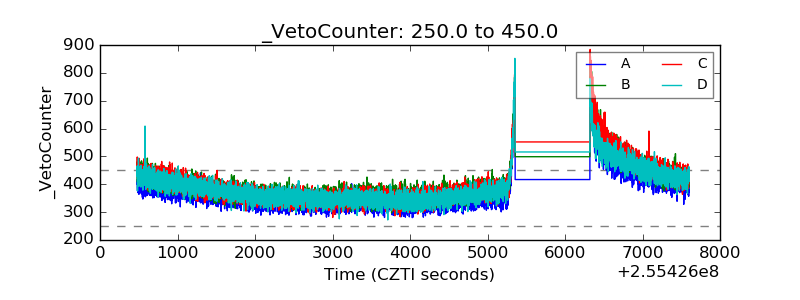 |