| Param | Original file | Final file |
|---|---|---|
| Filename | modeM0/AS1G08_021T01_9000001880_12735cztM0_level2.evt | modeM0/AS1G08_021T01_9000001880_12735cztM0_level2_quad_clean.evt |
| Size (bytes) | 576,964,800 | 83,592,000 |
| Size | 550.2 MB | 79.7 MB |
| Events in quadrant A | 3,350,652 | 538,688 |
| Events in quadrant B | 5,355,128 | 491,869 |
| Events in quadrant C | 3,182,590 | 533,036 |
| Events in quadrant D | 5,134,305 | 503,845 |
| Mode M0 | |||
|---|---|---|---|
| Quadrant | BADHDUFLAG | Total packets | Discarded packets |
| A | 0 | 14296 | 3 |
| B | 0 | 20307 | 2 |
| C | 0 | 13995 | 2 |
| D | 0 | 19872 | 2 |
| Mode SS | |||
|---|---|---|---|
| Quadrant | BADHDUFLAG | Total packets | Discarded packets |
| A | 0 | 134 | 0 |
| B | 0 | 134 | 0 |
| C | 0 | 134 | 0 |
| D | 0 | 134 | 0 |
| Mode M9 | |||
|---|---|---|---|
| Quadrant | BADHDUFLAG | Total packets | Discarded packets |
| A | 0 | 18 | 0 |
| B | 0 | 18 | 0 |
| C | 0 | 18 | 0 |
| D | 0 | 19 | 0 |
| Quadrant | Total seconds | Saturated seconds | Saturation percentage |
|---|---|---|---|
| A | 6652 | 86 | 1.292844% |
| B | 6652 | 770 | 11.575466% |
| C | 6652 | 71 | 1.067348% |
| D | 6652 | 518 | 7.787132% |
Noise dominated data is calculated using 1-second bins in cleaned event files. If a bin has >2000 counts, and if more than 50% of those come from <1% of pixels, then it is considered to be noise-dominated and hence unusable.
| Quadrant | # 1 sec bins | Bins with >0 counts | Bins with >2000 counts | High rate bins dominated by noise | Noise dominated (total time) | Noise dominated (detector-on time) | Marked lightcurve |
|---|---|---|---|---|---|---|---|
| A | 7839 | 6655 | 0 | 0 | 0.00% | 0.00% | 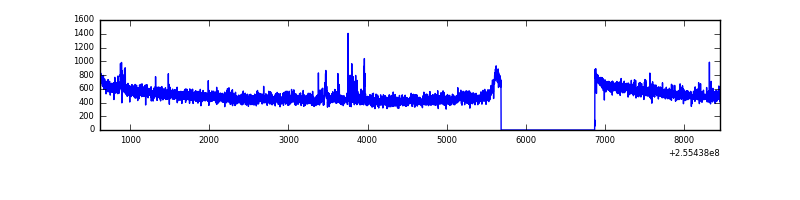 |
| B | 7839 | 6655 | 602 | 602 | 7.68% | 9.05% | 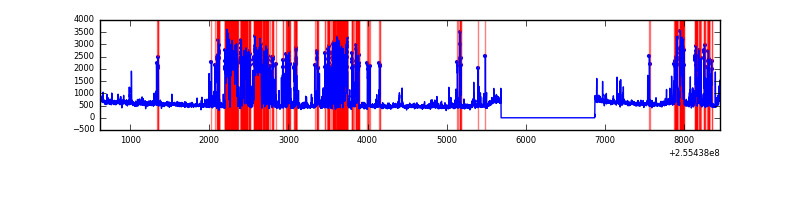 |
| C | 7839 | 6655 | 0 | 0 | 0.00% | 0.00% | 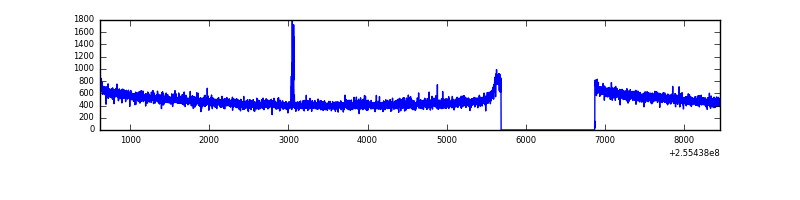 |
| D | 7839 | 6655 | 404 | 404 | 5.15% | 6.07% | 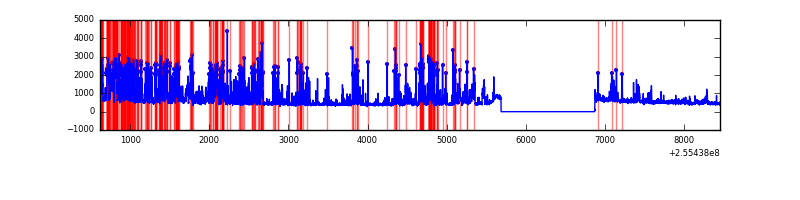 |
Top three noisy pixels from each quadrant. If the there are fewer than three noisy pixels in the level2.evt file, extra rows are filled as -1
| Pixel properties | Quadrant properties | ||||||
|---|---|---|---|---|---|---|---|
| Quadrant | DetID | PixID | Counts | Sigma | Mean | Median | Sigma |
| A | 12 | 189 | 38849 | 227.37 | 845 | 829 | 167.2 |
| A | 15 | 239 | 35018 | 204.46 | 845 | 829 | 167.2 |
| A | 8 | 15 | 22538 | 129.83 | 845 | 829 | 167.2 |
| B | 4 | 239 | 2052045 | 13809.39 | 798 | 780 | 148.5 |
| B | 0 | 219 | 38112 | 251.32 | 798 | 780 | 148.5 |
| B | 0 | 214 | 34183 | 224.87 | 798 | 780 | 148.5 |
| C | 15 | 208 | 14729 | 75.75 | 812 | 818 | 183.7 |
| C | 13 | 61 | 6020 | 28.33 | 812 | 818 | 183.7 |
| C | 3 | 202 | 2060 | 6.76 | 812 | 818 | 183.7 |
| D | 1 | 52 | 1690718 | 9166.79 | 788 | 768 | 184.4 |
| D | 10 | 199 | 391612 | 2120.05 | 788 | 768 | 184.4 |
| D | 2 | 136 | 41701 | 222.03 | 788 | 768 | 184.4 |
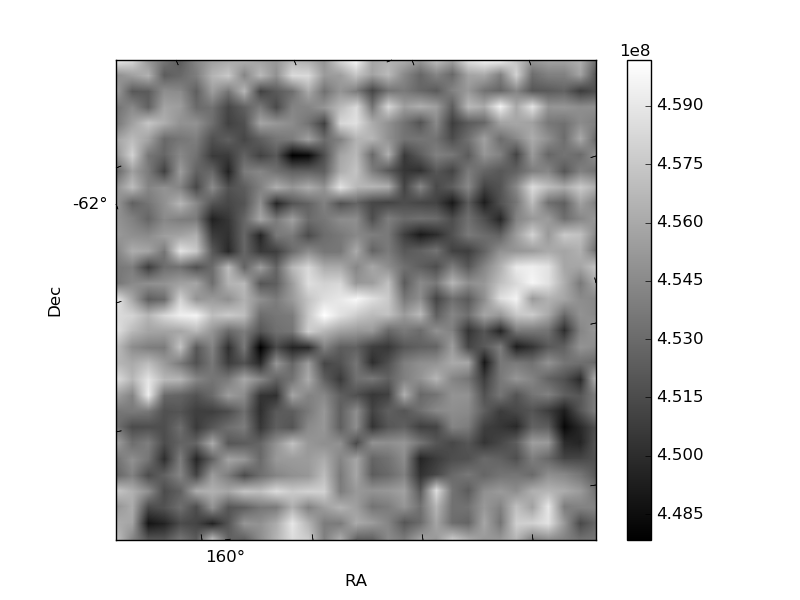
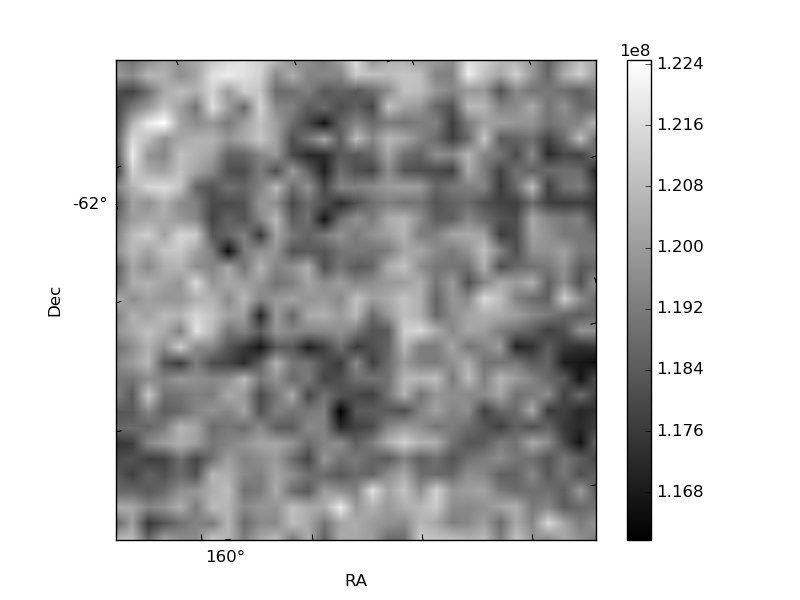
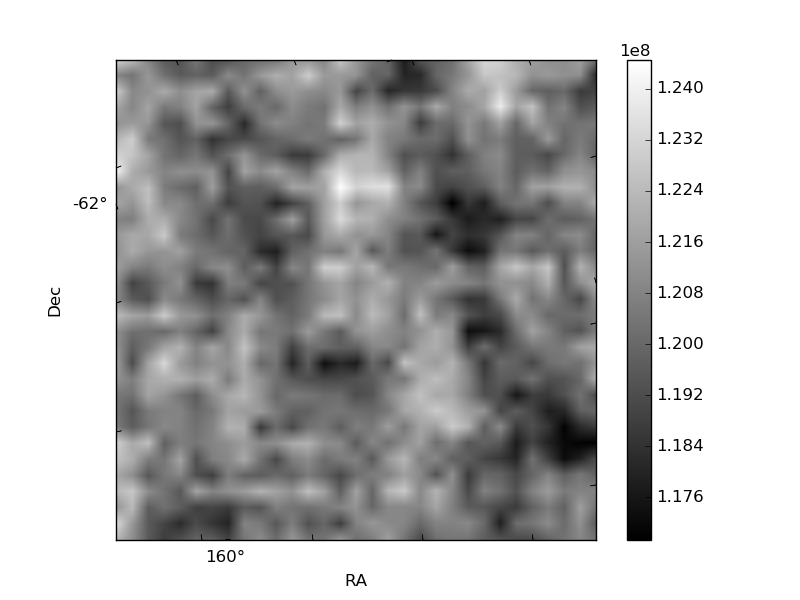
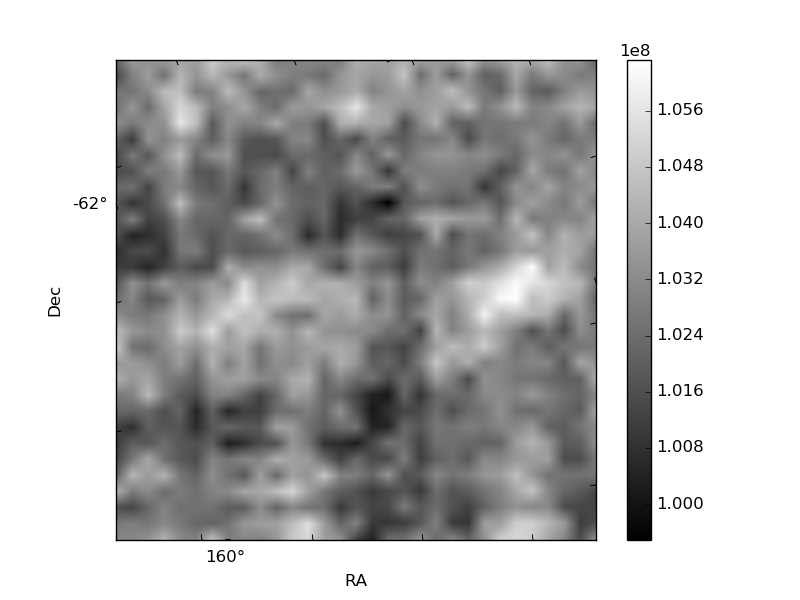
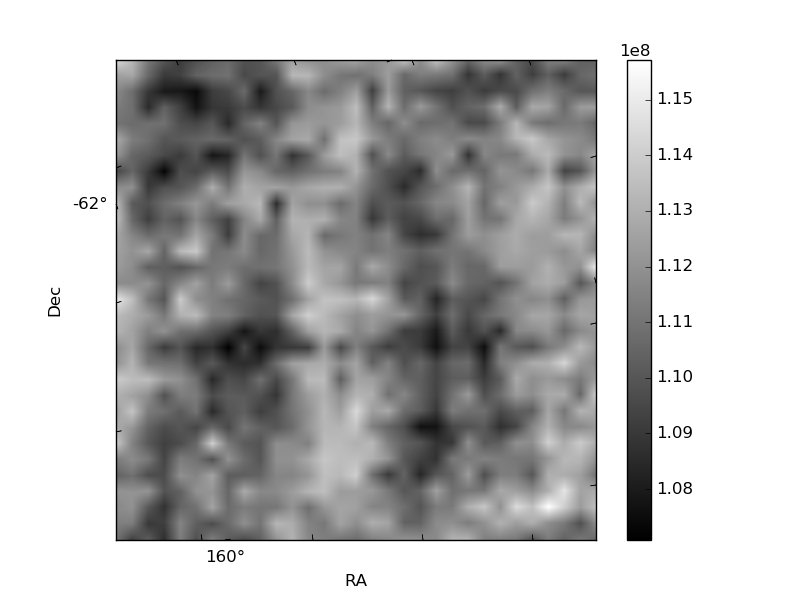
Histogram calculated using DETX and DETY for each event in the final _common_clean file
| Quadrant A | 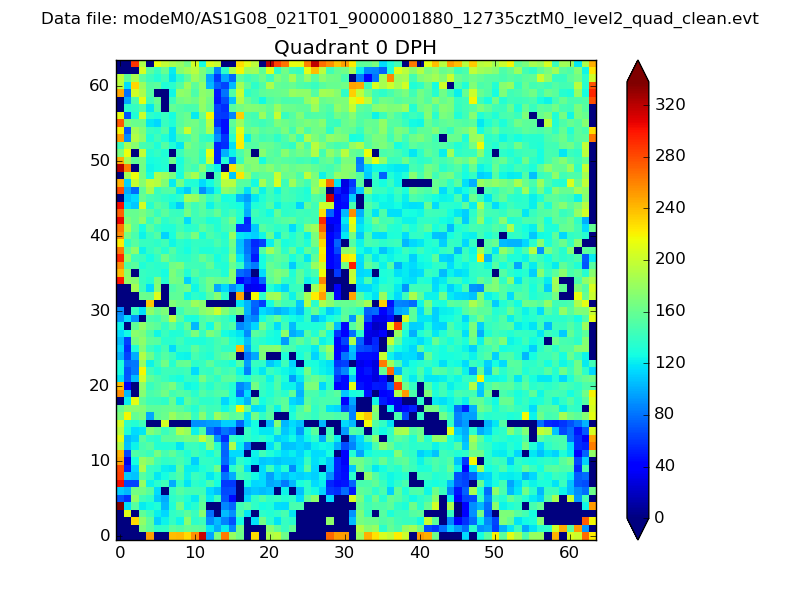 |
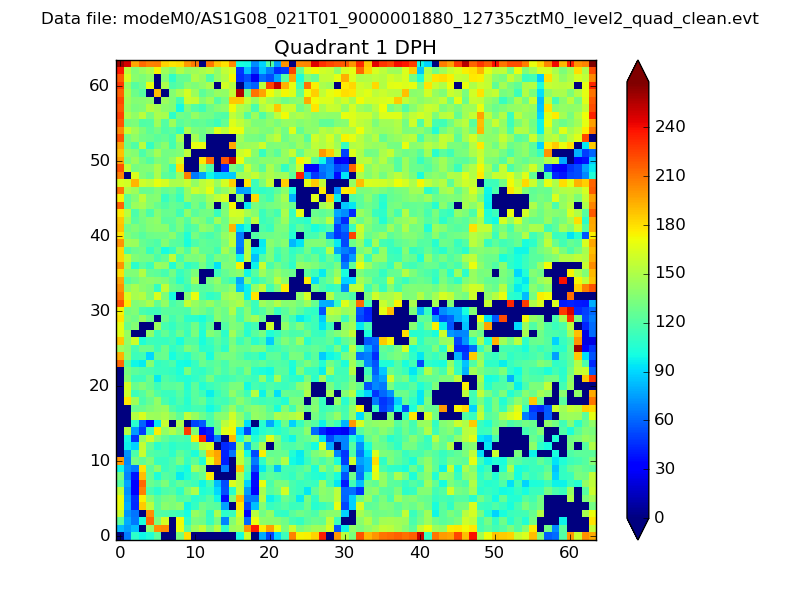 |
Quadrant B |
|---|---|---|---|
| Quadrant D | 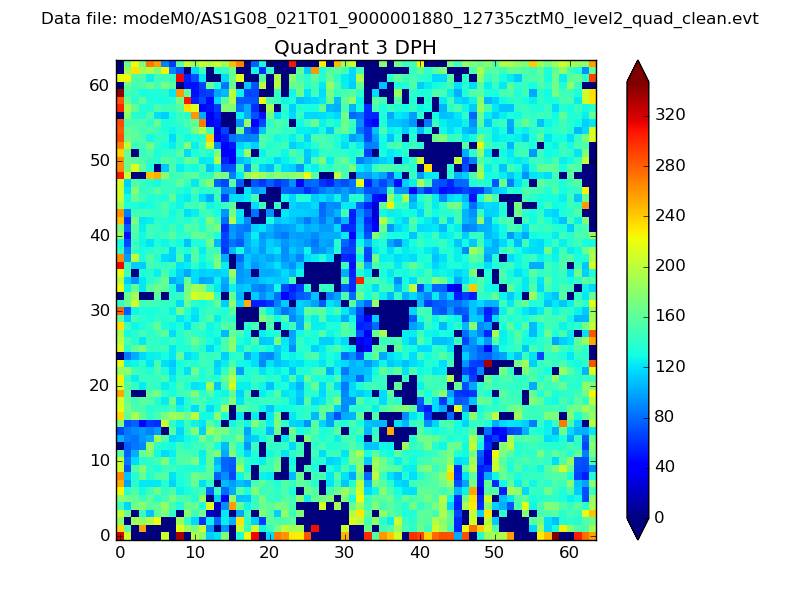 |
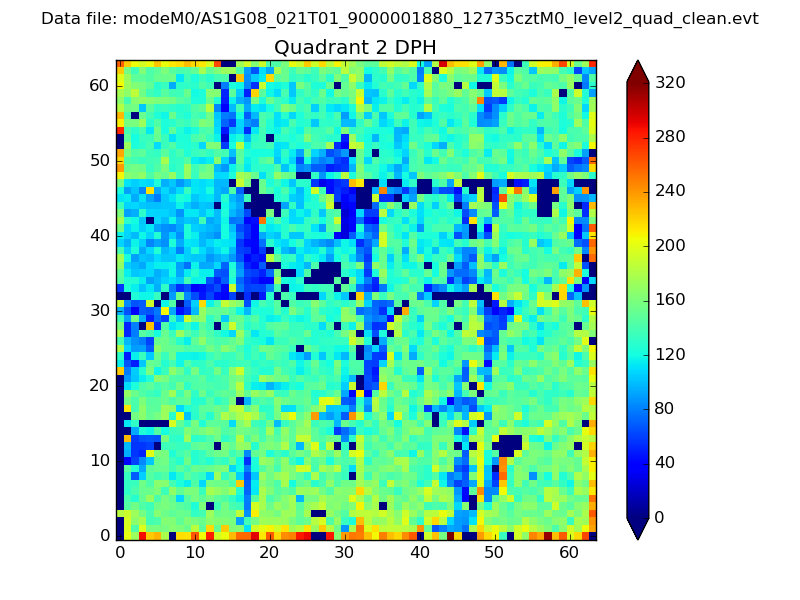 |
Quadrant C |
| Plot type | Count rate plots | Images |
|---|---|---|
| Comparison with Poisson distribution Blue bars denote a histogram of data divided into 1 sec bins. Red curve is a Poisson curve with rate = median count rate of data. |
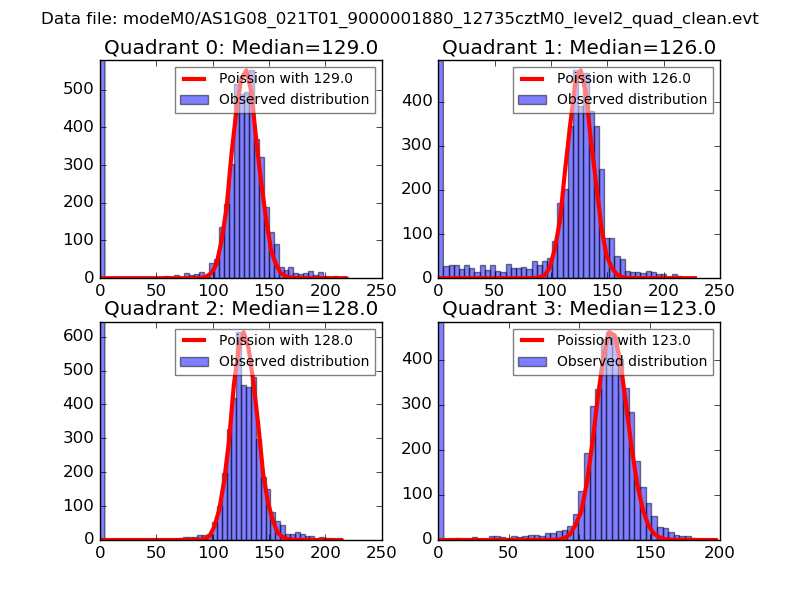 |
 |
| Quadrant-wise count rates Data is divided into 100 sec bins |
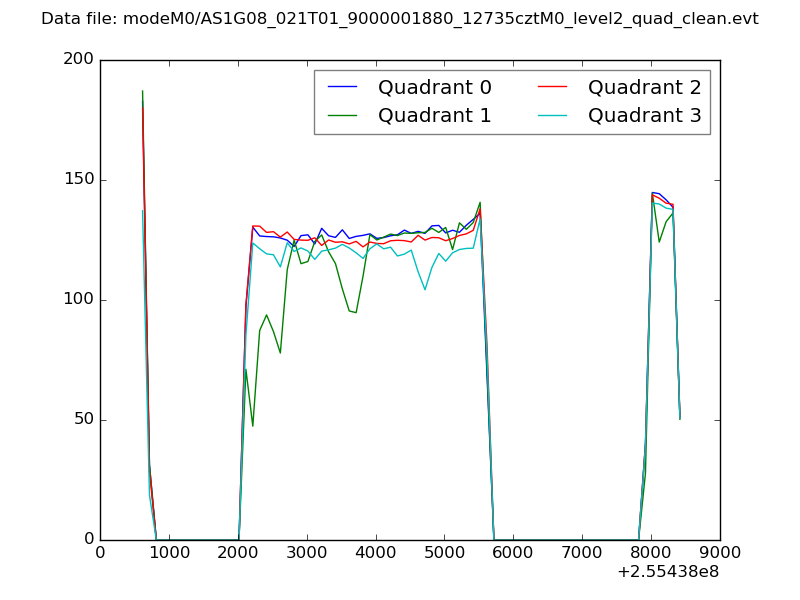 |
|
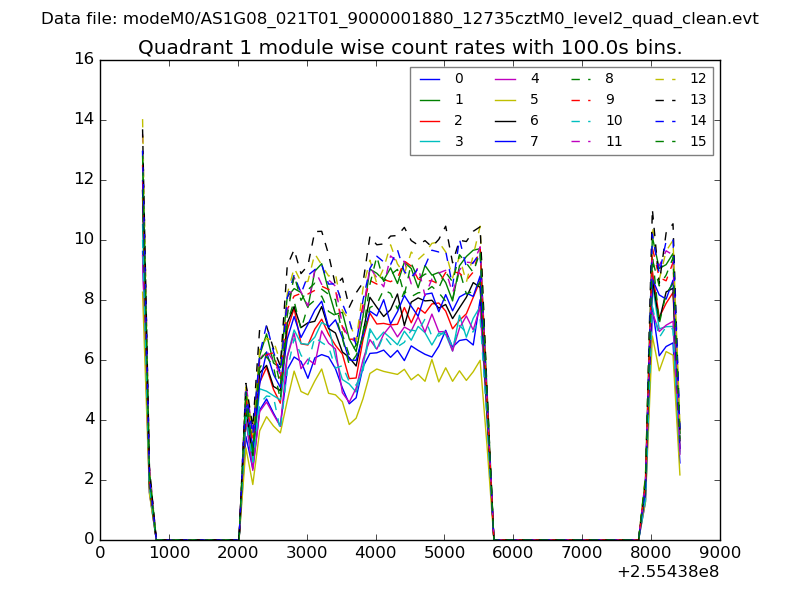
| Module-wise count rates for Quadrant A Data is divided into 100 sec bins |
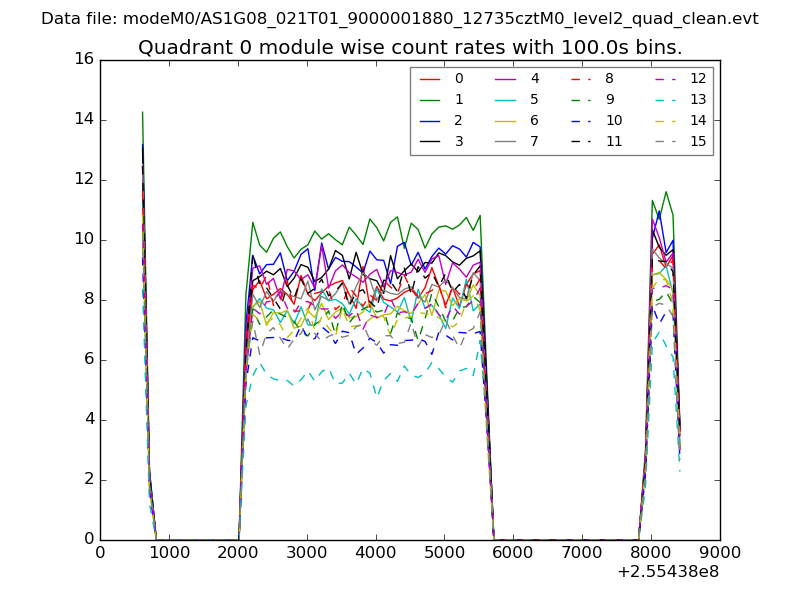 |
 |
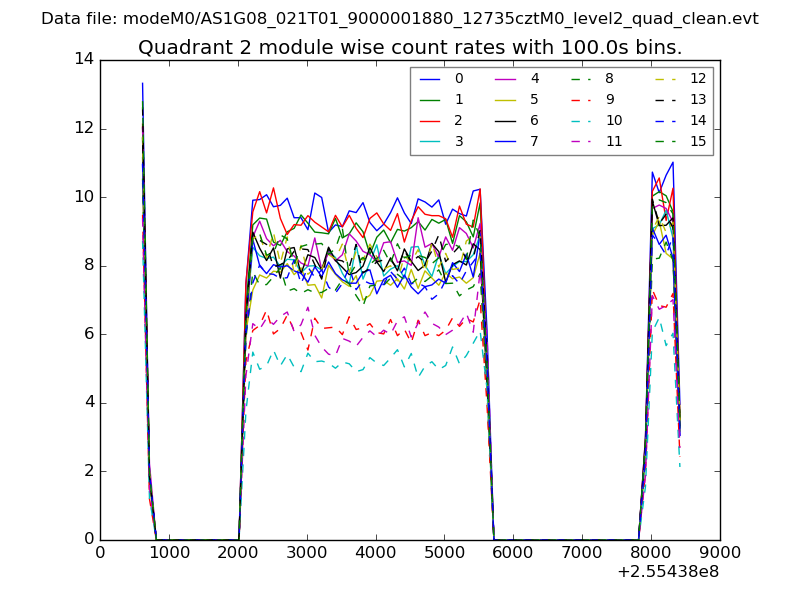
| Module-wise count rates for Quadrant B Data is divided into 100 sec bins |
 |
 |
| Module-wise count rates for Quadrant C Data is divided into 100 sec bins |
 |
 |
| Module-wise count rates for Quadrant D Data is divided into 100 sec bins |
 |
 |
| Parameter | Plot |
|---|---|
| CZT HV Monitor | 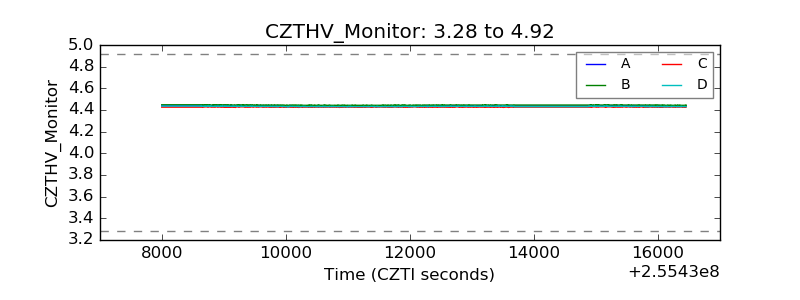 |
| D_VDD | 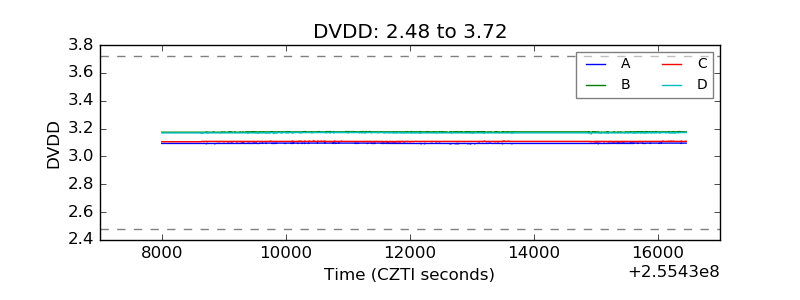 |
| Temperature 1 | 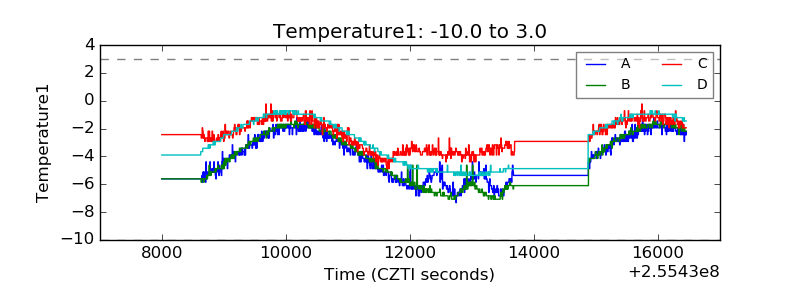 |
| Veto HV Monitor | 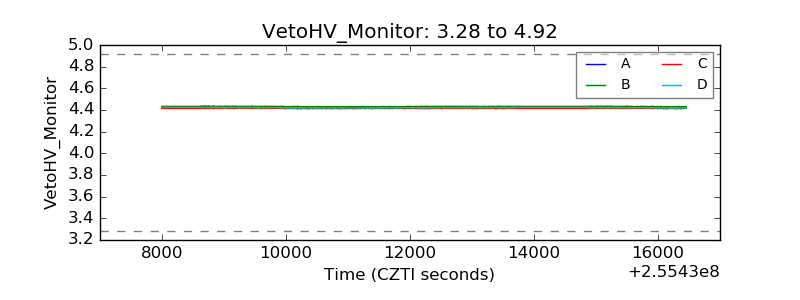 |
| Veto LLD | 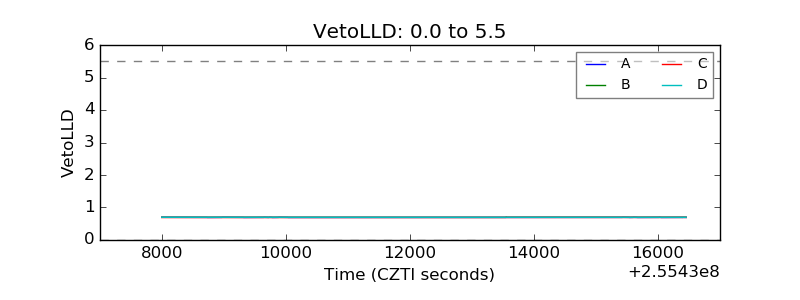 |
| Alpha Counter | 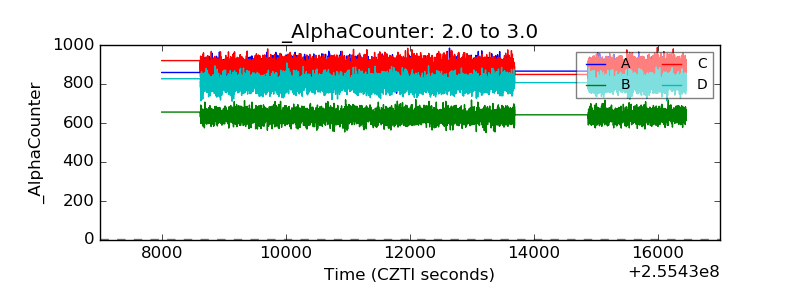 |
| _CPM_Rate | 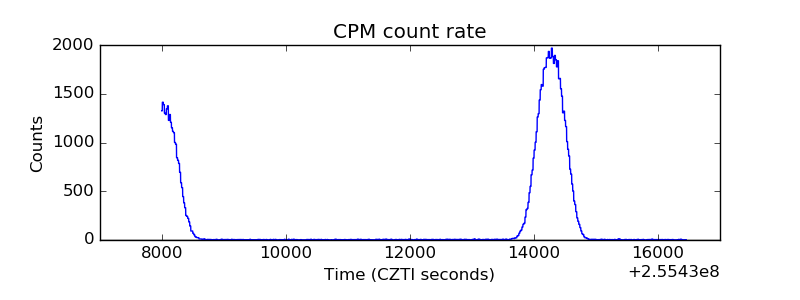 |
| CZT Counter | 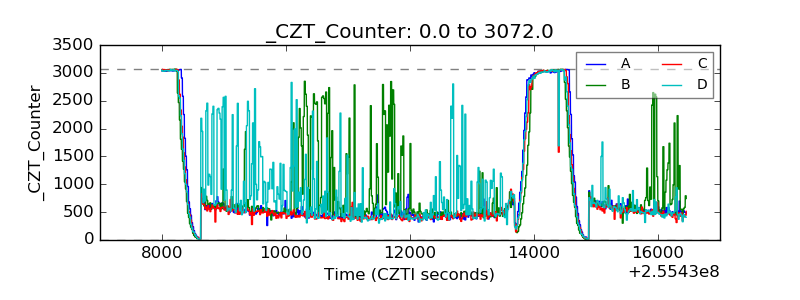 |
| +2.5 Volts monitor |  |
| +5 Volts monitor |  |
| _ROLL_ROT |  |
| _Roll_DEC | 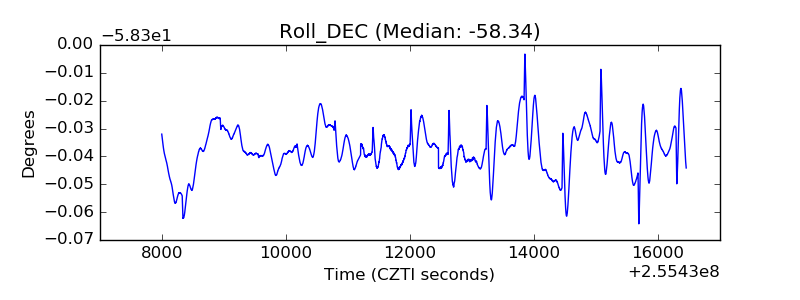 |
| _Roll_RA | 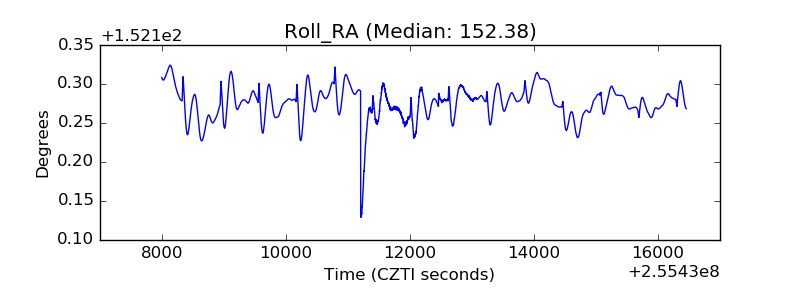 |
| Veto Counter | 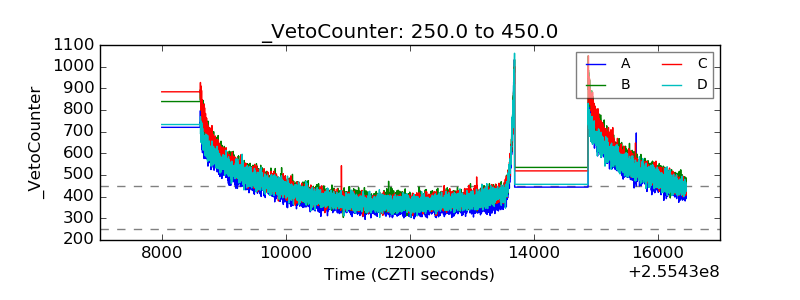 |