| Param | Original file | Final file |
|---|---|---|
| Filename | modeM0/AS1G08_021T01_9000001880_12738cztM0_level2.evt | modeM0/AS1G08_021T01_9000001880_12738cztM0_level2_quad_clean.evt |
| Size (bytes) | 892,304,640 | 192,093,120 |
| Size | 851.0 MB | 183.2 MB |
| Events in quadrant A | 5,941,513 | 1,330,557 |
| Events in quadrant B | 9,007,789 | 1,223,948 |
| Events in quadrant C | 4,757,356 | 1,305,543 |
| Events in quadrant D | 6,617,376 | 1,241,652 |
| Mode M0 | |||
|---|---|---|---|
| Quadrant | BADHDUFLAG | Total packets | Discarded packets |
| A | 0 | 24511 | 3 |
| B | 0 | 33541 | 2 |
| C | 0 | 21290 | 2 |
| D | 0 | 26896 | 2 |
| Mode SS | |||
|---|---|---|---|
| Quadrant | BADHDUFLAG | Total packets | Discarded packets |
| A | 0 | 210 | 0 |
| B | 0 | 210 | 0 |
| C | 0 | 210 | 0 |
| D | 0 | 210 | 0 |
| Mode M9 | |||
|---|---|---|---|
| Quadrant | BADHDUFLAG | Total packets | Discarded packets |
| A | 0 | 26 | 0 |
| B | 0 | 26 | 0 |
| C | 0 | 26 | 0 |
| D | 0 | 26 | 0 |
| Quadrant | Total seconds | Saturated seconds | Saturation percentage |
|---|---|---|---|
| A | 10341 | 326 | 3.152500% |
| B | 10341 | 1808 | 17.483802% |
| C | 10341 | 113 | 1.092738% |
| D | 10341 | 538 | 5.202592% |
Noise dominated data is calculated using 1-second bins in cleaned event files. If a bin has >2000 counts, and if more than 50% of those come from <1% of pixels, then it is considered to be noise-dominated and hence unusable.
| Quadrant | # 1 sec bins | Bins with >0 counts | Bins with >2000 counts | High rate bins dominated by noise | Noise dominated (total time) | Noise dominated (detector-on time) | Marked lightcurve |
|---|---|---|---|---|---|---|---|
| A | 12877 | 10344 | 86 | 86 | 0.67% | 0.83% | 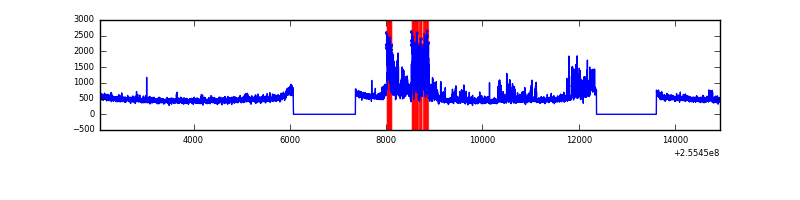 |
| B | 12877 | 10344 | 1295 | 1295 | 10.06% | 12.52% | 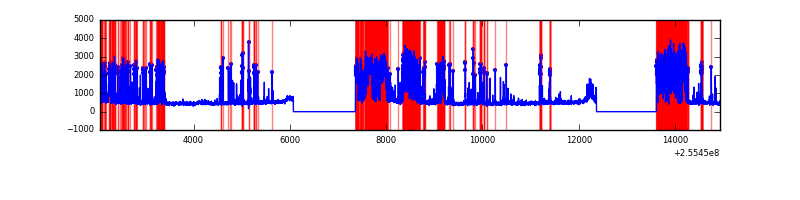 |
| C | 12877 | 10344 | 1 | 1 | 0.01% | 0.01% | 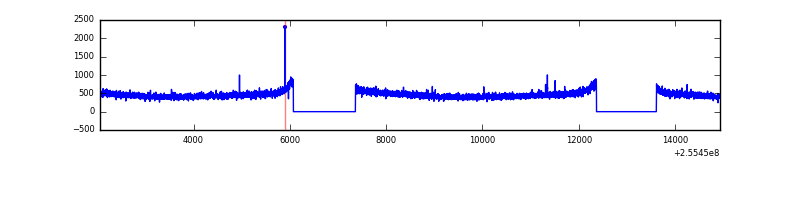 |
| D | 12877 | 10344 | 399 | 399 | 3.10% | 3.86% | 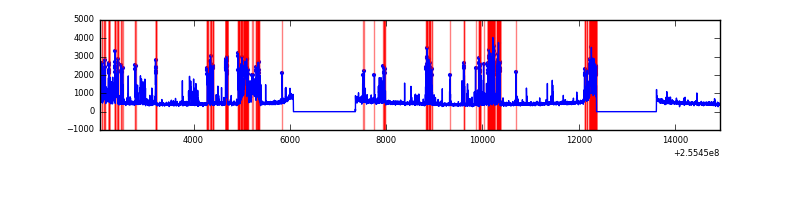 |
Top three noisy pixels from each quadrant. If the there are fewer than three noisy pixels in the level2.evt file, extra rows are filled as -1
| Pixel properties | Quadrant properties | ||||||
|---|---|---|---|---|---|---|---|
| Quadrant | DetID | PixID | Counts | Sigma | Mean | Median | Sigma |
| A | 8 | 15 | 874192 | 3481.31 | 1261 | 1236 | 250.8 |
| A | 15 | 222 | 165804 | 656.29 | 1261 | 1236 | 250.8 |
| A | 12 | 189 | 47824 | 185.79 | 1261 | 1236 | 250.8 |
| B | 4 | 239 | 4310290 | 20356.41 | 1150 | 1124 | 211.7 |
| B | 0 | 190 | 36035 | 164.92 | 1150 | 1124 | 211.7 |
| B | 3 | 209 | 30852 | 140.43 | 1150 | 1124 | 211.7 |
| C | 13 | 61 | 9104 | 28.55 | 1215 | 1220 | 276.1 |
| C | 8 | 128 | 8396 | 25.99 | 1215 | 1220 | 276.1 |
| C | 8 | 112 | 4854 | 13.16 | 1215 | 1220 | 276.1 |
| D | 1 | 52 | 1464904 | 5325.04 | 1172 | 1142 | 274.9 |
| D | 10 | 199 | 651572 | 2366.21 | 1172 | 1142 | 274.9 |
| D | 2 | 234 | 40674 | 143.81 | 1172 | 1142 | 274.9 |
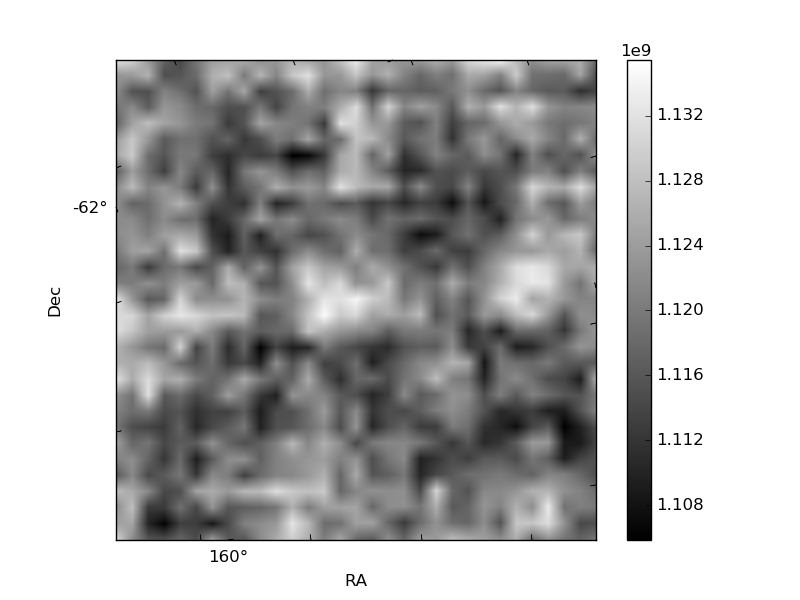
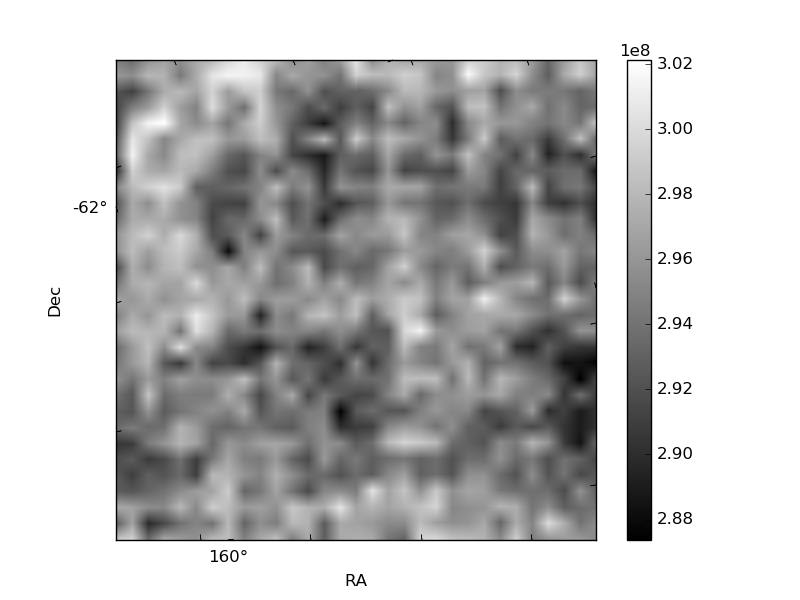
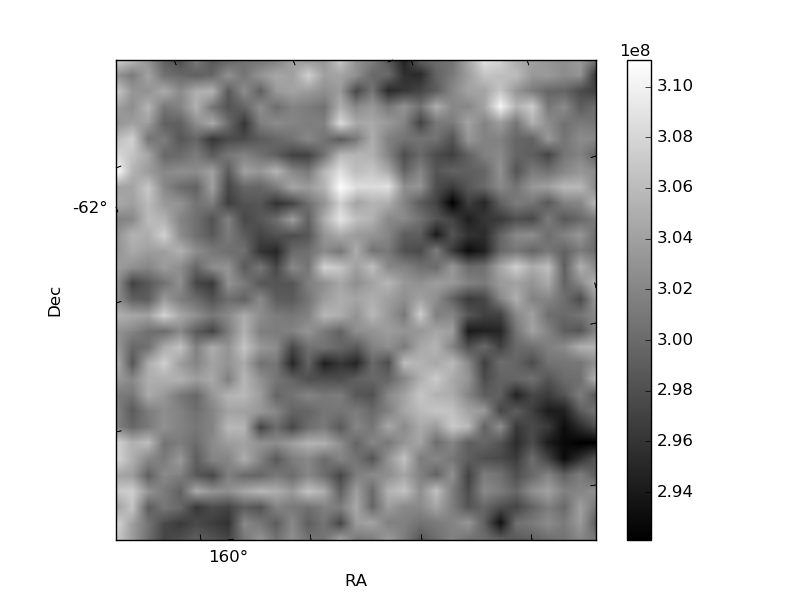
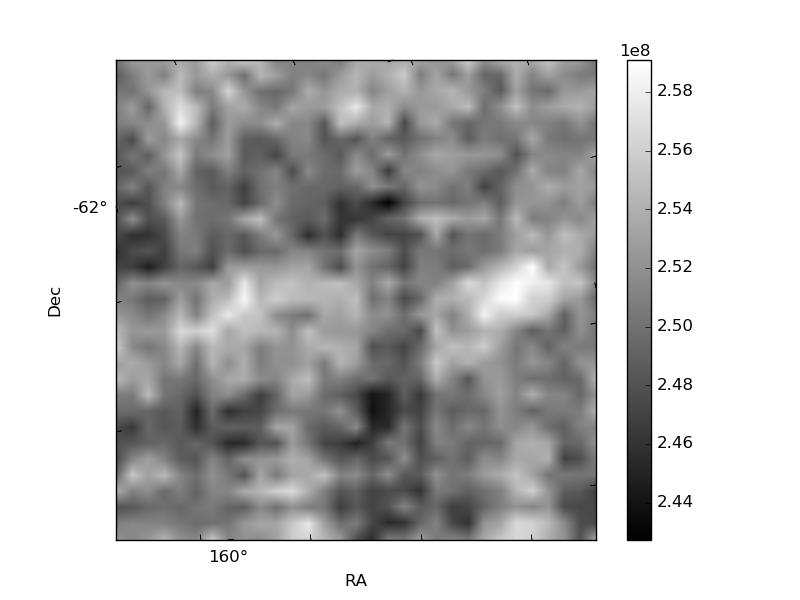
Histogram calculated using DETX and DETY for each event in the final _common_clean file
| Quadrant A | 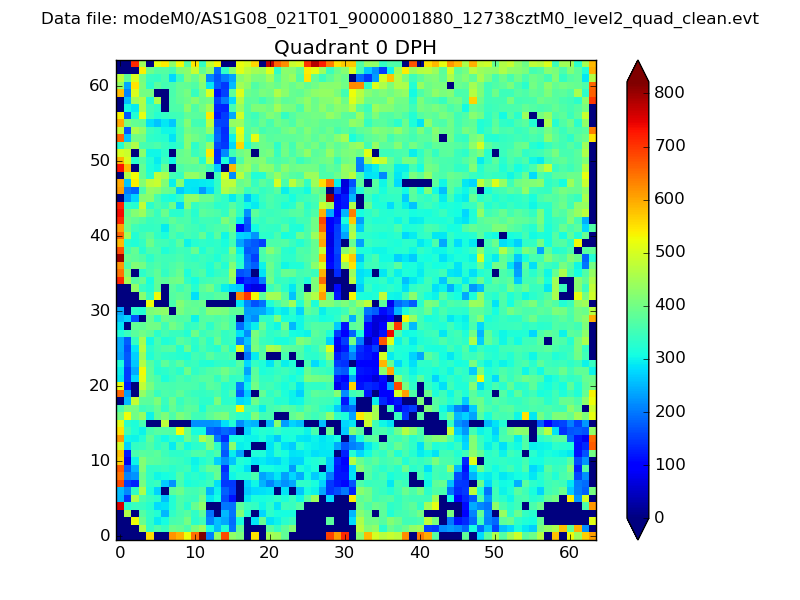 |
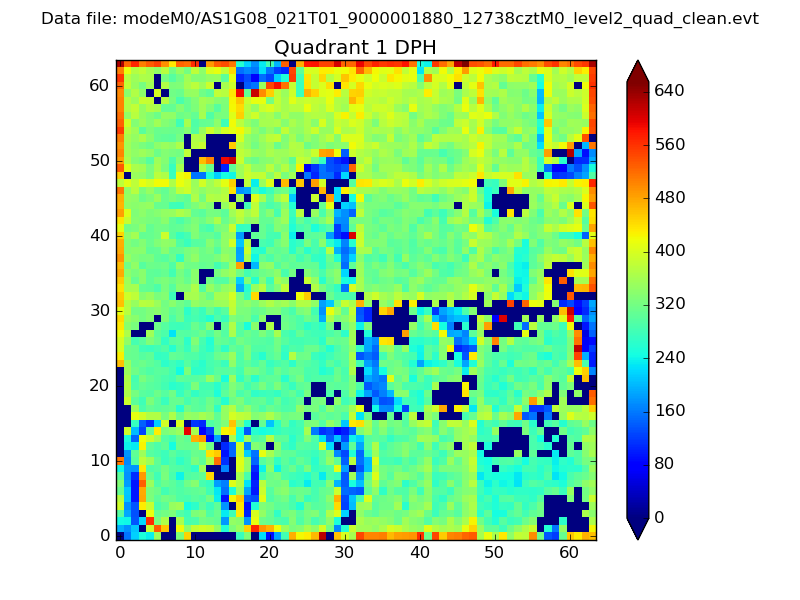 |
Quadrant B |
|---|---|---|---|
| Quadrant D | 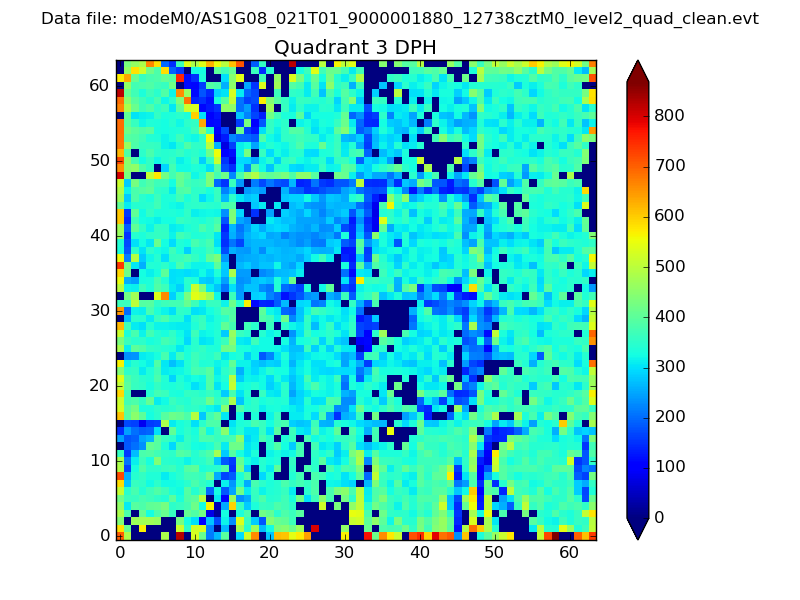 |
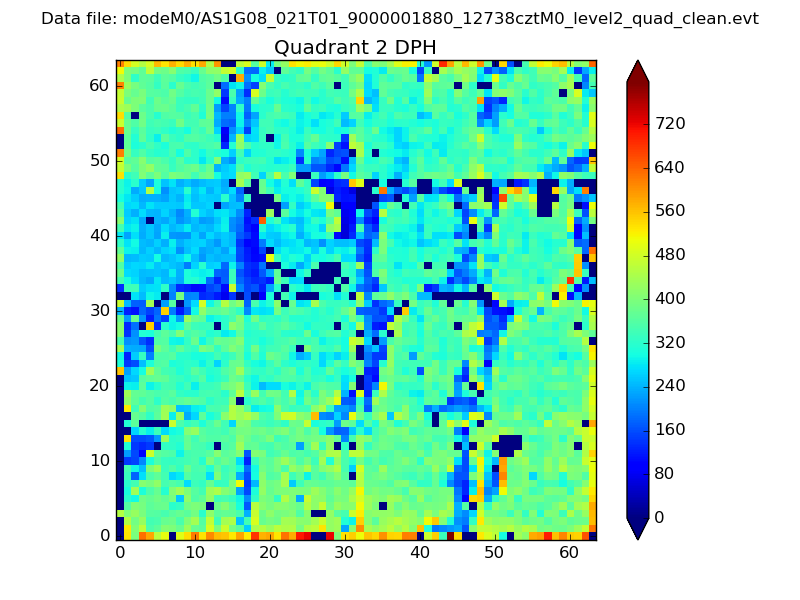 |
Quadrant C |
| Plot type | Count rate plots | Images |
|---|---|---|
| Comparison with Poisson distribution Blue bars denote a histogram of data divided into 1 sec bins. Red curve is a Poisson curve with rate = median count rate of data. |
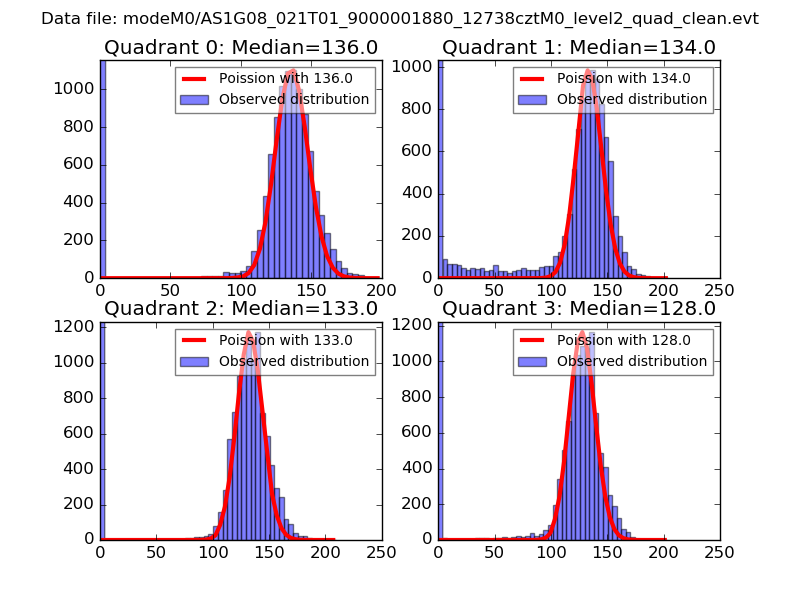 |
 |
| Quadrant-wise count rates Data is divided into 100 sec bins |
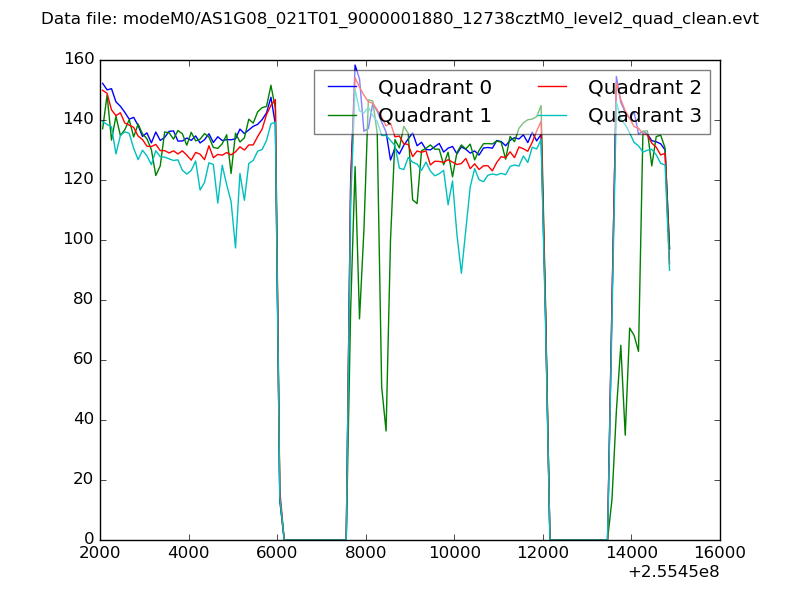 |
|
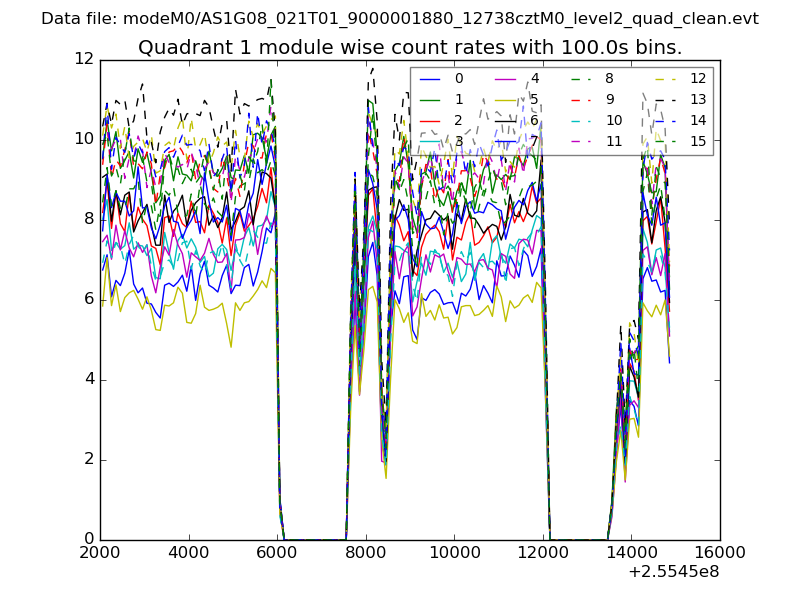
| Module-wise count rates for Quadrant A Data is divided into 100 sec bins |
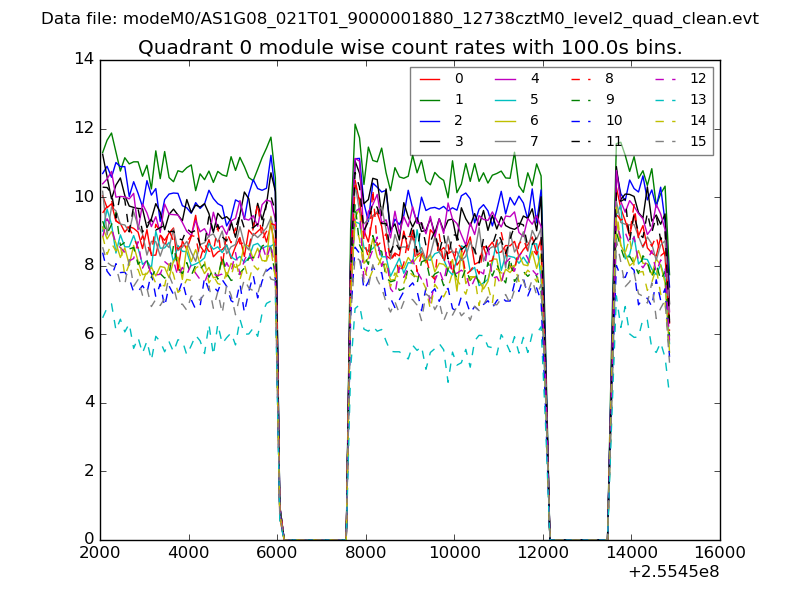 |
 |
| Module-wise count rates for Quadrant B Data is divided into 100 sec bins |
 |
 |
| Module-wise count rates for Quadrant C Data is divided into 100 sec bins |
 |
 |
| Module-wise count rates for Quadrant D Data is divided into 100 sec bins |
 |
 |
| Parameter | Plot |
|---|---|
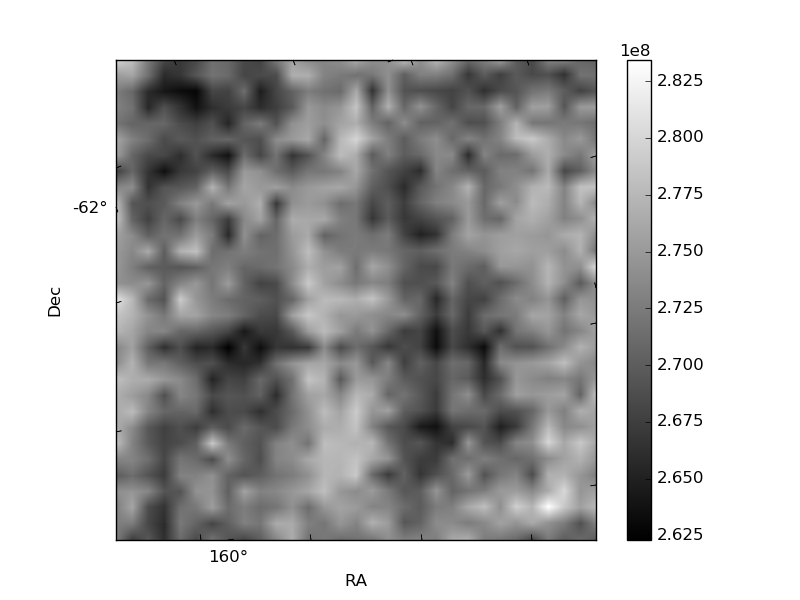
| CZT HV Monitor |  |
| D_VDD | 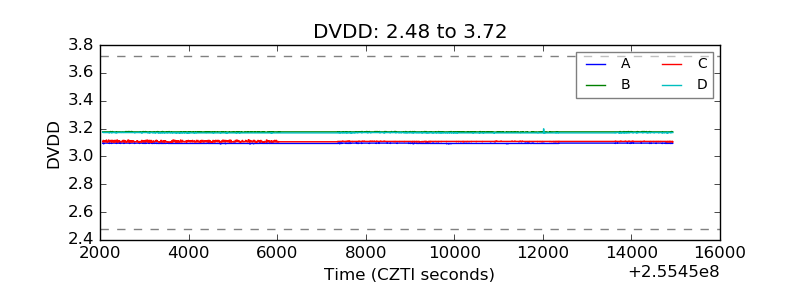 |
| Temperature 1 | 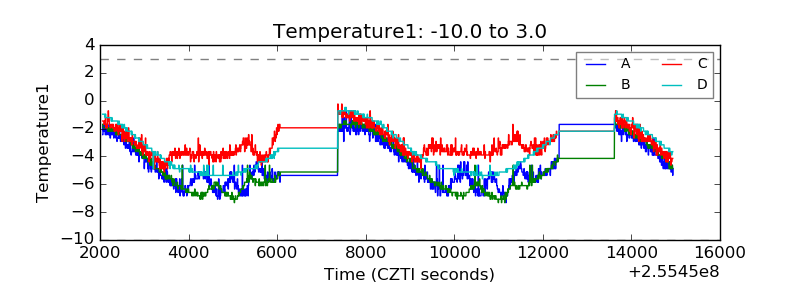 |
| Veto HV Monitor |  |
| Veto LLD | 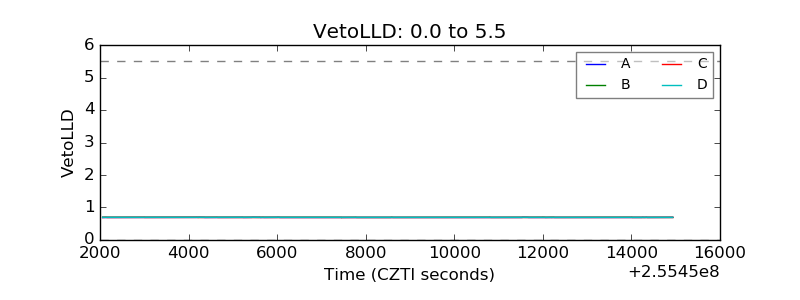 |
| Alpha Counter | 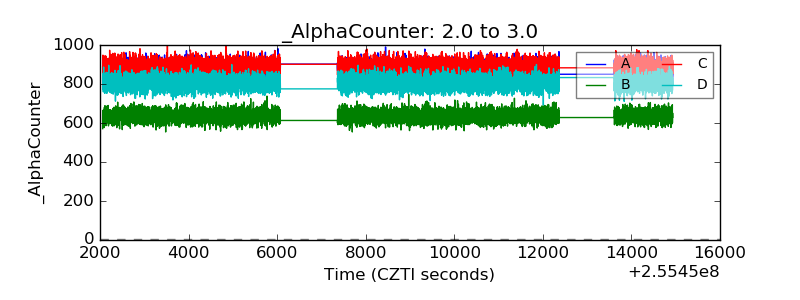 |
| _CPM_Rate | 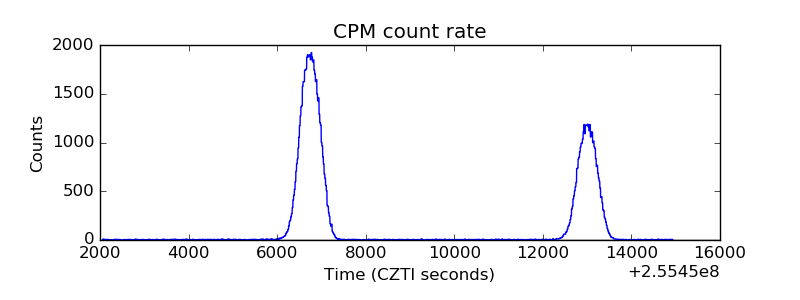 |
| CZT Counter | 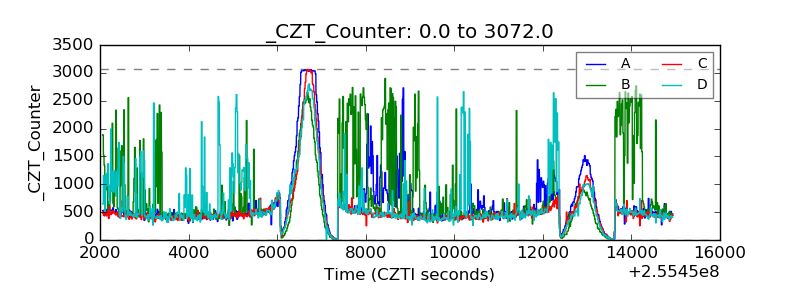 |
| +2.5 Volts monitor | 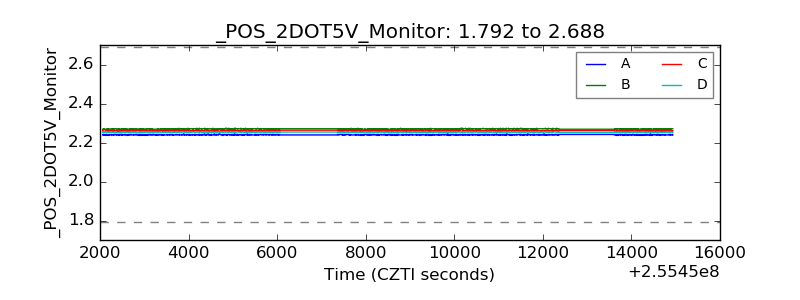 |
| +5 Volts monitor |  |
| _ROLL_ROT |  |
| _Roll_DEC |  |
| _Roll_RA | 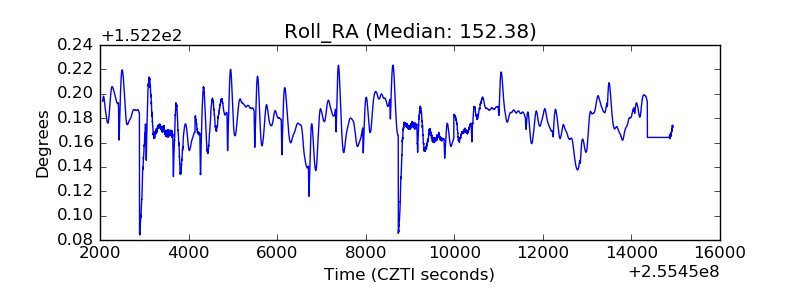 |
| Veto Counter |  |