| Param | Original file | Final file |
|---|---|---|
| Filename | modeM0/AS1G08_021T01_9000001880_12739cztM0_level2.evt | modeM0/AS1G08_021T01_9000001880_12739cztM0_level2_quad_clean.evt |
| Size (bytes) | 506,741,760 | 106,983,360 |
| Size | 483.3 MB | 102.0 MB |
| Events in quadrant A | 3,322,726 | 729,605 |
| Events in quadrant B | 5,323,507 | 637,661 |
| Events in quadrant C | 2,974,021 | 718,362 |
| Events in quadrant D | 3,277,161 | 693,255 |
| Mode M0 | |||
|---|---|---|---|
| Quadrant | BADHDUFLAG | Total packets | Discarded packets |
| A | 0 | 14359 | 3 |
| B | 0 | 20258 | 2 |
| C | 0 | 13574 | 2 |
| D | 0 | 14572 | 2 |
| Mode SS | |||
|---|---|---|---|
| Quadrant | BADHDUFLAG | Total packets | Discarded packets |
| A | 0 | 136 | 0 |
| B | 0 | 136 | 0 |
| C | 0 | 136 | 0 |
| D | 0 | 136 | 0 |
| Mode M9 | |||
|---|---|---|---|
| Quadrant | BADHDUFLAG | Total packets | Discarded packets |
| A | 0 | 23 | 0 |
| B | 0 | 23 | 0 |
| C | 0 | 23 | 0 |
| D | 0 | 23 | 0 |
| Quadrant | Total seconds | Saturated seconds | Saturation percentage |
|---|---|---|---|
| A | 6609 | 158 | 2.390679% |
| B | 6609 | 1168 | 17.672870% |
| C | 6609 | 51 | 0.771675% |
| D | 6609 | 154 | 2.330156% |
Noise dominated data is calculated using 1-second bins in cleaned event files. If a bin has >2000 counts, and if more than 50% of those come from <1% of pixels, then it is considered to be noise-dominated and hence unusable.
| Quadrant | # 1 sec bins | Bins with >0 counts | Bins with >2000 counts | High rate bins dominated by noise | Noise dominated (total time) | Noise dominated (detector-on time) | Marked lightcurve |
|---|---|---|---|---|---|---|---|
| A | 8930 | 6613 | 1 | 1 | 0.01% | 0.02% | 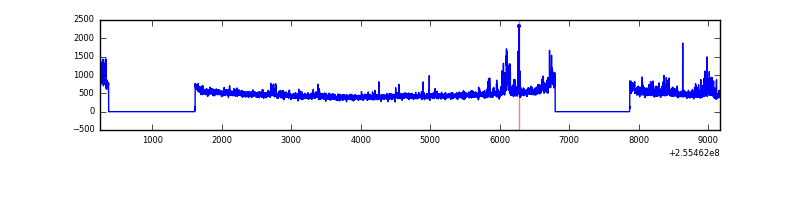 |
| B | 8930 | 6613 | 645 | 645 | 7.22% | 9.75% | 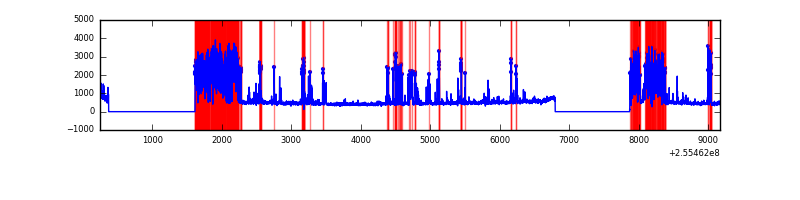 |
| C | 8930 | 6613 | 0 | 0 | 0.00% | 0.00% | 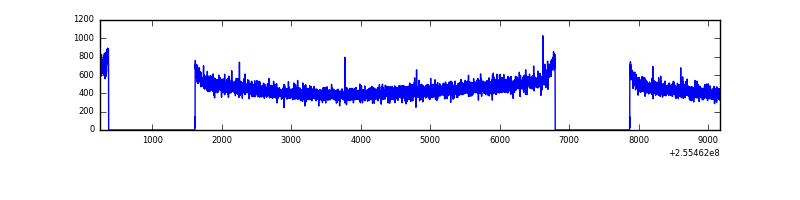 |
| D | 8930 | 6613 | 90 | 90 | 1.01% | 1.36% | 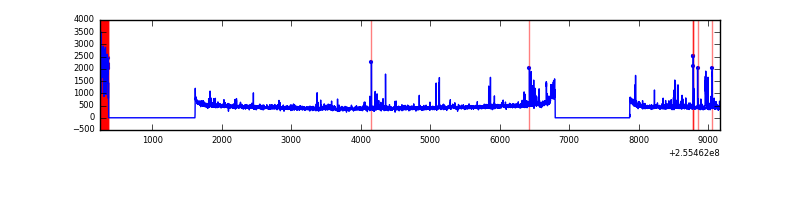 |
Top three noisy pixels from each quadrant. If the there are fewer than three noisy pixels in the level2.evt file, extra rows are filled as -1
| Pixel properties | Quadrant properties | ||||||
|---|---|---|---|---|---|---|---|
| Quadrant | DetID | PixID | Counts | Sigma | Mean | Median | Sigma |
| A | 8 | 15 | 216463 | 1359.22 | 788 | 771 | 158.7 |
| A | 9 | 143 | 28166 | 172.63 | 788 | 771 | 158.7 |
| A | 12 | 189 | 27511 | 168.51 | 788 | 771 | 158.7 |
| B | 4 | 239 | 2484452 | 18833.55 | 704 | 688 | 131.9 |
| B | 0 | 190 | 24599 | 181.31 | 704 | 688 | 131.9 |
| B | 12 | 111 | 14540 | 105.04 | 704 | 688 | 131.9 |
| C | 13 | 61 | 5660 | 28.07 | 762 | 763 | 174.4 |
| C | 8 | 222 | 2496 | 9.93 | 762 | 763 | 174.4 |
| C | 3 | 202 | 1963 | 6.88 | 762 | 763 | 174.4 |
| D | 1 | 52 | 362010 | 2088.92 | 739 | 721 | 173.0 |
| D | 2 | 136 | 39283 | 222.96 | 739 | 721 | 173.0 |
| D | 10 | 157 | 35378 | 200.38 | 739 | 721 | 173.0 |
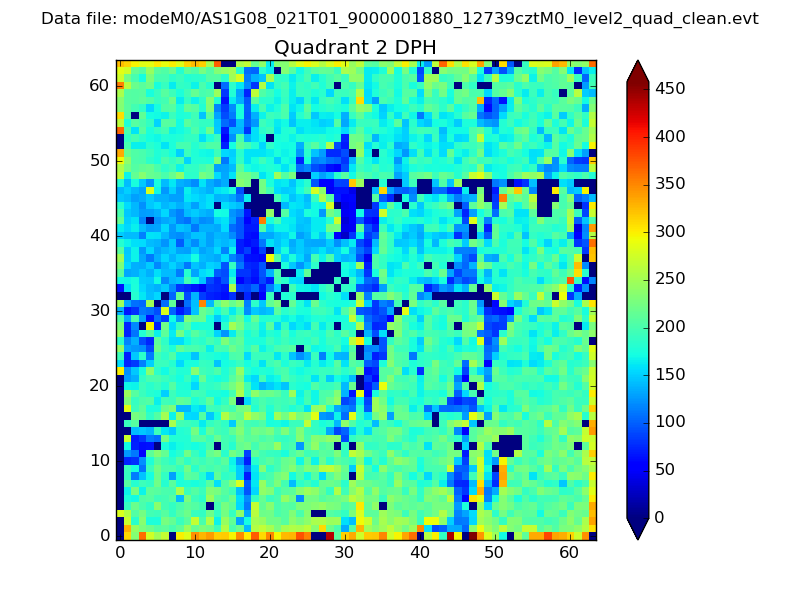
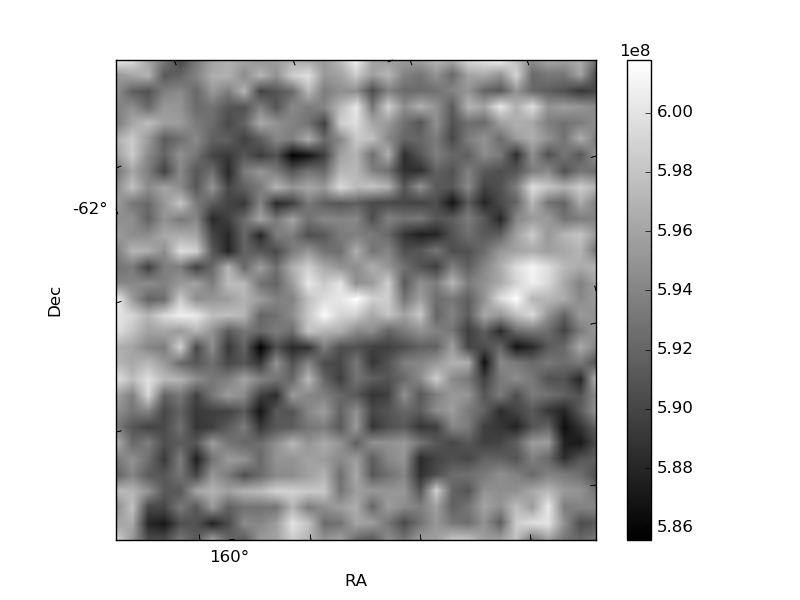
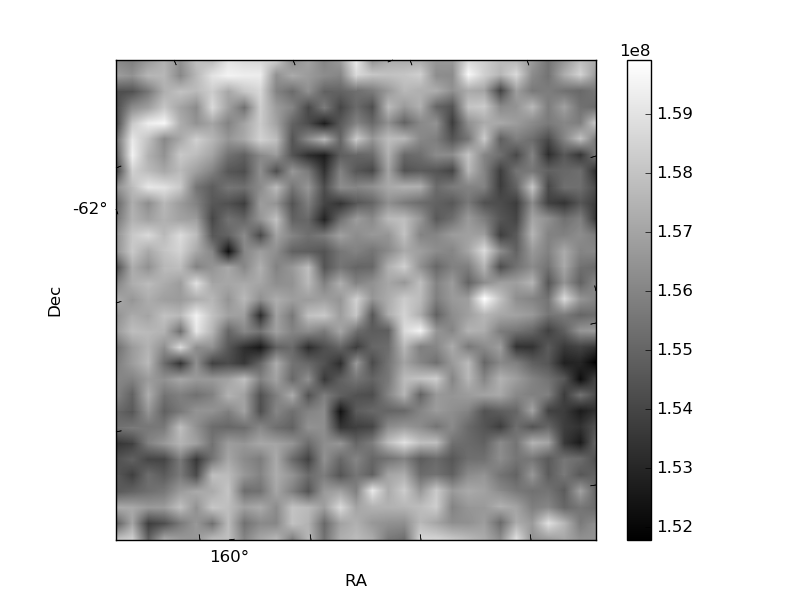
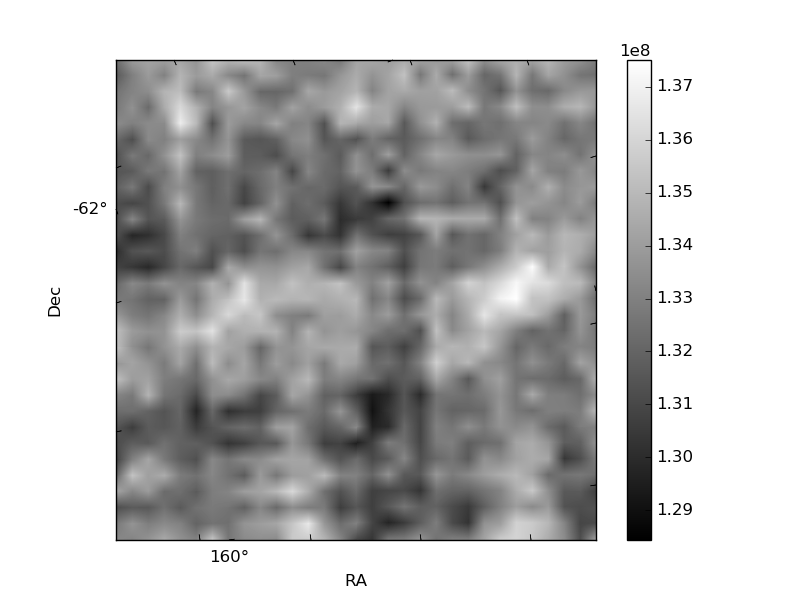
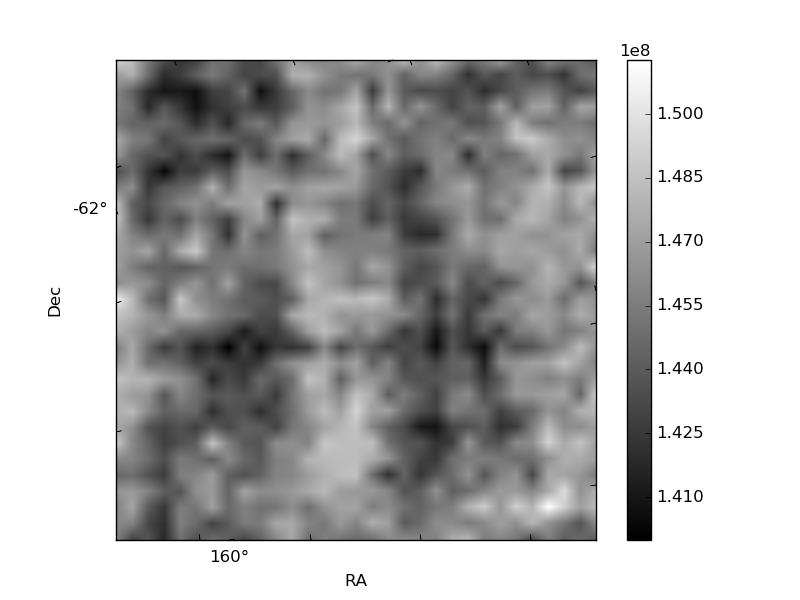
Histogram calculated using DETX and DETY for each event in the final _common_clean file
| Quadrant A | 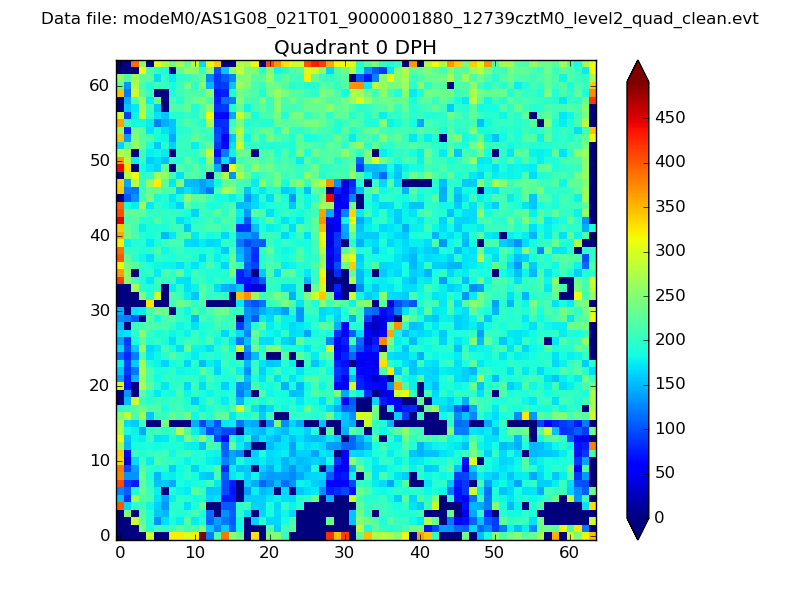 |
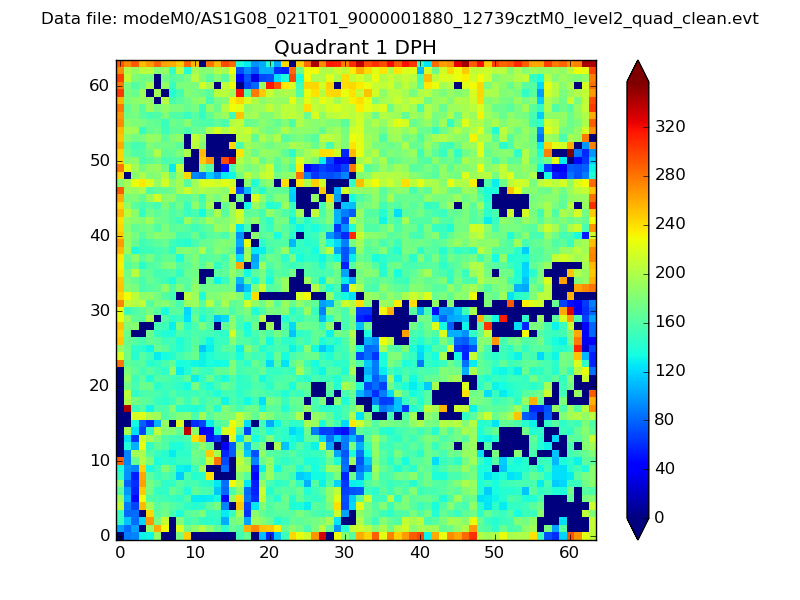 |
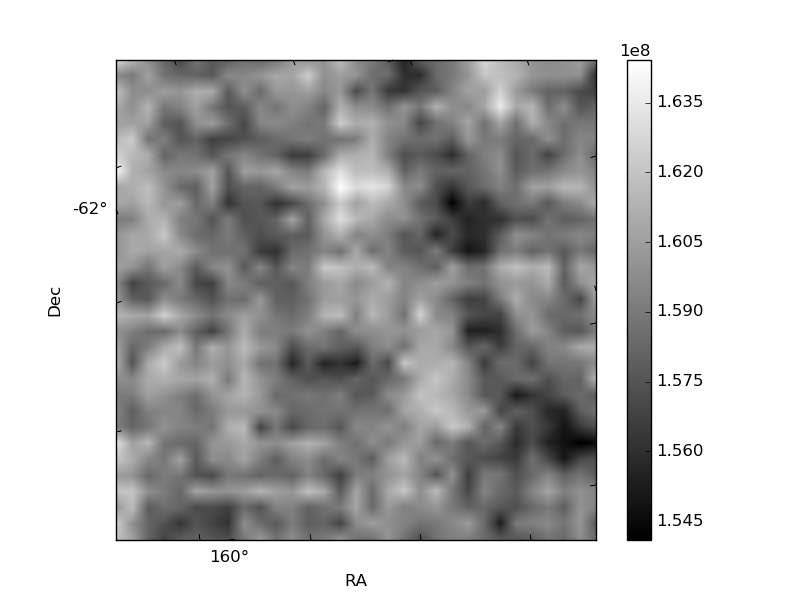
Quadrant B |
|---|---|---|---|
| Quadrant D | 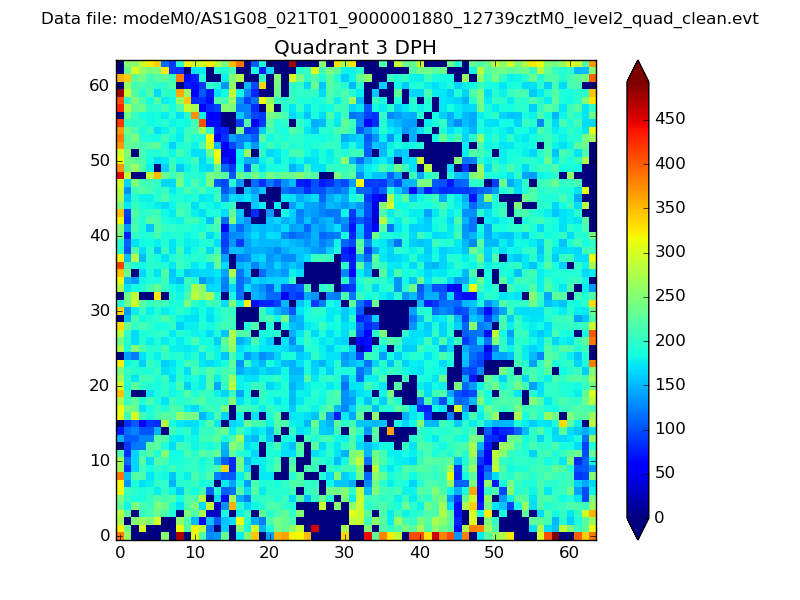 |
 |
Quadrant C |
| Plot type | Count rate plots | Images |
|---|---|---|
| Comparison with Poisson distribution Blue bars denote a histogram of data divided into 1 sec bins. Red curve is a Poisson curve with rate = median count rate of data. |
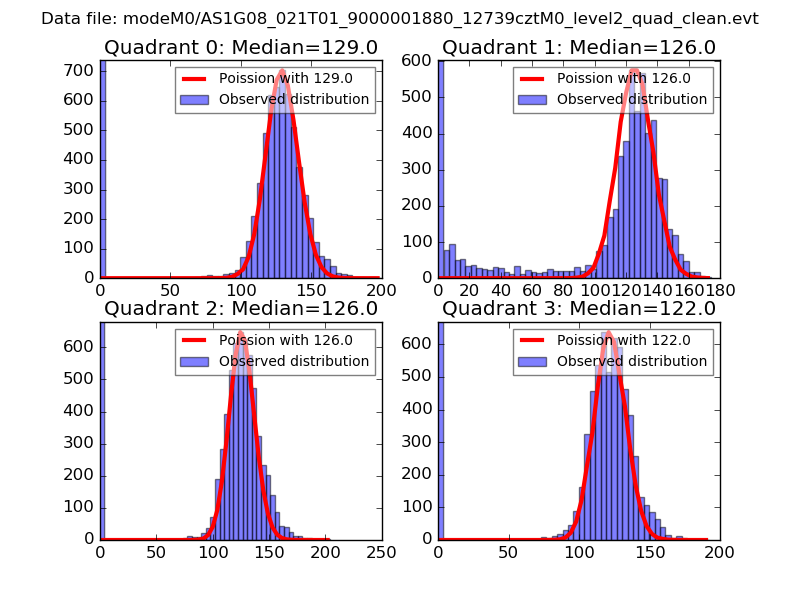 |
 |
| Quadrant-wise count rates Data is divided into 100 sec bins |
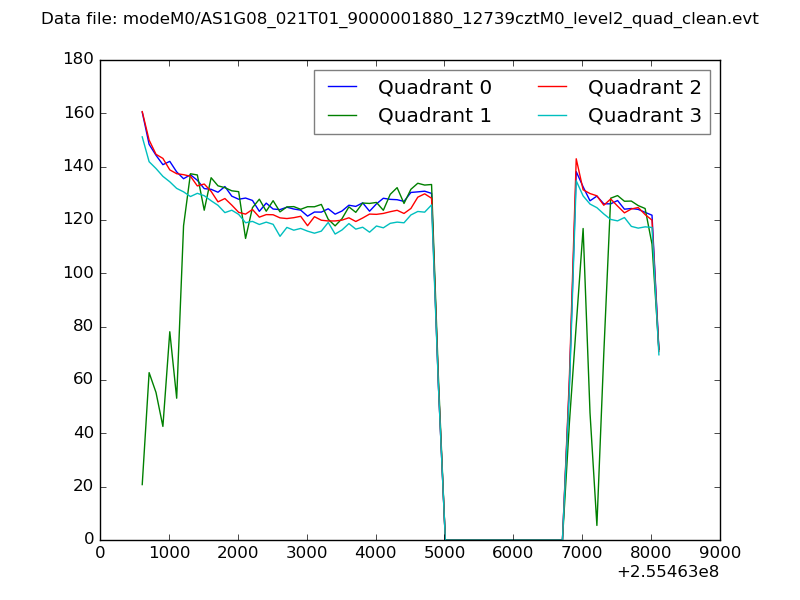 |
|
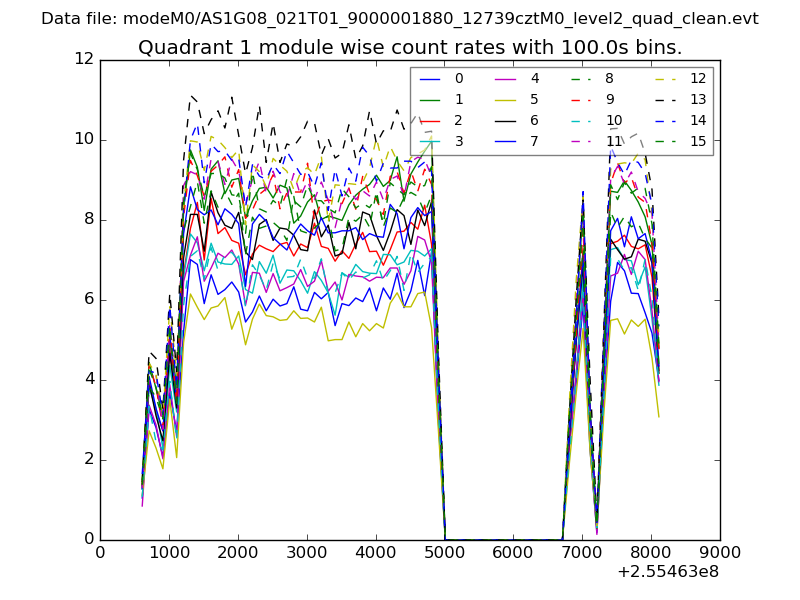
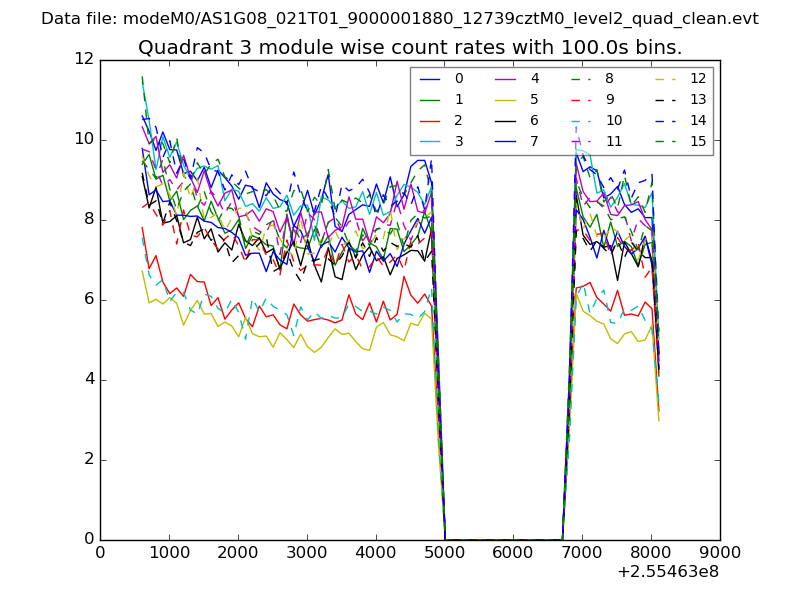
| Module-wise count rates for Quadrant A Data is divided into 100 sec bins |
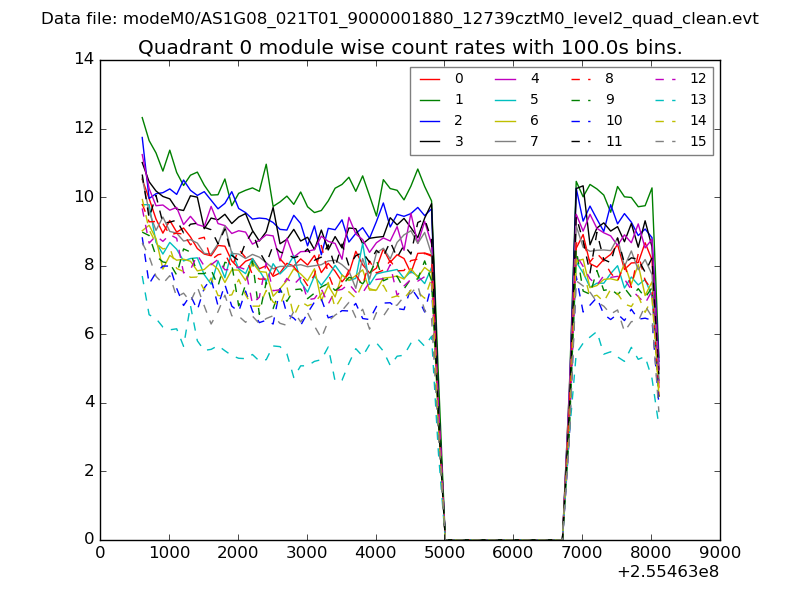 |
 |
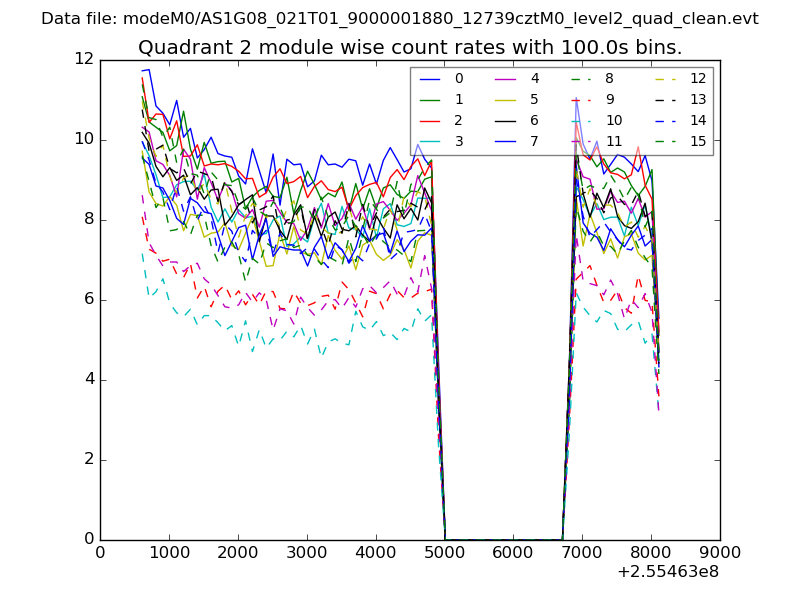
| Module-wise count rates for Quadrant B Data is divided into 100 sec bins |
 |
 |
| Module-wise count rates for Quadrant C Data is divided into 100 sec bins |
 |
 |
| Module-wise count rates for Quadrant D Data is divided into 100 sec bins |
 |
 |
| Parameter | Plot |
|---|---|
| CZT HV Monitor | 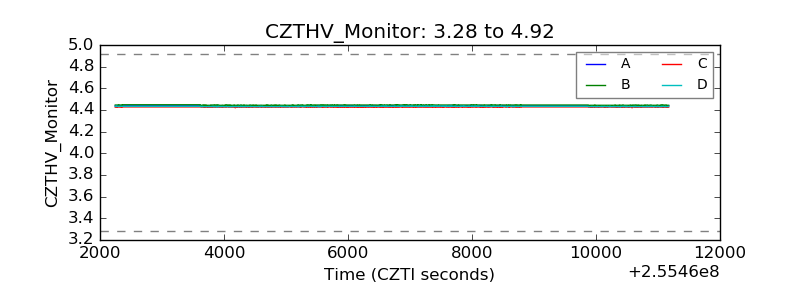 |
| D_VDD | 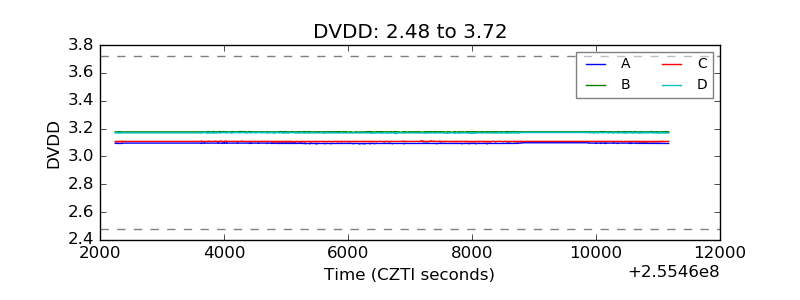 |
| Temperature 1 | 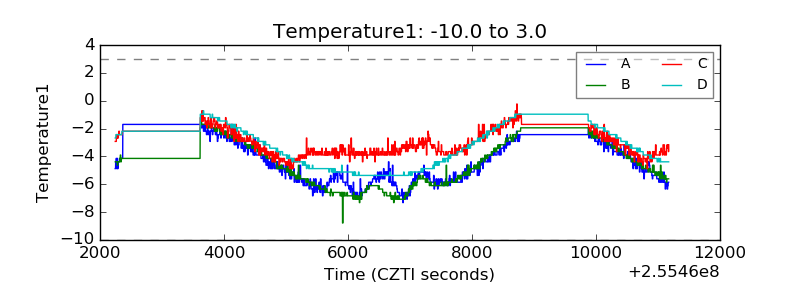 |
| Veto HV Monitor | 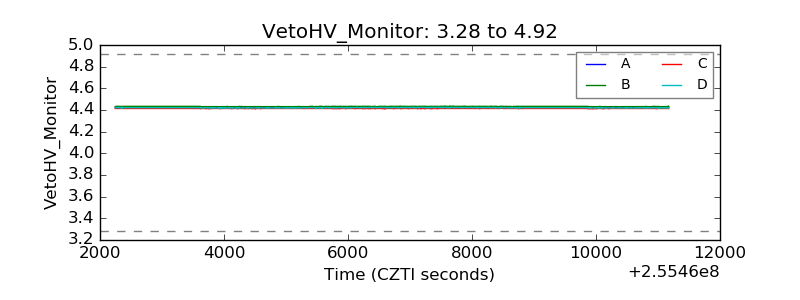 |
| Veto LLD | 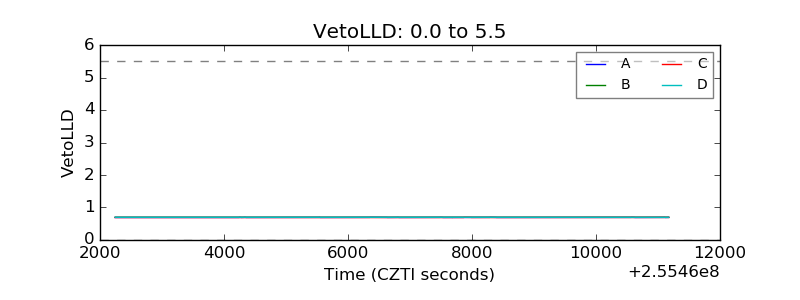 |
| Alpha Counter | 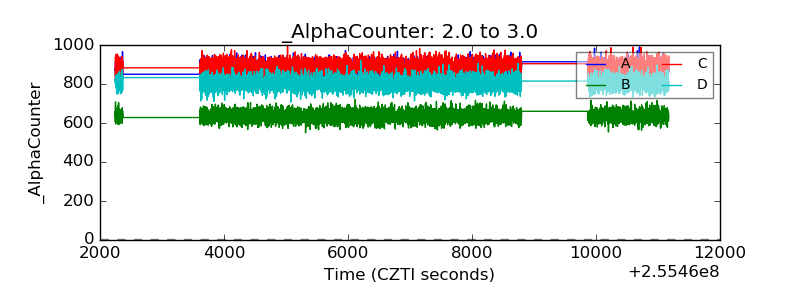 |
| _CPM_Rate | 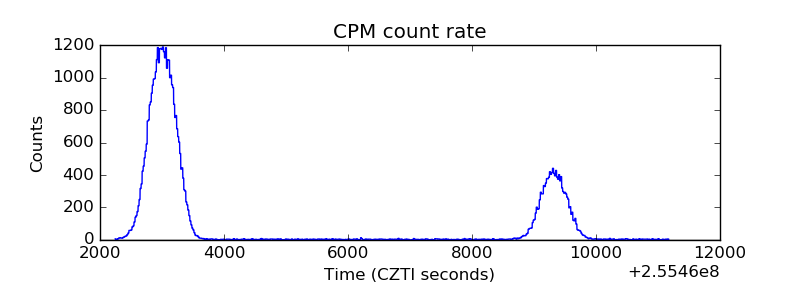 |
| CZT Counter | 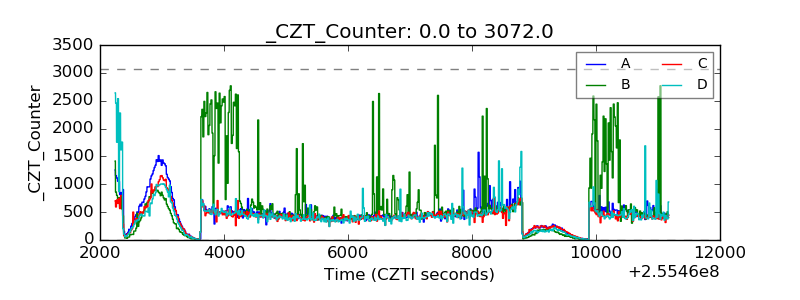 |
| +2.5 Volts monitor |  |
| +5 Volts monitor |  |
| _ROLL_ROT | 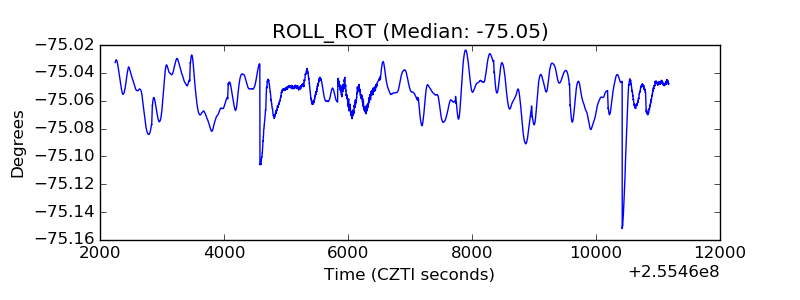 |
| _Roll_DEC | 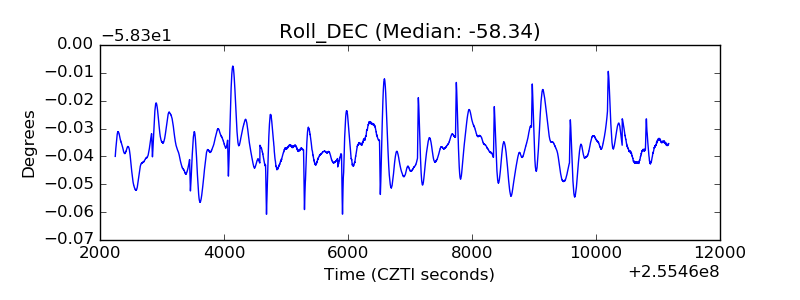 |
| _Roll_RA | 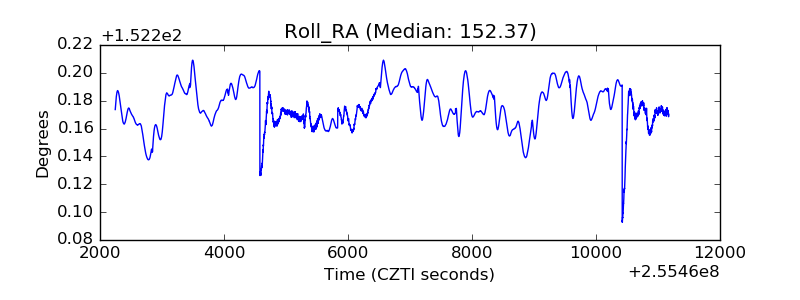 |
| Veto Counter | 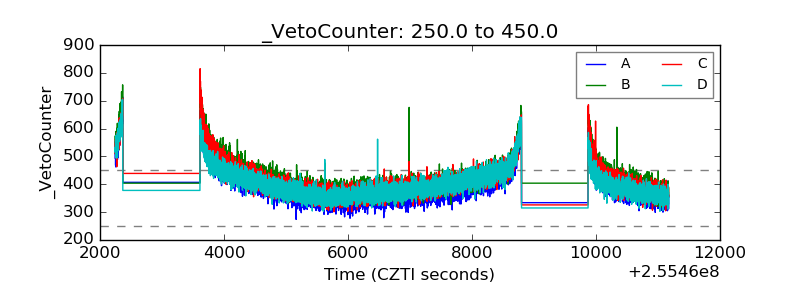 |