| Param | Original file | Final file |
|---|---|---|
| Filename | modeM0/AS1G08_021T01_9000001880_12740cztM0_level2.evt | modeM0/AS1G08_021T01_9000001880_12740cztM0_level2_quad_clean.evt |
| Size (bytes) | 603,270,720 | 106,283,520 |
| Size | 575.3 MB | 101.4 MB |
| Events in quadrant A | 4,180,684 | 697,275 |
| Events in quadrant B | 5,553,375 | 656,271 |
| Events in quadrant C | 3,347,748 | 689,566 |
| Events in quadrant D | 4,674,393 | 648,343 |
| Mode M0 | |||
|---|---|---|---|
| Quadrant | BADHDUFLAG | Total packets | Discarded packets |
| A | 0 | 17635 | 3 |
| B | 0 | 21729 | 2 |
| C | 0 | 15465 | 2 |
| D | 0 | 19494 | 2 |
| Mode SS | |||
|---|---|---|---|
| Quadrant | BADHDUFLAG | Total packets | Discarded packets |
| A | 0 | 158 | 0 |
| B | 0 | 158 | 0 |
| C | 0 | 158 | 0 |
| D | 0 | 158 | 0 |
| Mode M9 | |||
|---|---|---|---|
| Quadrant | BADHDUFLAG | Total packets | Discarded packets |
| A | 0 | 17 | 0 |
| B | 0 | 17 | 0 |
| C | 0 | 17 | 0 |
| D | 0 | 17 | 0 |
| Quadrant | Total seconds | Saturated seconds | Saturation percentage |
|---|---|---|---|
| A | 7568 | 103 | 1.360994% |
| B | 7568 | 932 | 12.315011% |
| C | 7568 | 23 | 0.303911% |
| D | 7568 | 379 | 5.007928% |
Noise dominated data is calculated using 1-second bins in cleaned event files. If a bin has >2000 counts, and if more than 50% of those come from <1% of pixels, then it is considered to be noise-dominated and hence unusable.
| Quadrant | # 1 sec bins | Bins with >0 counts | Bins with >2000 counts | High rate bins dominated by noise | Noise dominated (total time) | Noise dominated (detector-on time) | Marked lightcurve |
|---|---|---|---|---|---|---|---|
| A | 9364 | 7572 | 7 | 7 | 0.07% | 0.09% | 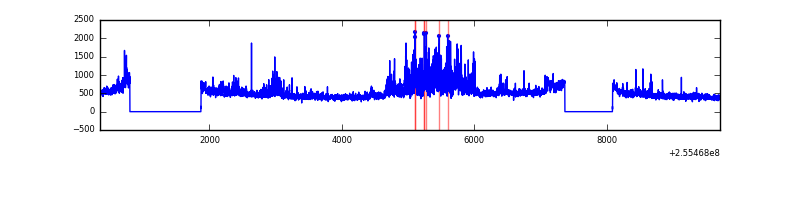 |
| B | 9364 | 7572 | 510 | 510 | 5.45% | 6.74% | 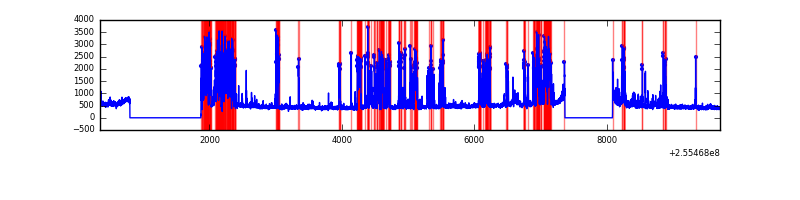 |
| C | 9364 | 7572 | 1 | 1 | 0.01% | 0.01% | 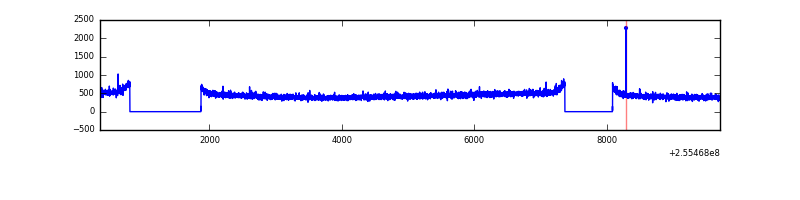 |
| D | 9364 | 7572 | 300 | 300 | 3.20% | 3.96% | 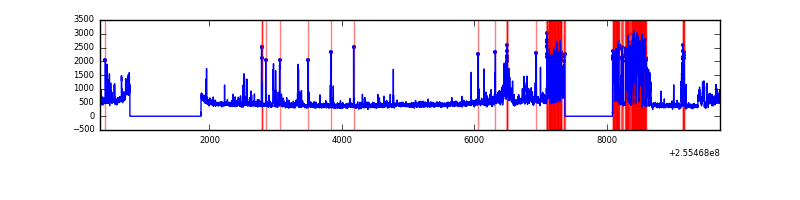 |
Top three noisy pixels from each quadrant. If the there are fewer than three noisy pixels in the level2.evt file, extra rows are filled as -1
| Pixel properties | Quadrant properties | ||||||
|---|---|---|---|---|---|---|---|
| Quadrant | DetID | PixID | Counts | Sigma | Mean | Median | Sigma |
| A | 8 | 15 | 666792 | 3714.72 | 883 | 864 | 179.3 |
| A | 12 | 189 | 46432 | 254.19 | 883 | 864 | 179.3 |
| A | 15 | 222 | 39668 | 216.46 | 883 | 864 | 179.3 |
| B | 4 | 239 | 1945564 | 12349.98 | 832 | 812 | 157.5 |
| B | 0 | 85 | 229279 | 1450.86 | 832 | 812 | 157.5 |
| B | 3 | 64 | 35436 | 219.88 | 832 | 812 | 157.5 |
| C | 13 | 61 | 6323 | 27.77 | 857 | 860 | 196.7 |
| C | 14 | 234 | 4101 | 16.47 | 857 | 860 | 196.7 |
| C | 8 | 222 | 3413 | 12.98 | 857 | 860 | 196.7 |
| D | 1 | 52 | 753633 | 3850.04 | 830 | 810 | 195.5 |
| D | 10 | 157 | 581200 | 2968.19 | 830 | 810 | 195.5 |
| D | 10 | 199 | 110919 | 563.11 | 830 | 810 | 195.5 |
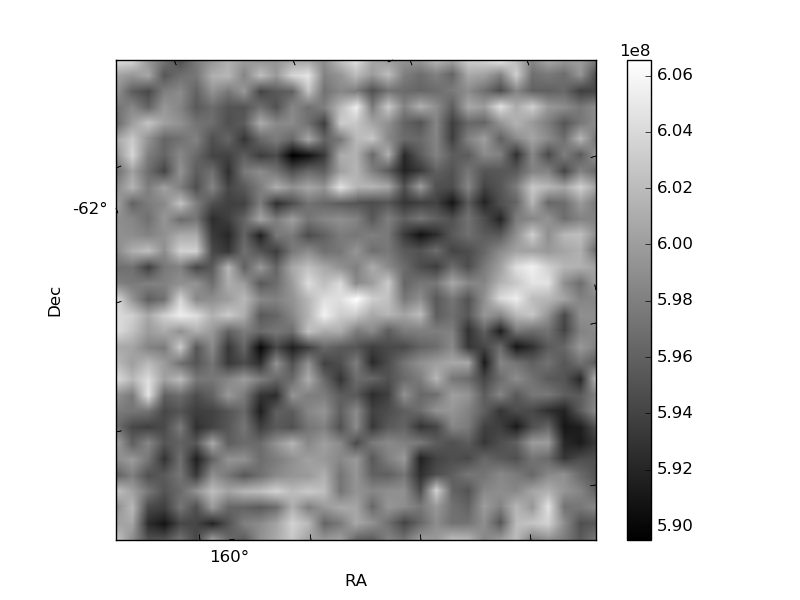
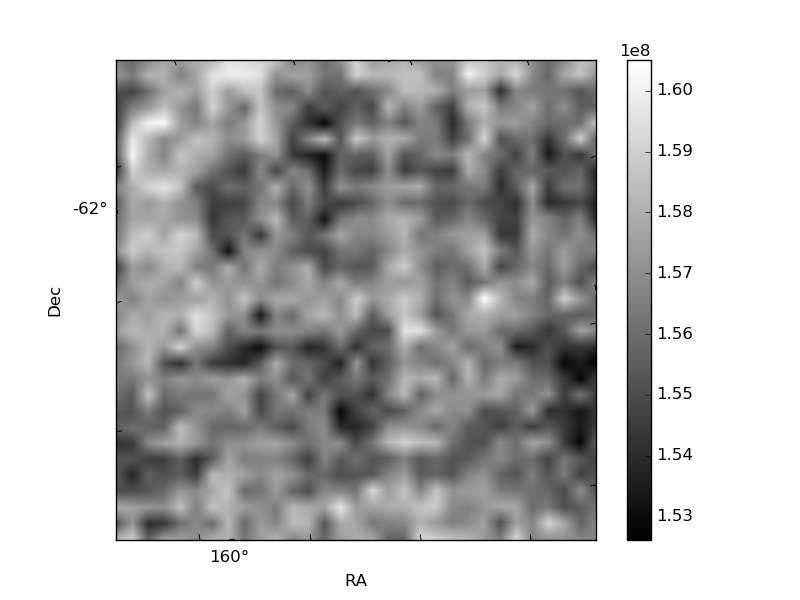
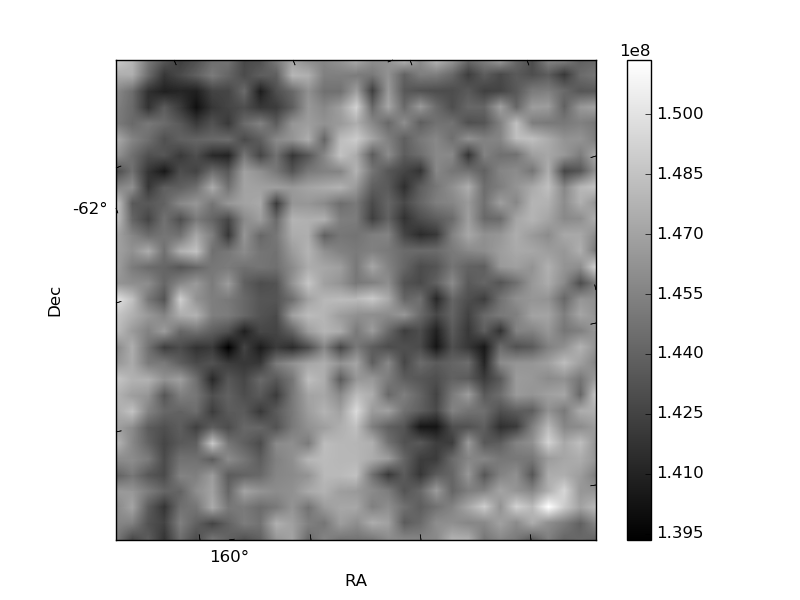
Histogram calculated using DETX and DETY for each event in the final _common_clean file
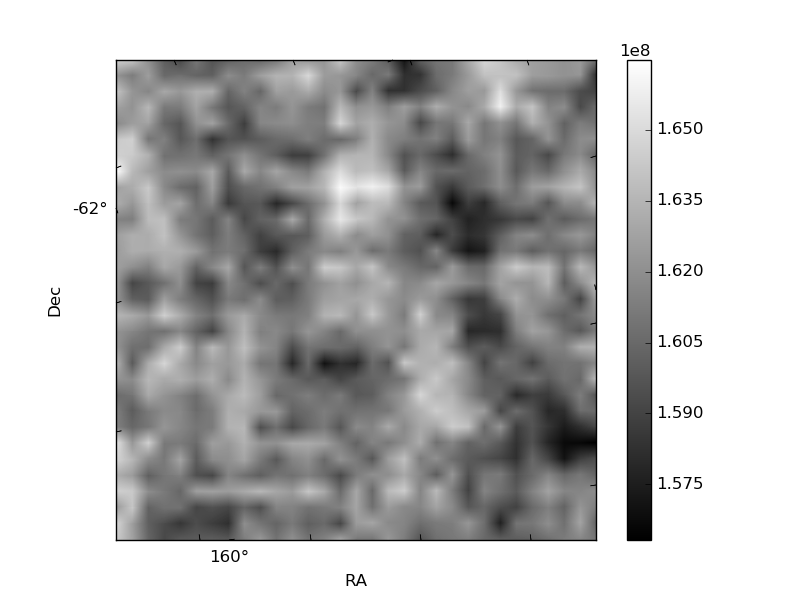
| Quadrant A | 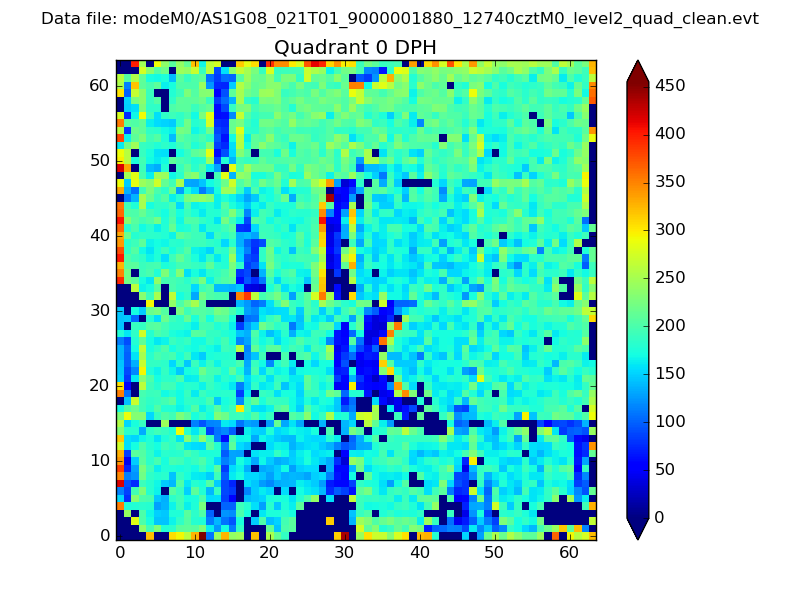 |
 |
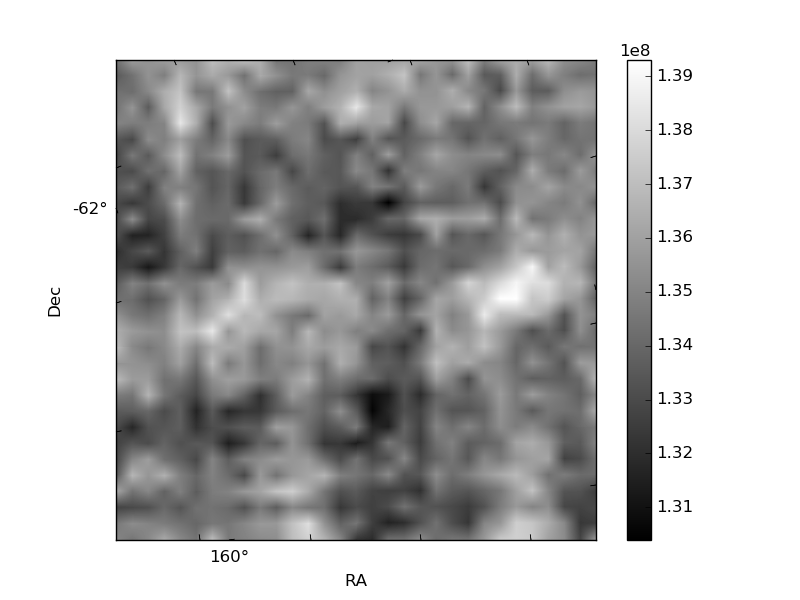
Quadrant B |
|---|---|---|---|
| Quadrant D | 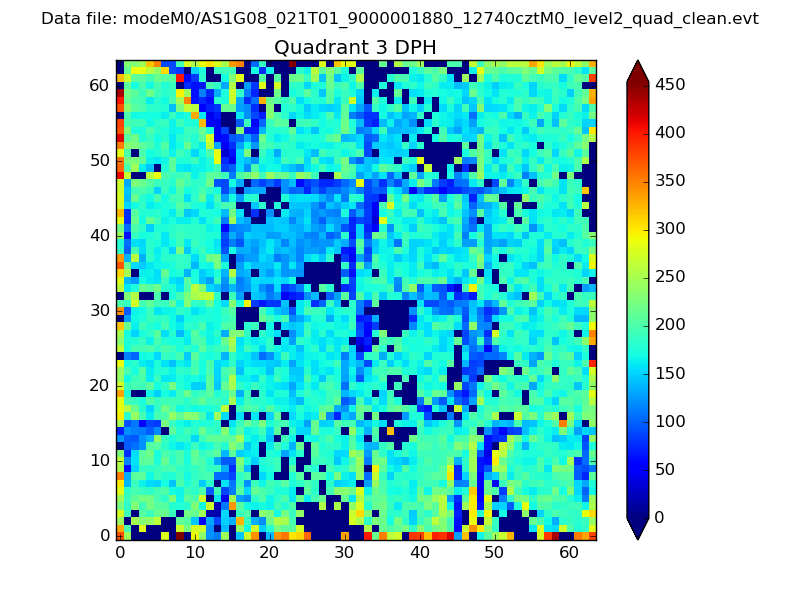 |
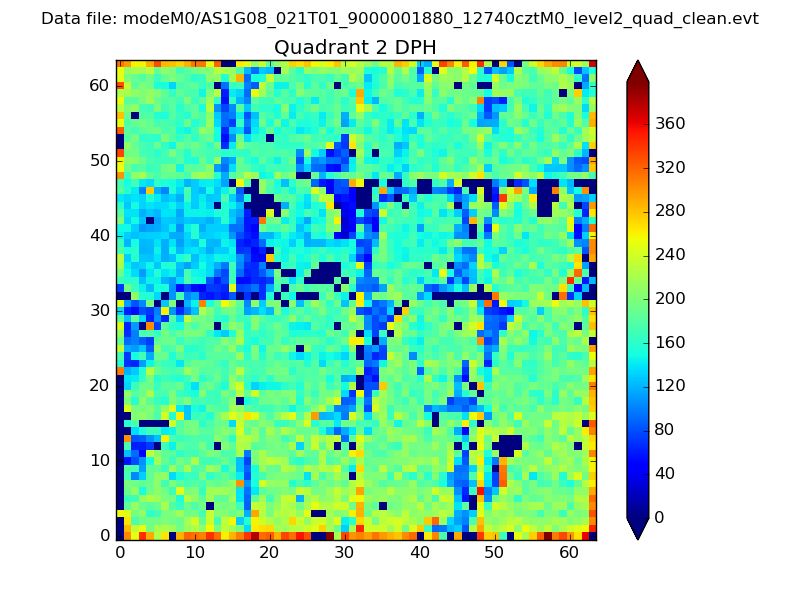 |
Quadrant C |
| Plot type | Count rate plots | Images |
|---|---|---|
| Comparison with Poisson distribution Blue bars denote a histogram of data divided into 1 sec bins. Red curve is a Poisson curve with rate = median count rate of data. |
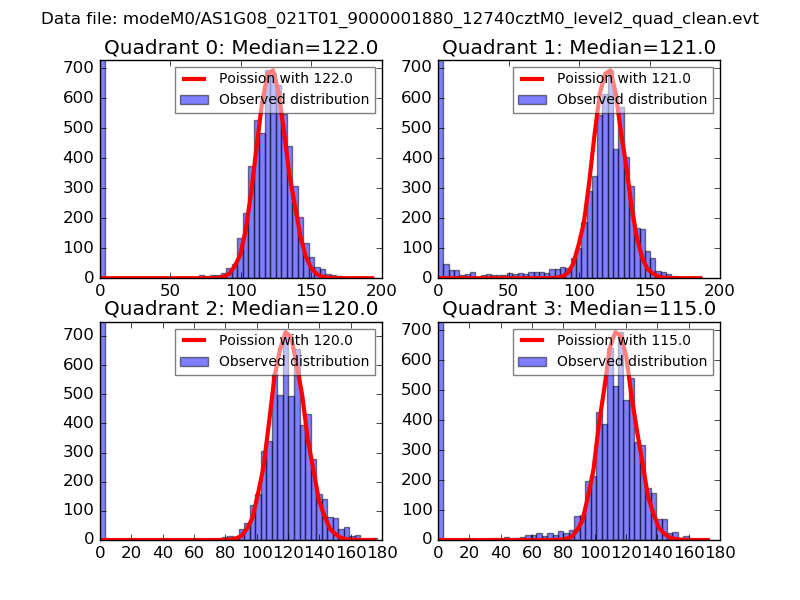 |
 |
| Quadrant-wise count rates Data is divided into 100 sec bins |
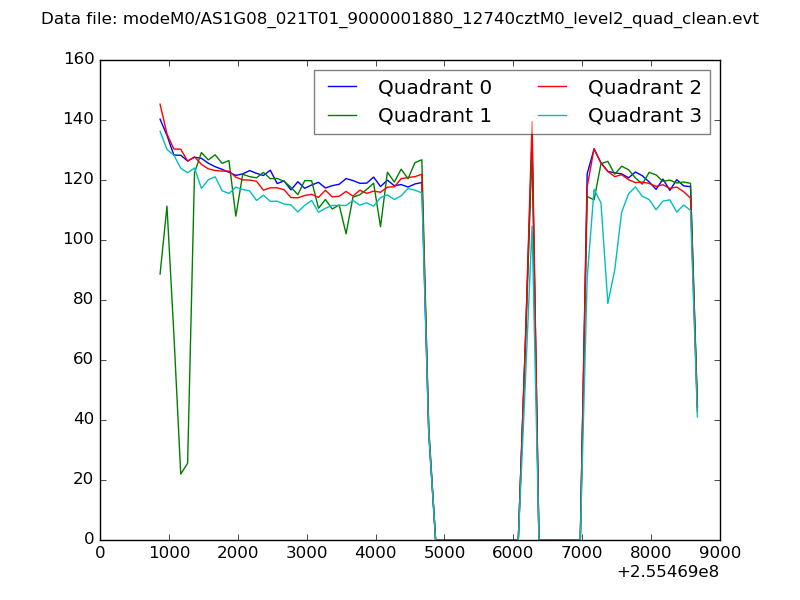 |
|
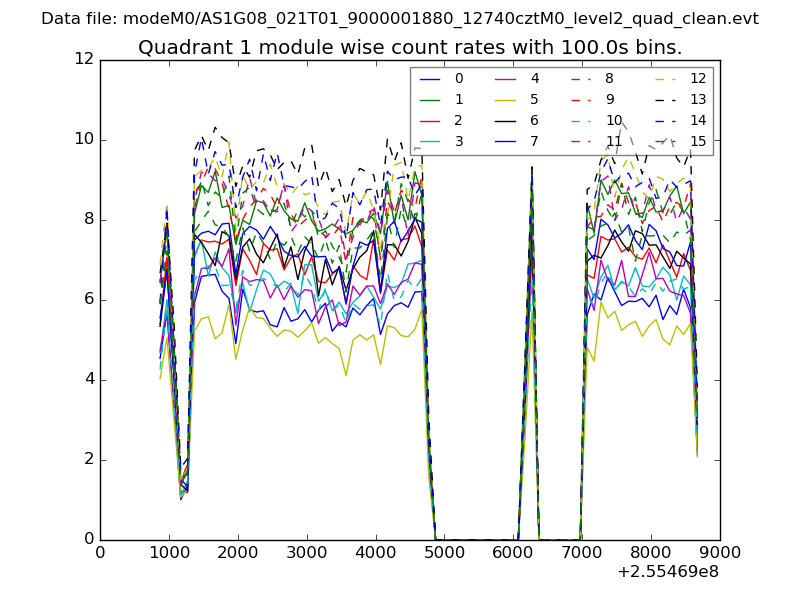
| Module-wise count rates for Quadrant A Data is divided into 100 sec bins |
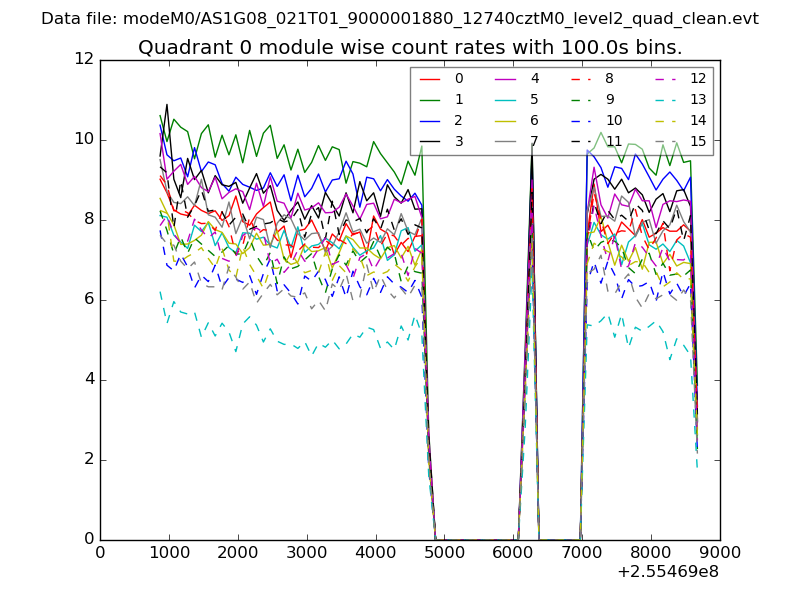 |
 |
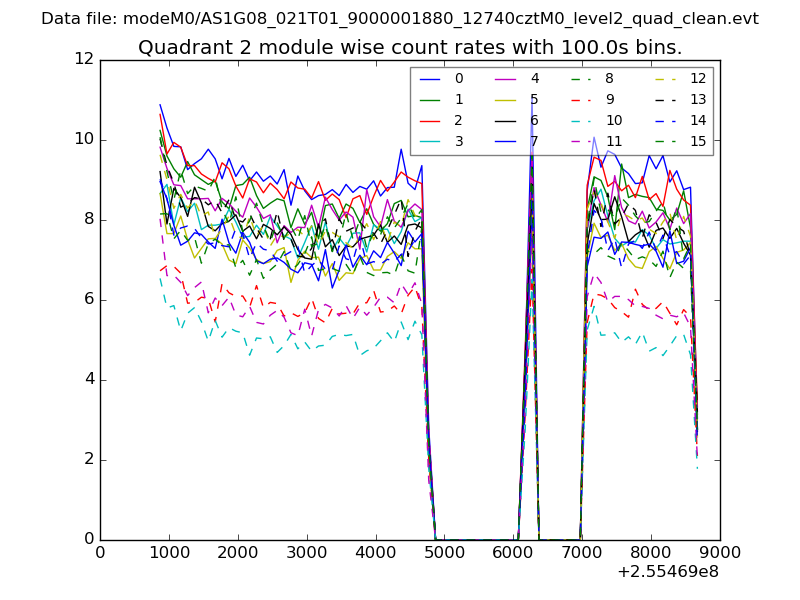
| Module-wise count rates for Quadrant B Data is divided into 100 sec bins |
 |
 |
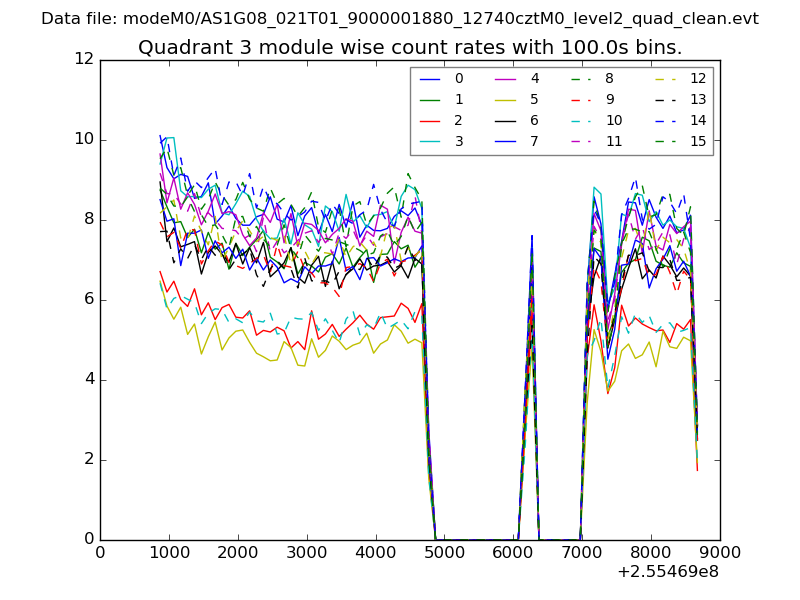
| Module-wise count rates for Quadrant C Data is divided into 100 sec bins |
 |
 |
| Module-wise count rates for Quadrant D Data is divided into 100 sec bins |
 |
 |
| Parameter | Plot |
|---|---|
| CZT HV Monitor | 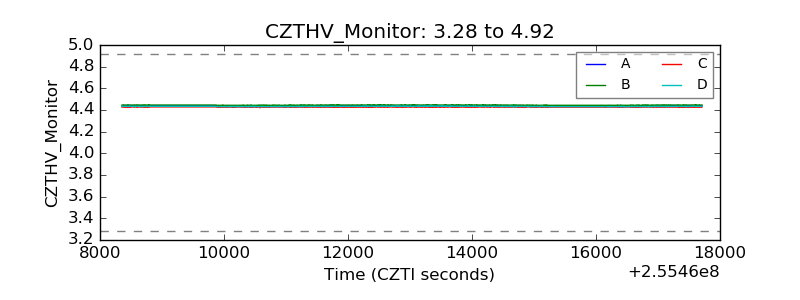 |
| D_VDD | 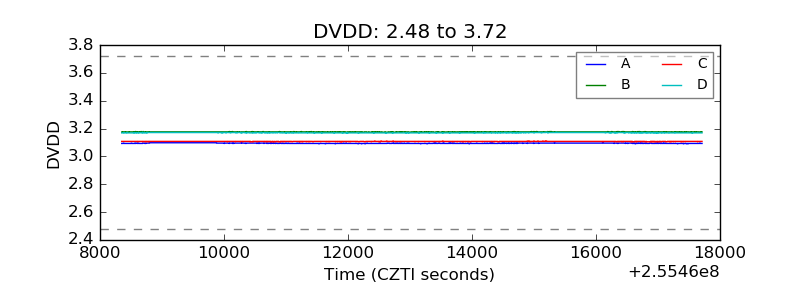 |
| Temperature 1 | 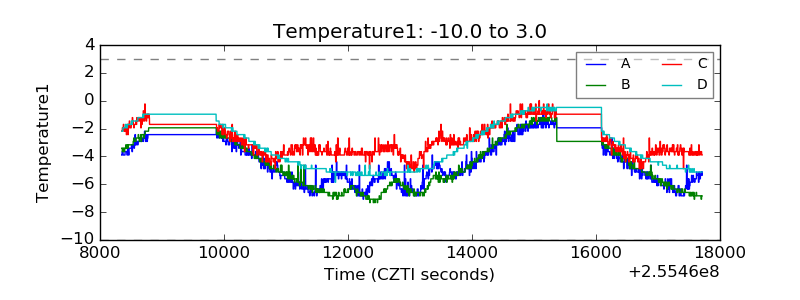 |
| Veto HV Monitor |  |
| Veto LLD | 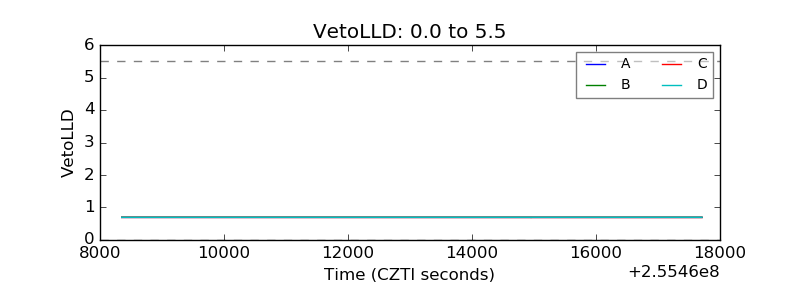 |
| Alpha Counter | 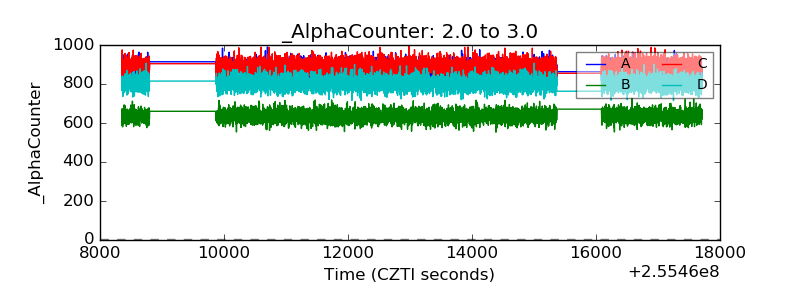 |
| _CPM_Rate | 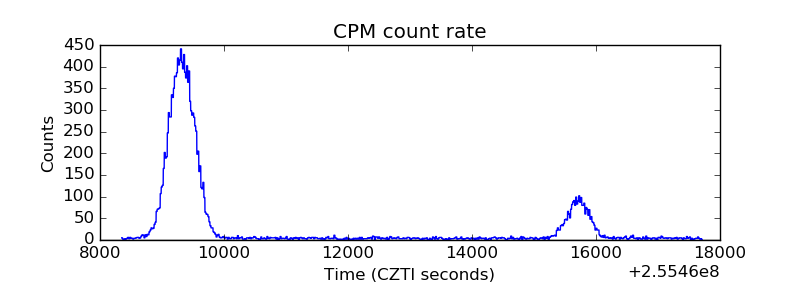 |
| CZT Counter | 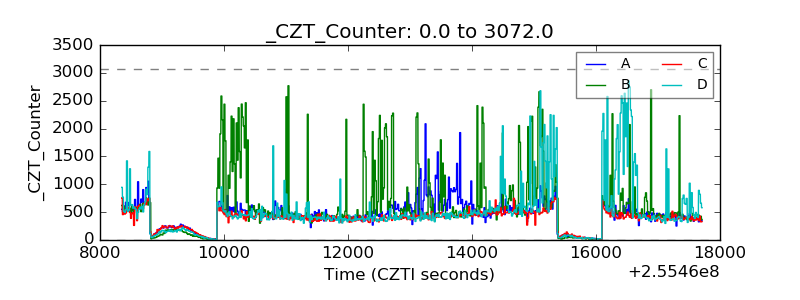 |
| +2.5 Volts monitor |  |
| +5 Volts monitor |  |
| _ROLL_ROT | 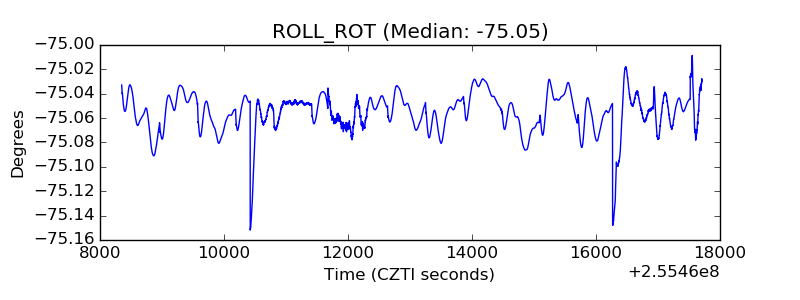 |
| _Roll_DEC |  |
| _Roll_RA | 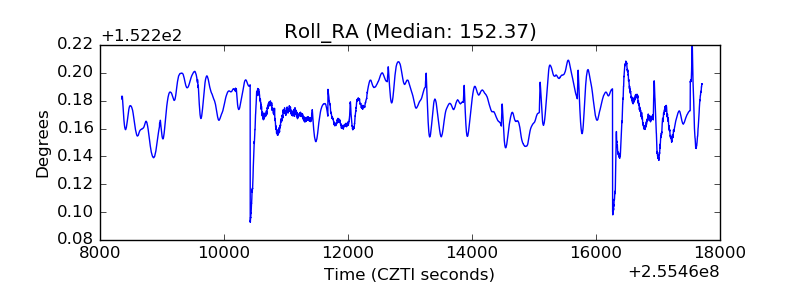 |
| Veto Counter | 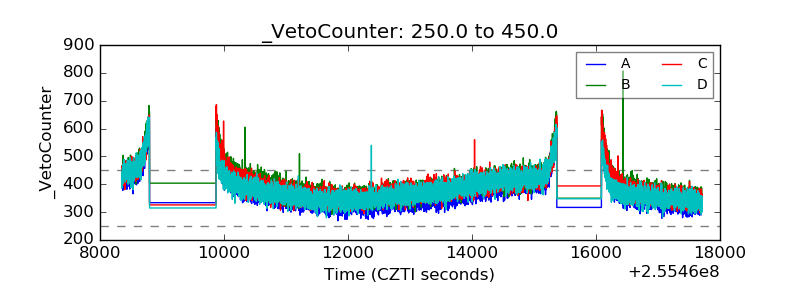 |