| Param | Original file | Final file |
|---|---|---|
| Filename | modeM0/AS1G08_021T01_9000001880_12742cztM0_level2.evt | modeM0/AS1G08_021T01_9000001880_12742cztM0_level2_quad_clean.evt |
| Size (bytes) | 612,722,880 | 120,631,680 |
| Size | 584.3 MB | 115.0 MB |
| Events in quadrant A | 3,776,267 | 792,572 |
| Events in quadrant B | 4,742,531 | 780,576 |
| Events in quadrant C | 3,474,989 | 786,632 |
| Events in quadrant D | 6,020,212 | 737,294 |
| Mode M0 | |||
|---|---|---|---|
| Quadrant | BADHDUFLAG | Total packets | Discarded packets |
| A | 0 | 16775 | 3 |
| B | 0 | 19443 | 2 |
| C | 0 | 16177 | 2 |
| D | 0 | 23748 | 2 |
| Mode SS | |||
|---|---|---|---|
| Quadrant | BADHDUFLAG | Total packets | Discarded packets |
| A | 0 | 164 | 0 |
| B | 0 | 164 | 0 |
| C | 0 | 164 | 0 |
| D | 0 | 164 | 0 |
| Mode M9 | |||
|---|---|---|---|
| Quadrant | BADHDUFLAG | Total packets | Discarded packets |
| A | 0 | 8 | 0 |
| B | 0 | 8 | 0 |
| C | 0 | 8 | 0 |
| D | 0 | 8 | 0 |
| Quadrant | Total seconds | Saturated seconds | Saturation percentage |
|---|---|---|---|
| A | 8002 | 42 | 0.524869% |
| B | 8002 | 356 | 4.448888% |
| C | 8002 | 11 | 0.137466% |
| D | 8002 | 313 | 3.911522% |
Noise dominated data is calculated using 1-second bins in cleaned event files. If a bin has >2000 counts, and if more than 50% of those come from <1% of pixels, then it is considered to be noise-dominated and hence unusable.
| Quadrant | # 1 sec bins | Bins with >0 counts | Bins with >2000 counts | High rate bins dominated by noise | Noise dominated (total time) | Noise dominated (detector-on time) | Marked lightcurve |
|---|---|---|---|---|---|---|---|
| A | 8758 | 8005 | 12 | 12 | 0.14% | 0.15% | 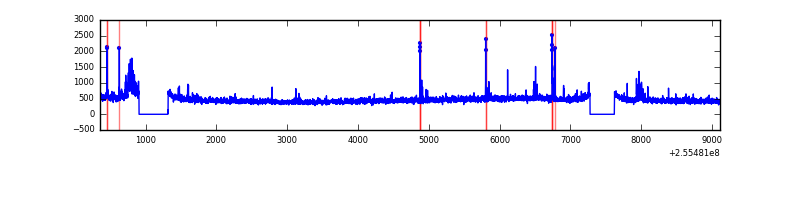 |
| B | 8758 | 8005 | 247 | 247 | 2.82% | 3.09% | 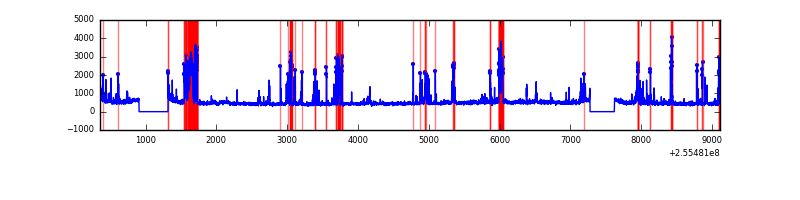 |
| C | 8758 | 8005 | 0 | 0 | 0.00% | 0.00% | 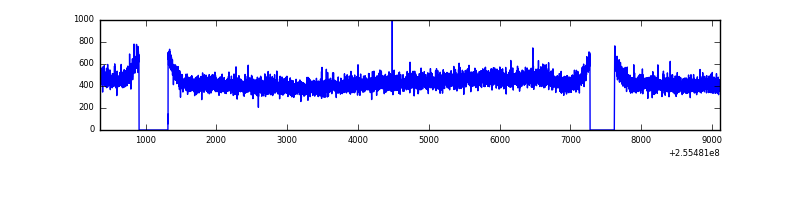 |
| D | 8758 | 8005 | 259 | 259 | 2.96% | 3.24% | 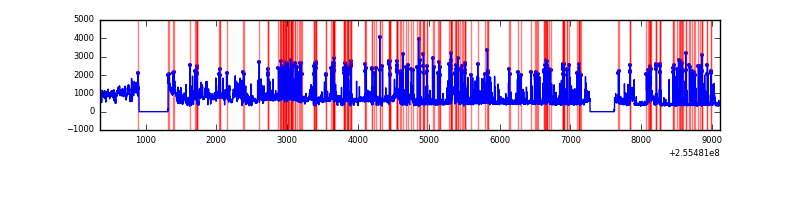 |
Top three noisy pixels from each quadrant. If the there are fewer than three noisy pixels in the level2.evt file, extra rows are filled as -1
| Pixel properties | Quadrant properties | ||||||
|---|---|---|---|---|---|---|---|
| Quadrant | DetID | PixID | Counts | Sigma | Mean | Median | Sigma |
| A | 8 | 15 | 121406 | 648.7 | 916 | 896 | 185.8 |
| A | 15 | 222 | 65391 | 347.17 | 916 | 896 | 185.8 |
| A | 7 | 16 | 36843 | 193.5 | 916 | 896 | 185.8 |
| B | 4 | 239 | 1009549 | 5881.76 | 903 | 877 | 171.5 |
| B | 3 | 209 | 72177 | 415.76 | 903 | 877 | 171.5 |
| B | 3 | 64 | 39228 | 223.63 | 903 | 877 | 171.5 |
| C | 3 | 233 | 9024 | 39.31 | 889 | 890 | 206.9 |
| C | 13 | 61 | 6626 | 27.72 | 889 | 890 | 206.9 |
| C | 3 | 202 | 2150 | 6.09 | 889 | 890 | 206.9 |
| D | 1 | 52 | 2583618 | 12680.35 | 863 | 843 | 203.7 |
| D | 2 | 136 | 68128 | 330.34 | 863 | 843 | 203.7 |
| D | 2 | 234 | 30424 | 145.23 | 863 | 843 | 203.7 |
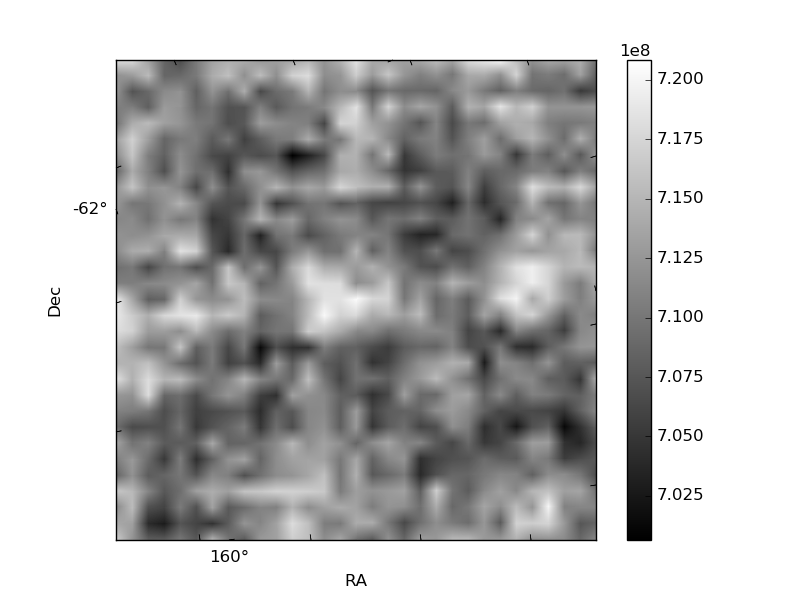
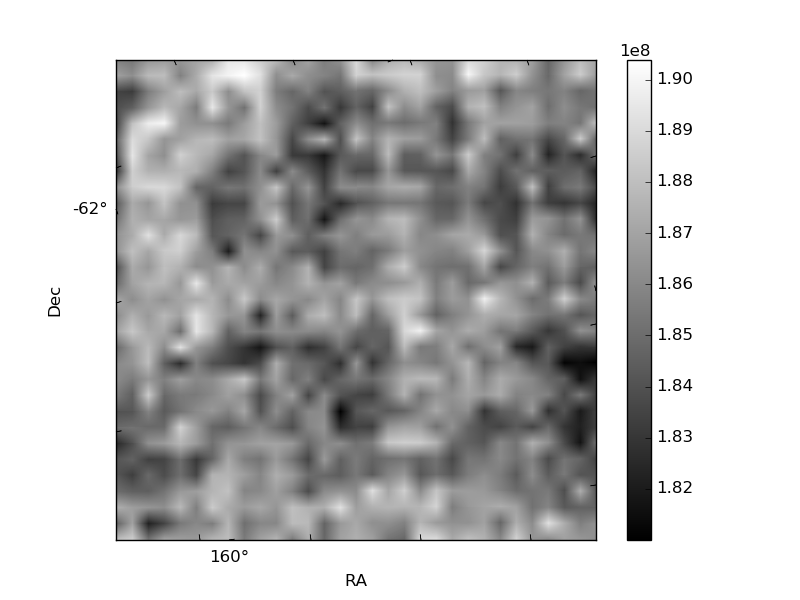
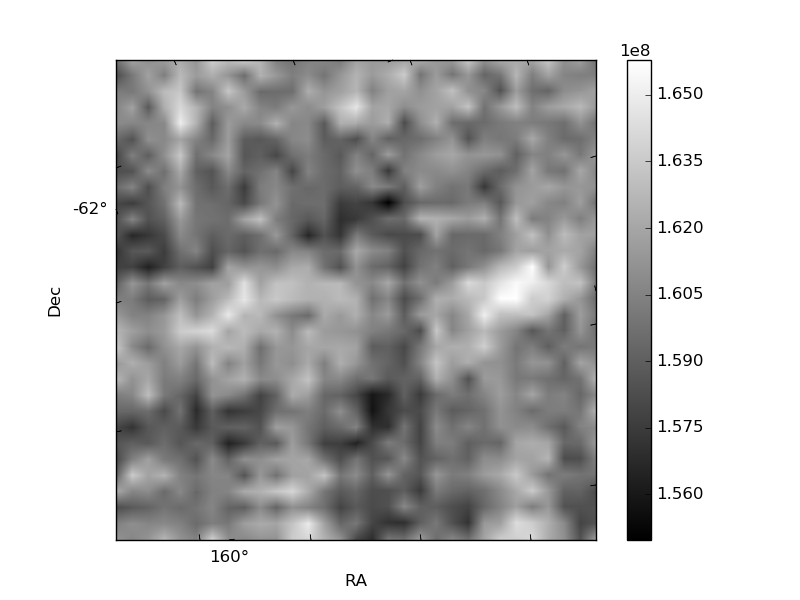
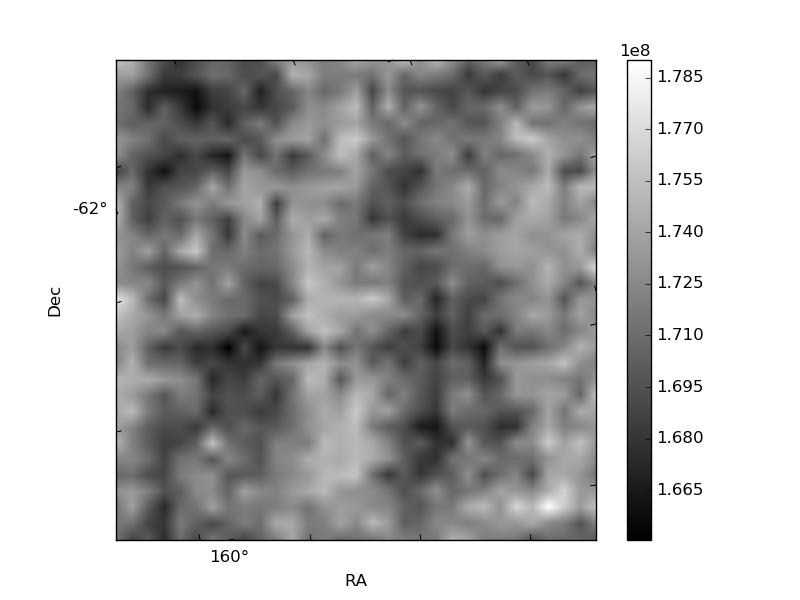
Histogram calculated using DETX and DETY for each event in the final _common_clean file
| Quadrant A | 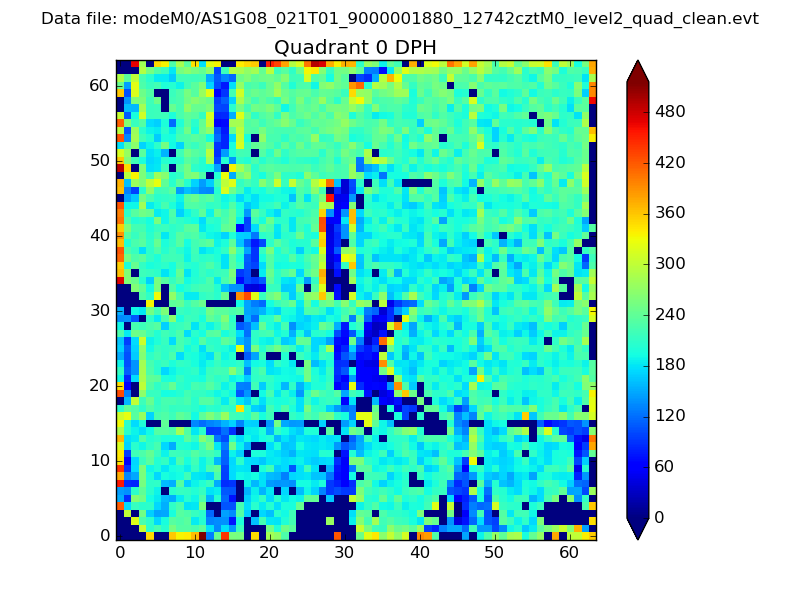 |
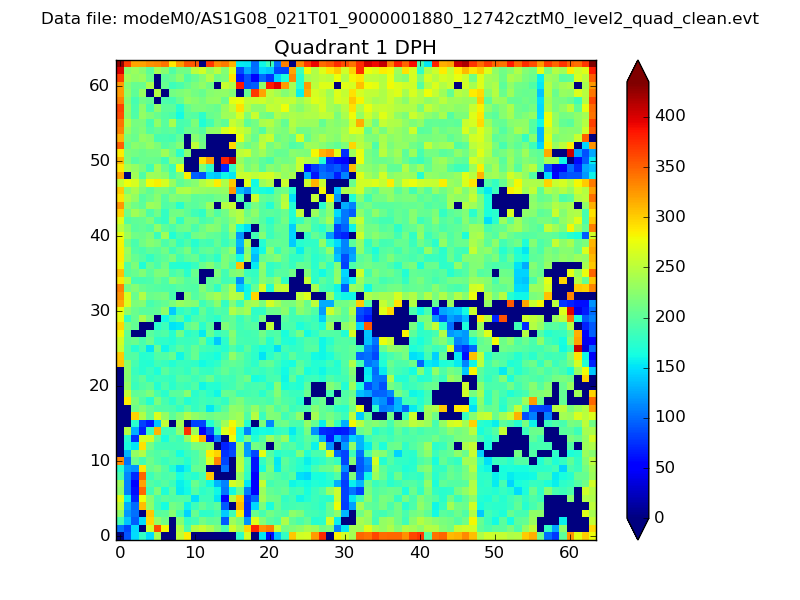 |
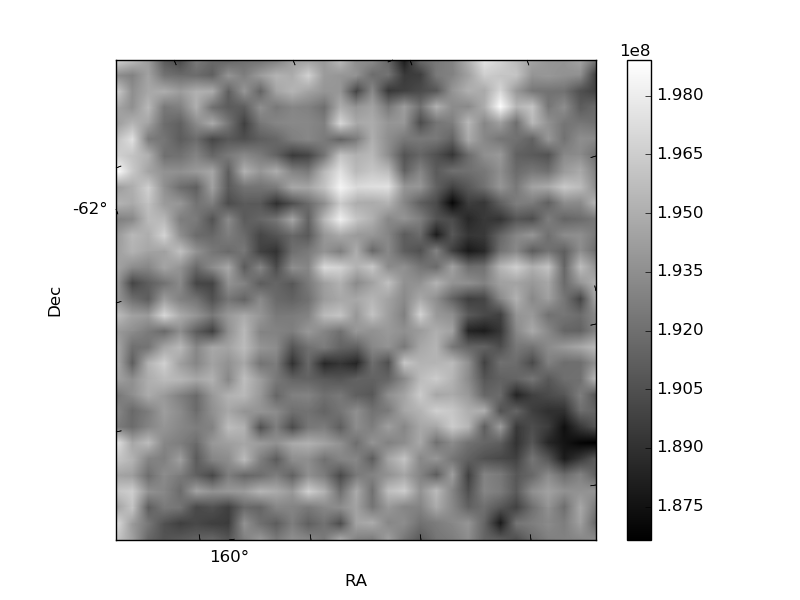
Quadrant B |
|---|---|---|---|
| Quadrant D | 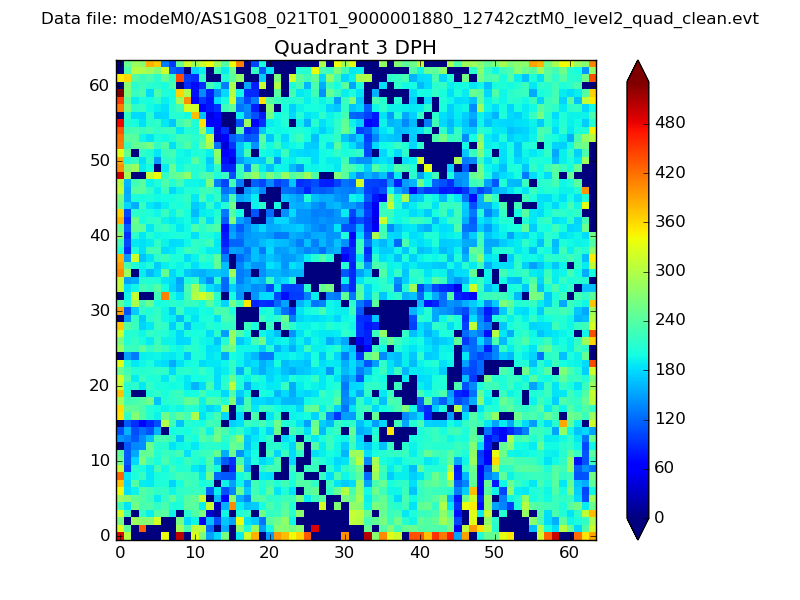 |
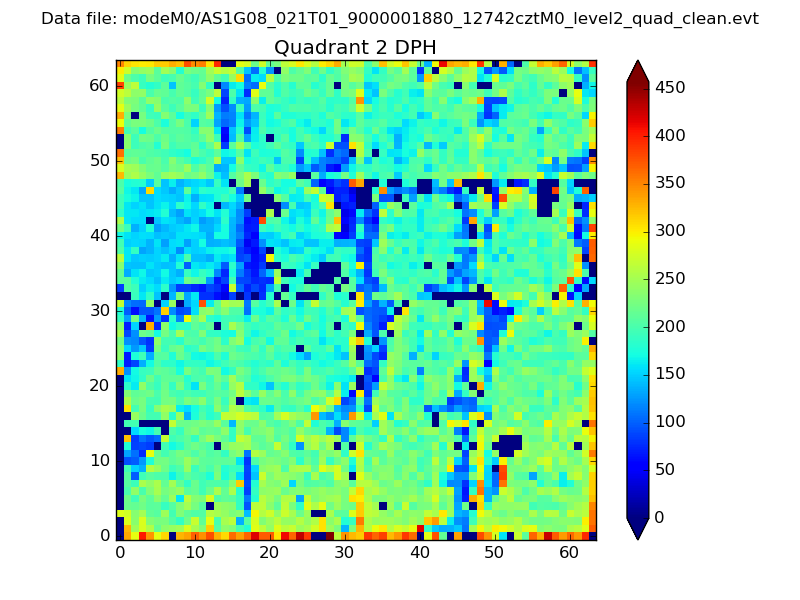 |
Quadrant C |
| Plot type | Count rate plots | Images |
|---|---|---|
| Comparison with Poisson distribution Blue bars denote a histogram of data divided into 1 sec bins. Red curve is a Poisson curve with rate = median count rate of data. |
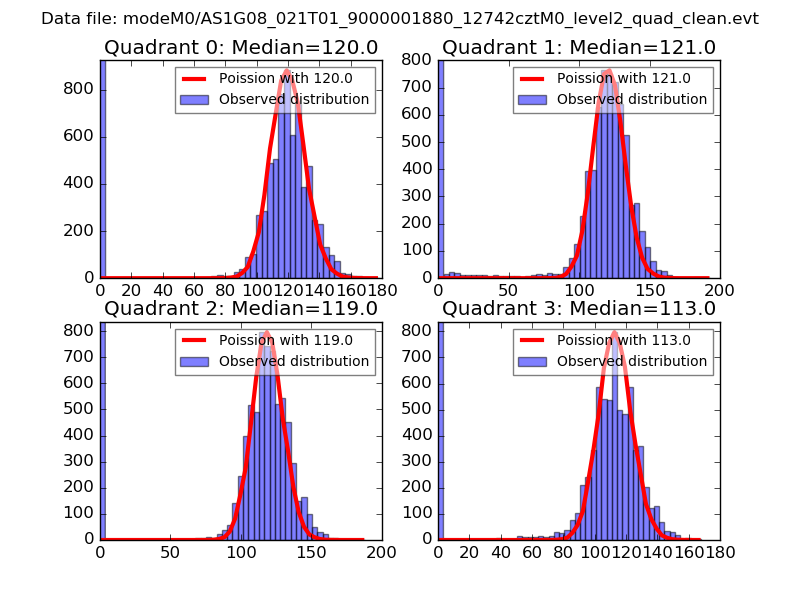 |
 |
| Quadrant-wise count rates Data is divided into 100 sec bins |
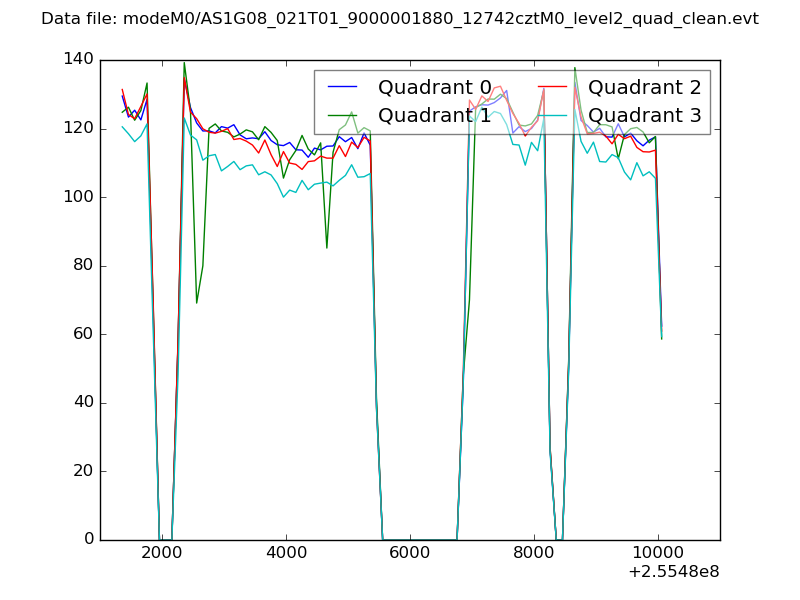 |
|
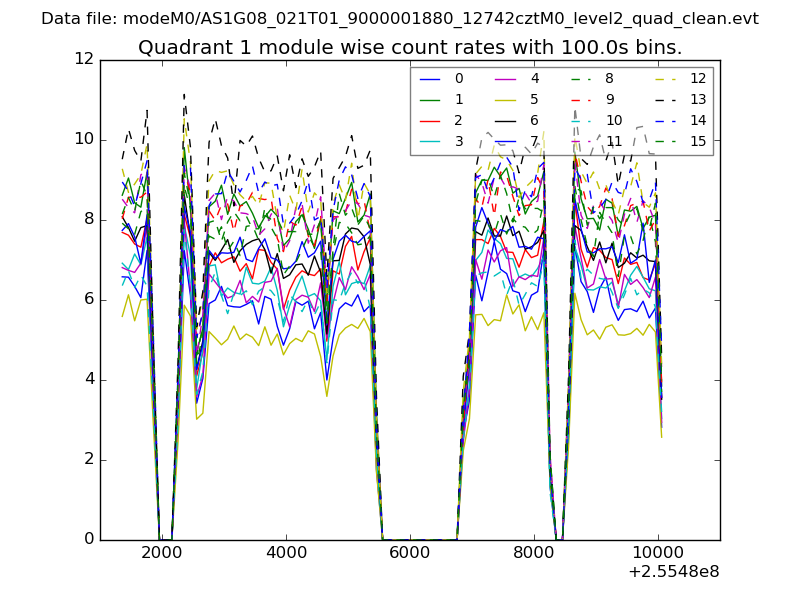
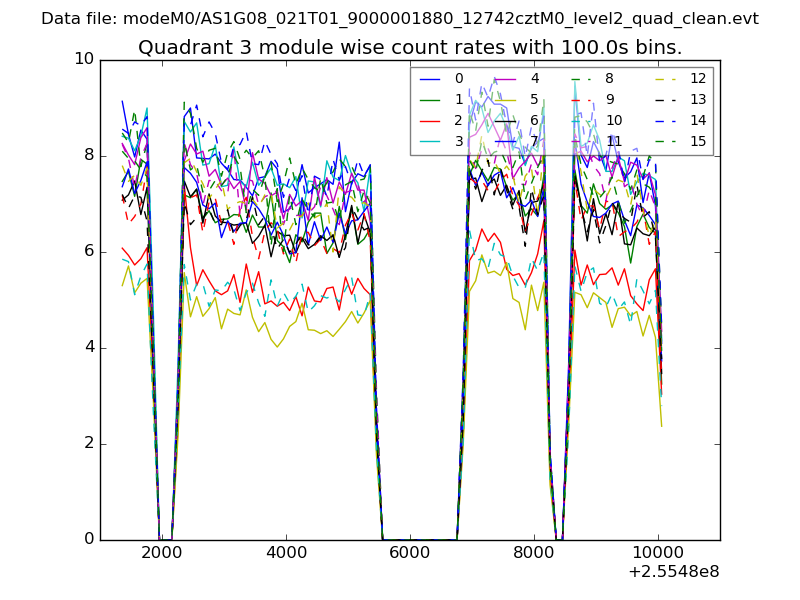
| Module-wise count rates for Quadrant A Data is divided into 100 sec bins |
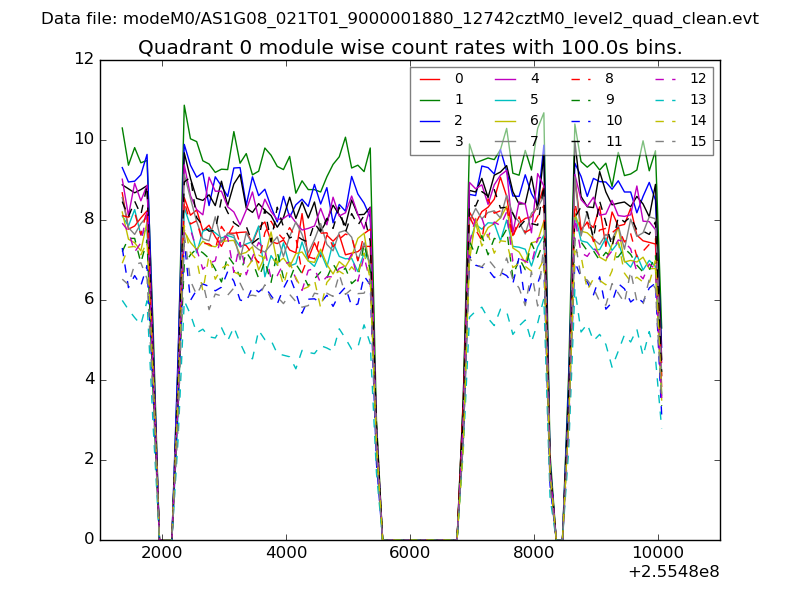 |
 |
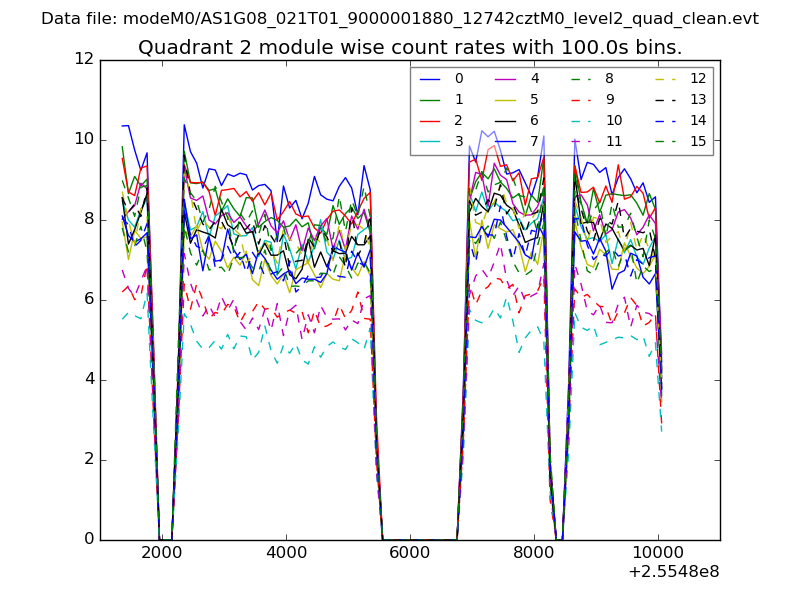
| Module-wise count rates for Quadrant B Data is divided into 100 sec bins |
 |
 |
| Module-wise count rates for Quadrant C Data is divided into 100 sec bins |
 |
 |
| Module-wise count rates for Quadrant D Data is divided into 100 sec bins |
 |
 |
| Parameter | Plot |
|---|---|
| CZT HV Monitor | 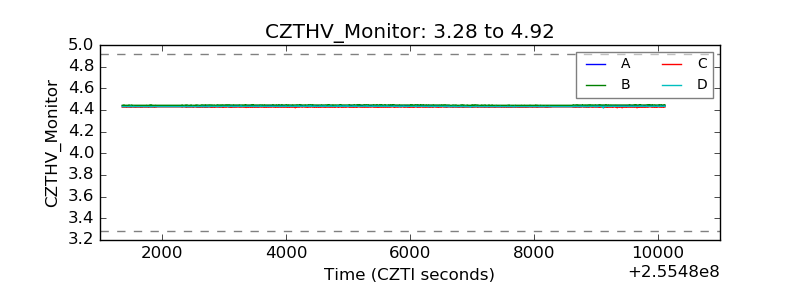 |
| D_VDD | 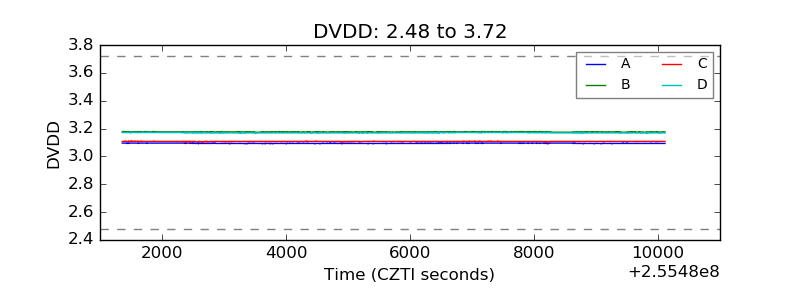 |
| Temperature 1 | 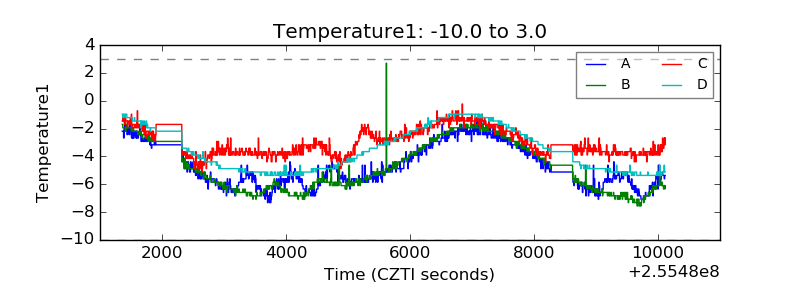 |
| Veto HV Monitor | 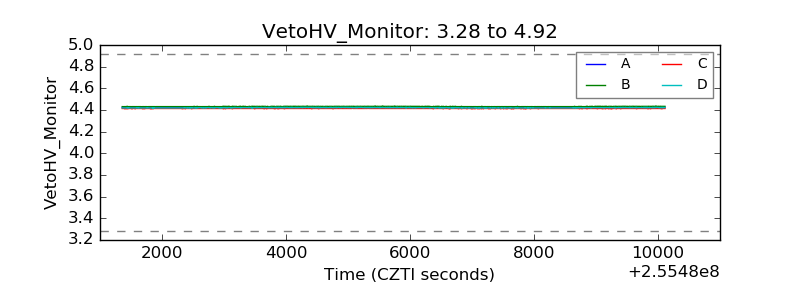 |
| Veto LLD | 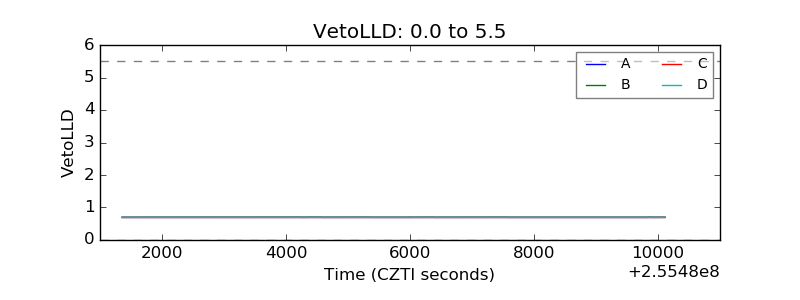 |
| Alpha Counter | 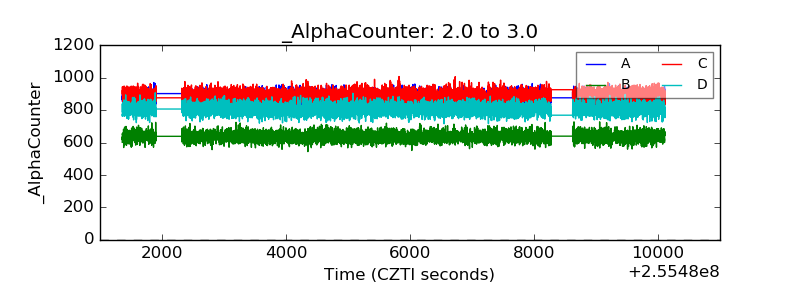 |
| _CPM_Rate | 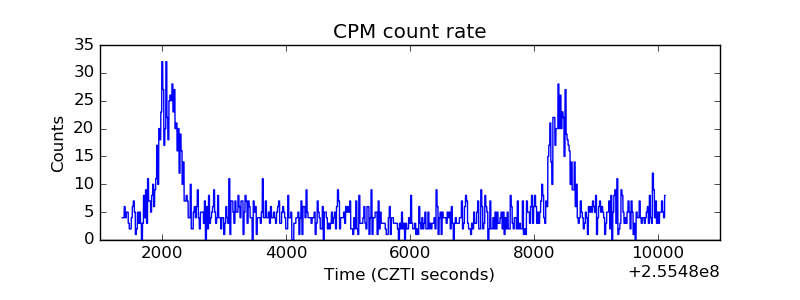 |
| CZT Counter | 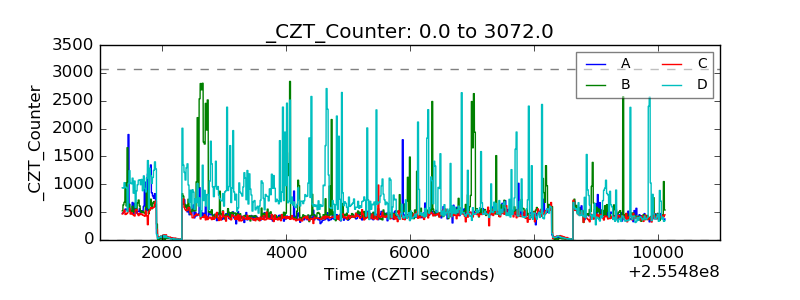 |
| +2.5 Volts monitor | 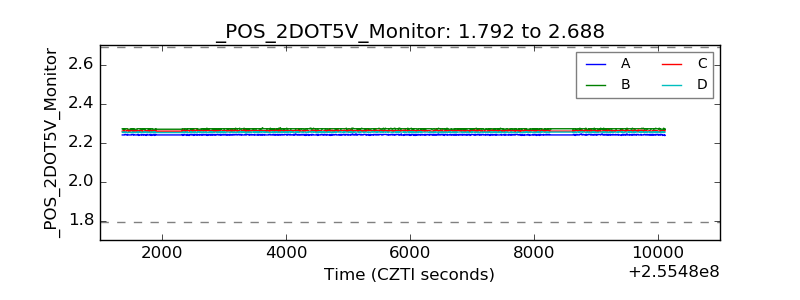 |
| +5 Volts monitor |  |
| _ROLL_ROT | 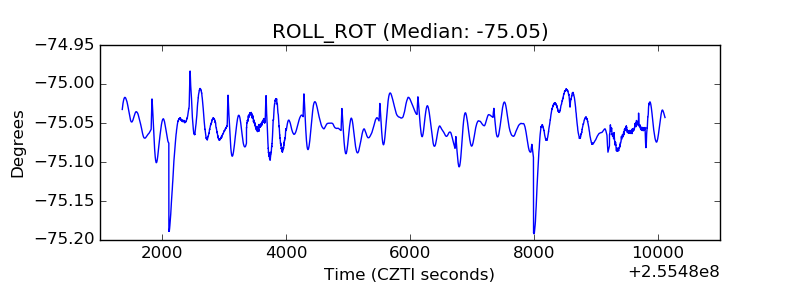 |
| _Roll_DEC | 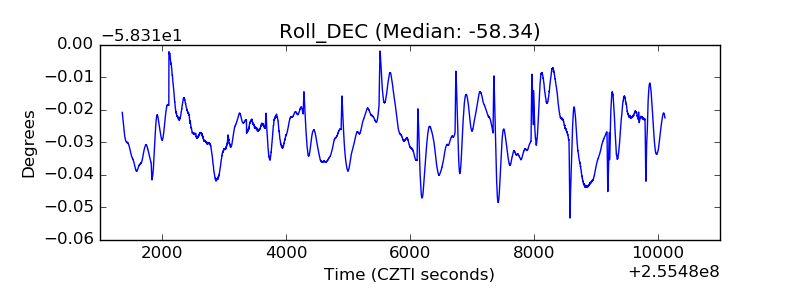 |
| _Roll_RA | 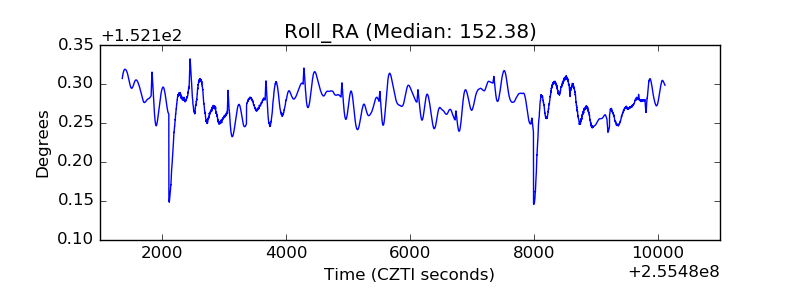 |
| Veto Counter | 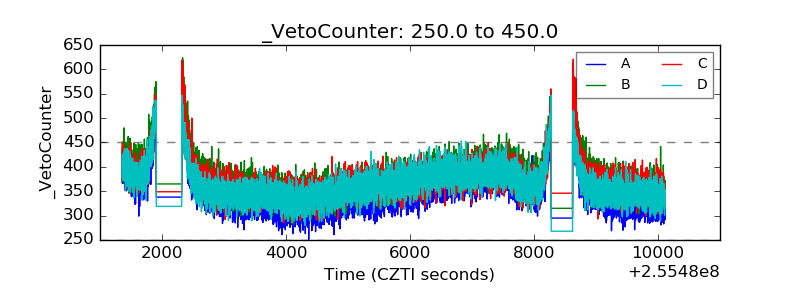 |