| Param | Original file | Final file |
|---|---|---|
| Filename | modeM0/AS1G08_021T01_9000001880_12743cztM0_level2.evt | modeM0/AS1G08_021T01_9000001880_12743cztM0_level2_quad_clean.evt |
| Size (bytes) | 1,097,893,440 | 242,677,440 |
| Size | 1.0 GB | 231.4 MB |
| Events in quadrant A | 6,871,171 | 1,623,932 |
| Events in quadrant B | 10,190,411 | 1,581,468 |
| Events in quadrant C | 6,564,479 | 1,590,249 |
| Events in quadrant D | 8,622,201 | 1,532,592 |
| Mode M0 | |||
|---|---|---|---|
| Quadrant | BADHDUFLAG | Total packets | Discarded packets |
| A | 0 | 30598 | 5 |
| B | 0 | 40249 | 3 |
| C | 0 | 30190 | 3 |
| D | 0 | 36403 | 3 |
| Mode SS | |||
|---|---|---|---|
| Quadrant | BADHDUFLAG | Total packets | Discarded packets |
| A | 0 | 300 | 0 |
| B | 0 | 300 | 0 |
| C | 0 | 300 | 0 |
| D | 0 | 300 | 0 |
| Mode M9 | |||
|---|---|---|---|
| Quadrant | BADHDUFLAG | Total packets | Discarded packets |
| A | 0 | 19 | 0 |
| B | 0 | 19 | 0 |
| C | 0 | 19 | 0 |
| D | 0 | 19 | 0 |
| Quadrant | Total seconds | Saturated seconds | Saturation percentage |
|---|---|---|---|
| A | 14809 | 141 | 0.952124% |
| B | 14809 | 1053 | 7.110541% |
| C | 14809 | 102 | 0.688770% |
| D | 14809 | 412 | 2.782092% |
Noise dominated data is calculated using 1-second bins in cleaned event files. If a bin has >2000 counts, and if more than 50% of those come from <1% of pixels, then it is considered to be noise-dominated and hence unusable.
| Quadrant | # 1 sec bins | Bins with >0 counts | Bins with >2000 counts | High rate bins dominated by noise | Noise dominated (total time) | Noise dominated (detector-on time) | Marked lightcurve |
|---|---|---|---|---|---|---|---|
| A | 50479 | 14813 | 1 | 1 | 0.00% | 0.01% | 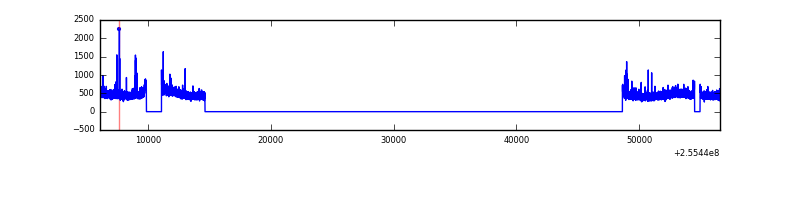 |
| B | 50479 | 14813 | 704 | 704 | 1.39% | 4.75% | 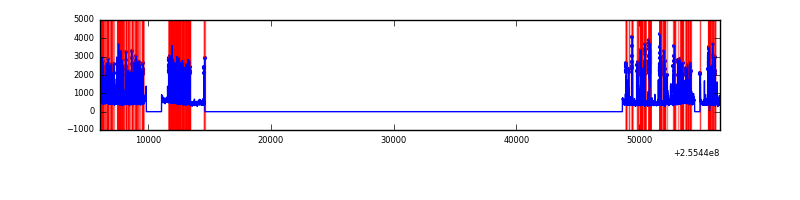 |
| C | 50479 | 14813 | 0 | 0 | 0.00% | 0.00% | 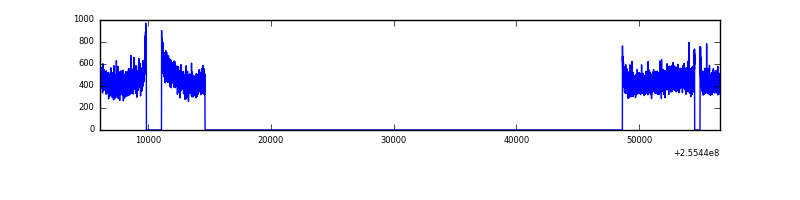 |
| D | 50479 | 14813 | 245 | 245 | 0.49% | 1.65% | 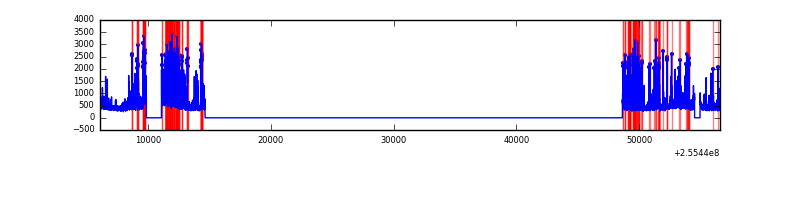 |
Top three noisy pixels from each quadrant. If the there are fewer than three noisy pixels in the level2.evt file, extra rows are filled as -1
| Pixel properties | Quadrant properties | ||||||
|---|---|---|---|---|---|---|---|
| Quadrant | DetID | PixID | Counts | Sigma | Mean | Median | Sigma |
| A | 8 | 15 | 71107 | 200.34 | 1740 | 1700 | 346.5 |
| A | 7 | 16 | 56156 | 157.18 | 1740 | 1700 | 346.5 |
| A | 12 | 189 | 48735 | 135.76 | 1740 | 1700 | 346.5 |
| B | 4 | 239 | 3038785 | 9642.5 | 1702 | 1663 | 315.0 |
| B | 0 | 85 | 147340 | 462.51 | 1702 | 1663 | 315.0 |
| B | 3 | 64 | 76271 | 236.87 | 1702 | 1663 | 315.0 |
| C | 3 | 233 | 13669 | 31.19 | 1678 | 1684 | 384.2 |
| C | 13 | 61 | 12462 | 28.05 | 1678 | 1684 | 384.2 |
| C | 8 | 128 | 8507 | 17.76 | 1678 | 1684 | 384.2 |
| D | 1 | 52 | 2042048 | 5244.98 | 1646 | 1603 | 389.0 |
| D | 10 | 199 | 146825 | 373.29 | 1646 | 1603 | 389.0 |
| D | 2 | 136 | 74048 | 186.22 | 1646 | 1603 | 389.0 |
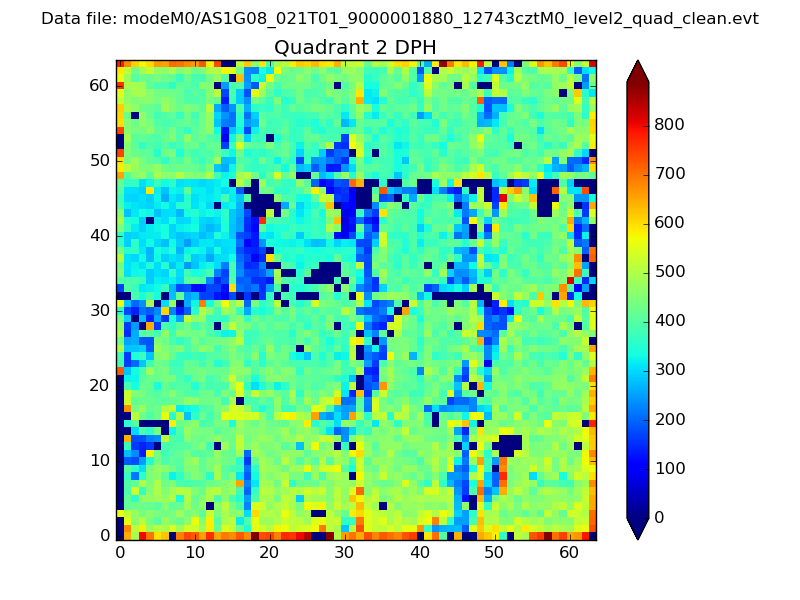
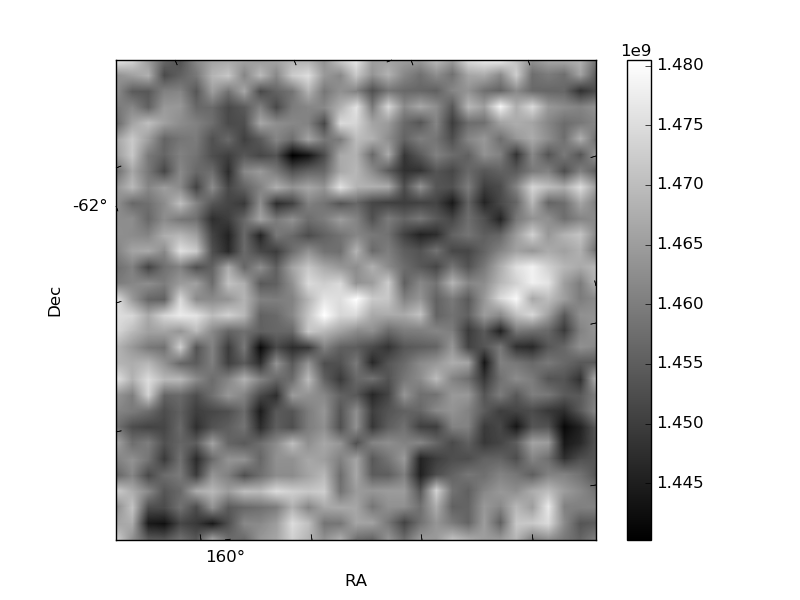
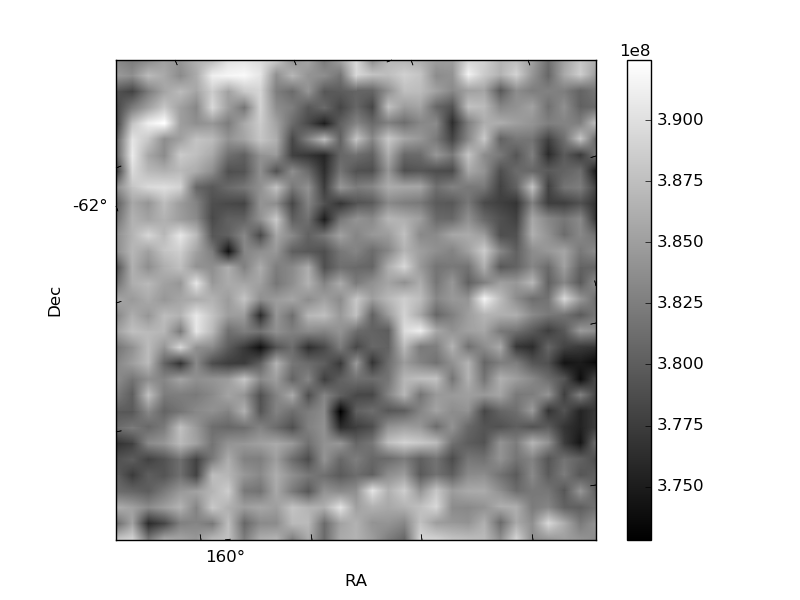
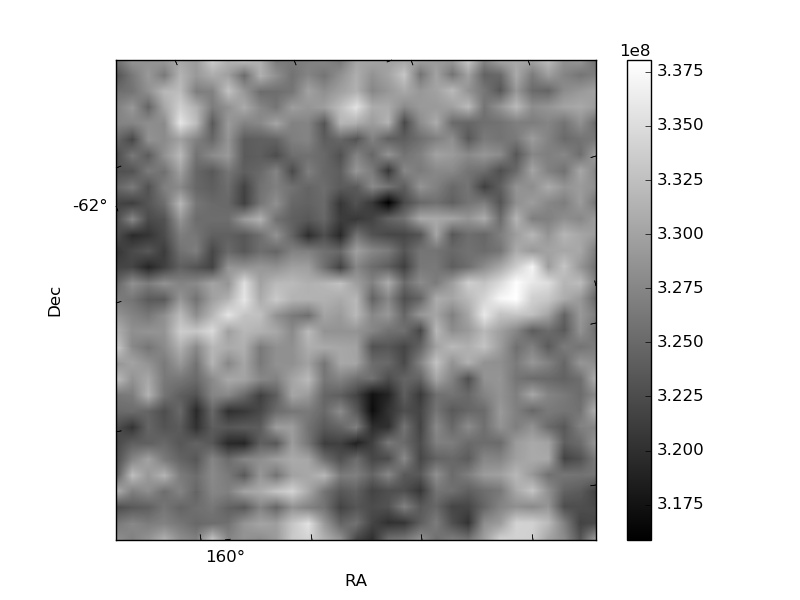
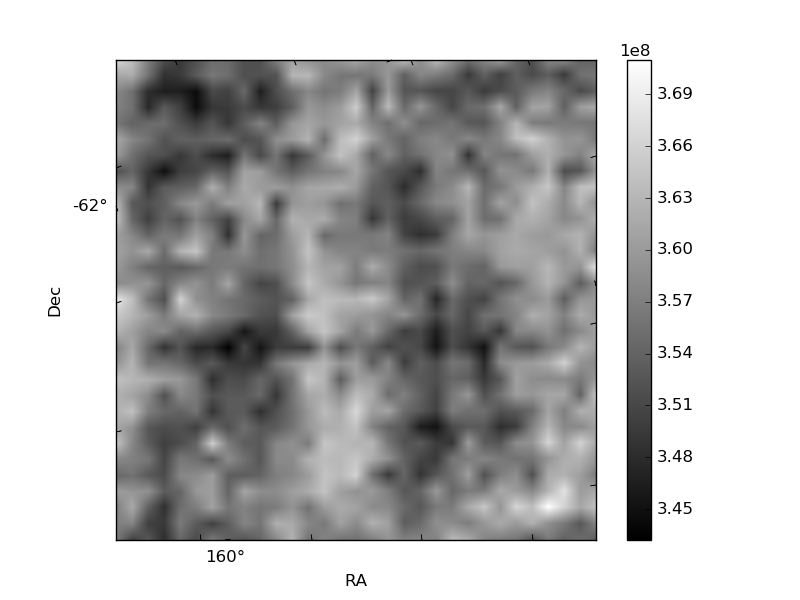
Histogram calculated using DETX and DETY for each event in the final _common_clean file
| Quadrant A | 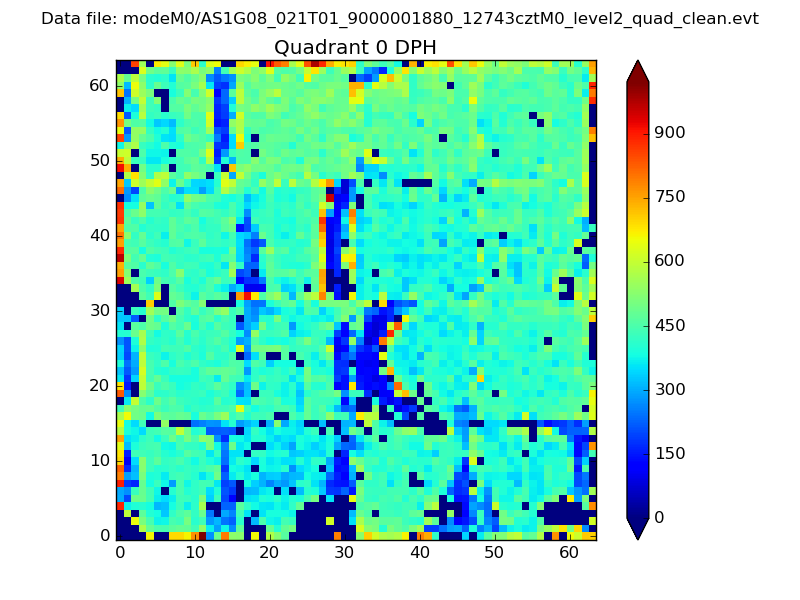 |
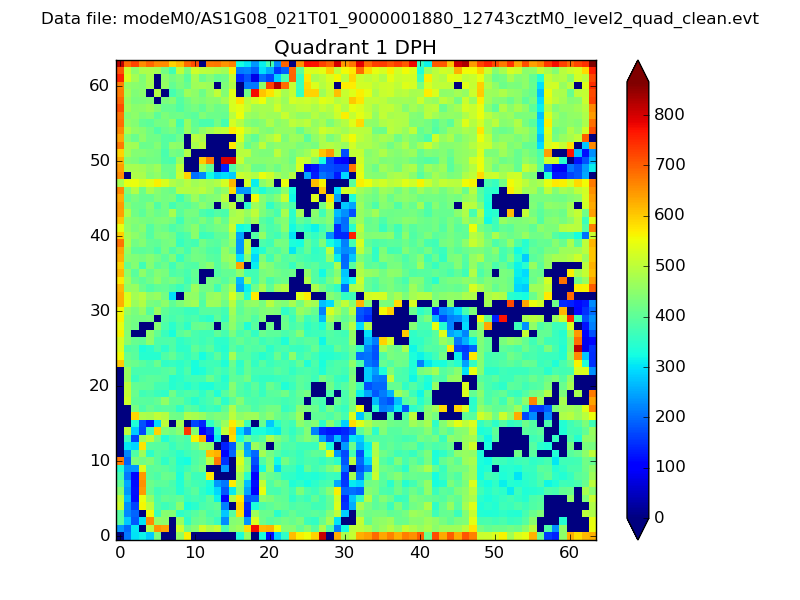 |
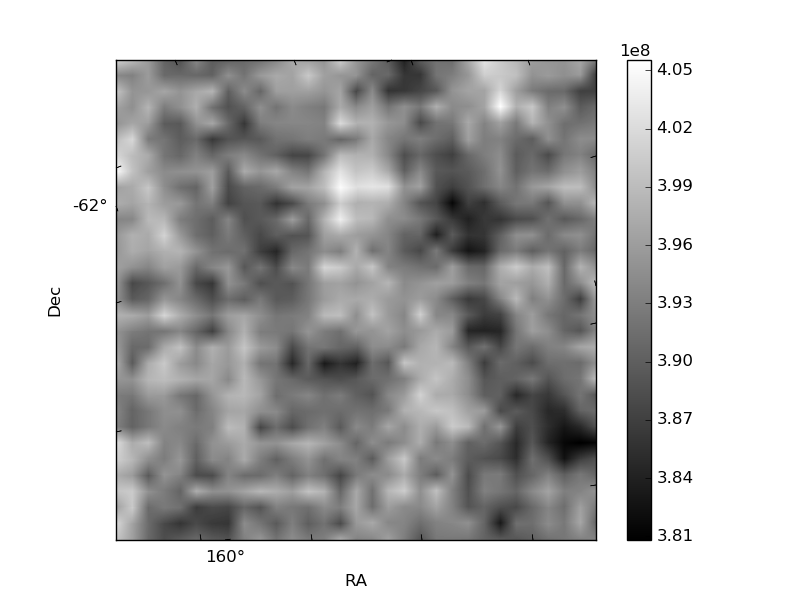
Quadrant B |
|---|---|---|---|
| Quadrant D | 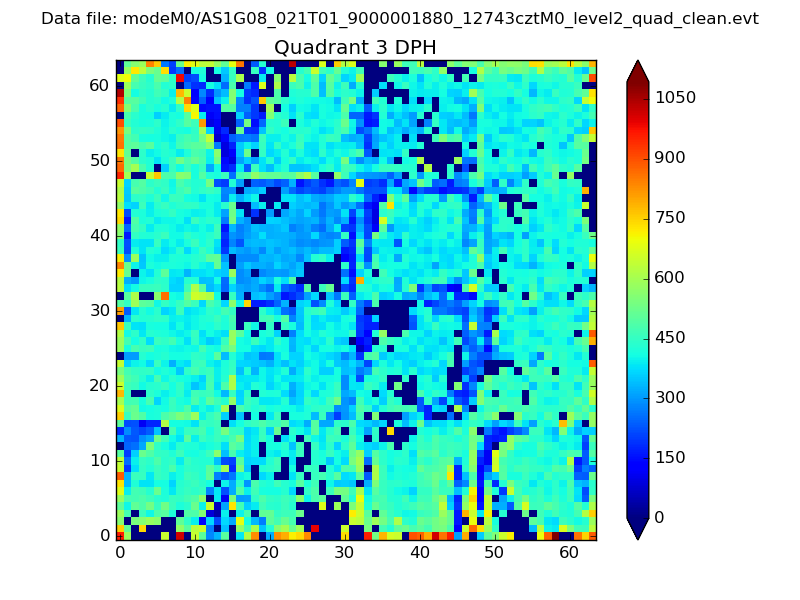 |
 |
Quadrant C |
| Plot type | Count rate plots | Images |
|---|---|---|
| Comparison with Poisson distribution Blue bars denote a histogram of data divided into 1 sec bins. Red curve is a Poisson curve with rate = median count rate of data. |
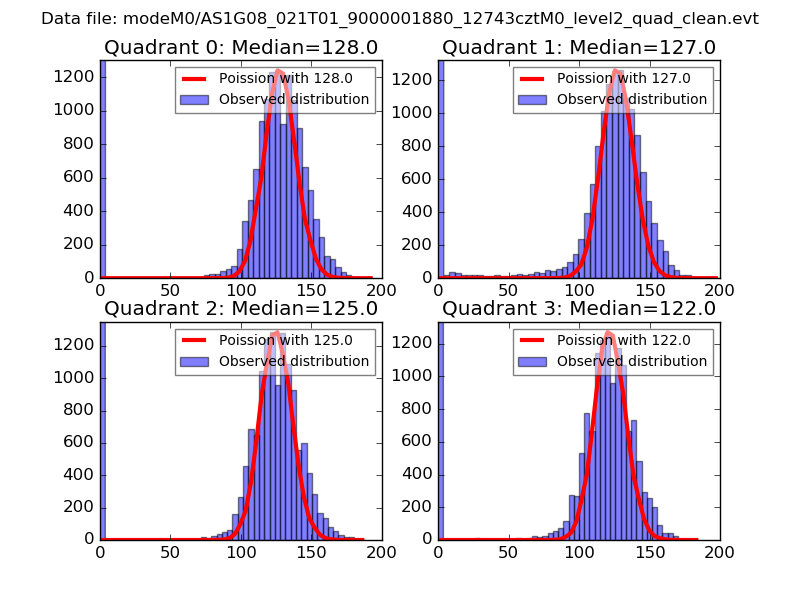 |
 |
| Quadrant-wise count rates Data is divided into 100 sec bins |
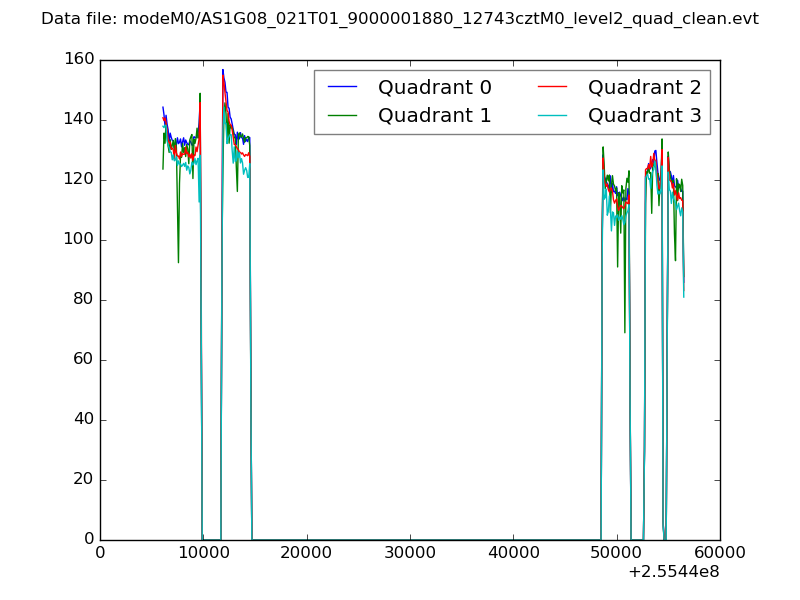 |
|
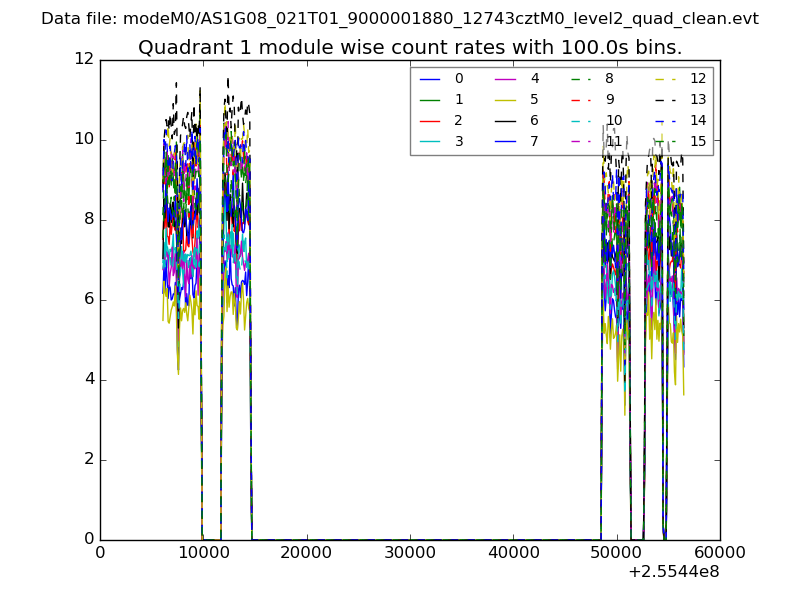
| Module-wise count rates for Quadrant A Data is divided into 100 sec bins |
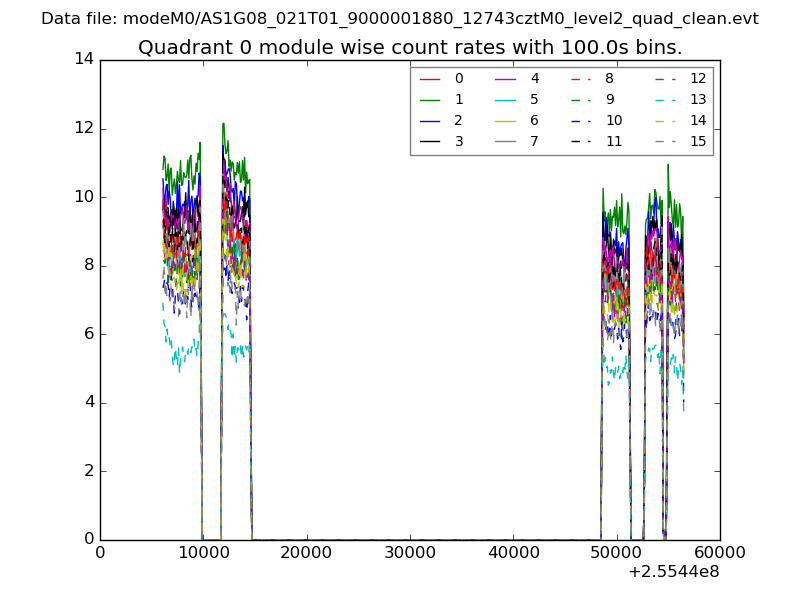 |
 |
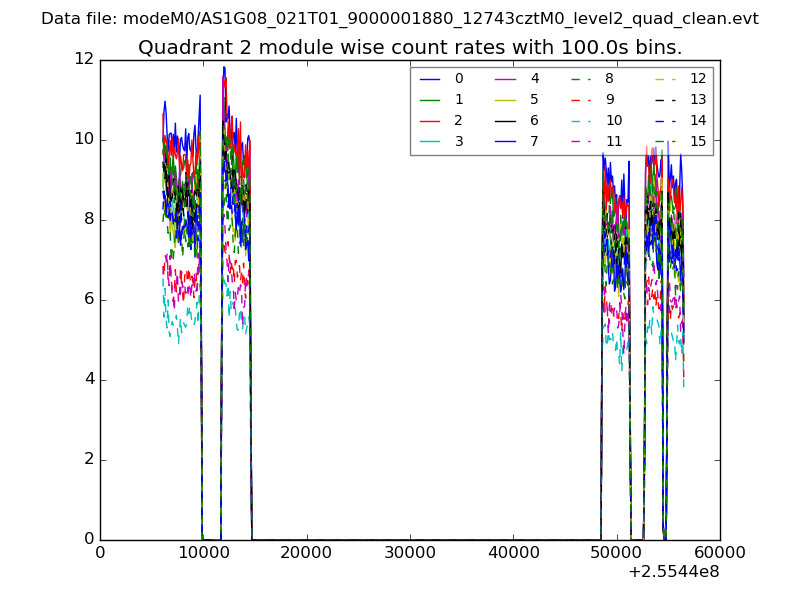
| Module-wise count rates for Quadrant B Data is divided into 100 sec bins |
 |
 |
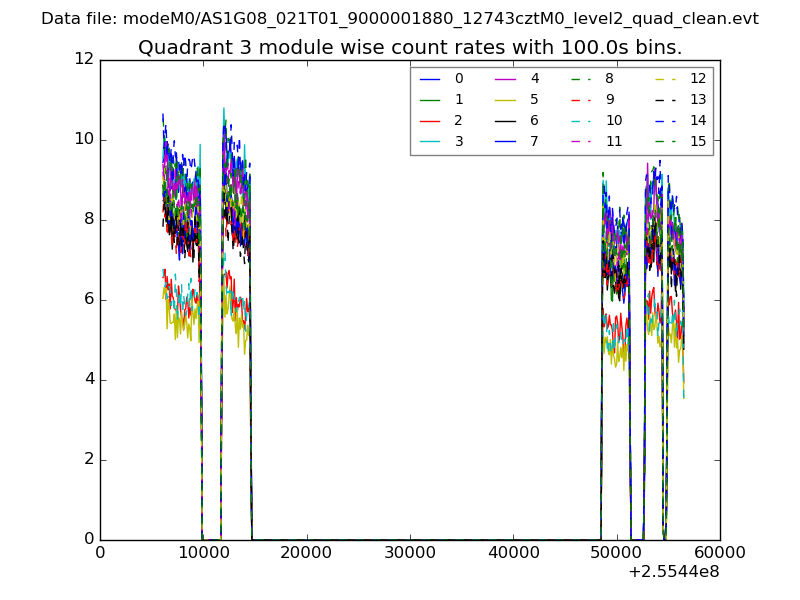
| Module-wise count rates for Quadrant C Data is divided into 100 sec bins |
 |
 |
| Module-wise count rates for Quadrant D Data is divided into 100 sec bins |
 |
 |
| Parameter | Plot |
|---|---|
| CZT HV Monitor | 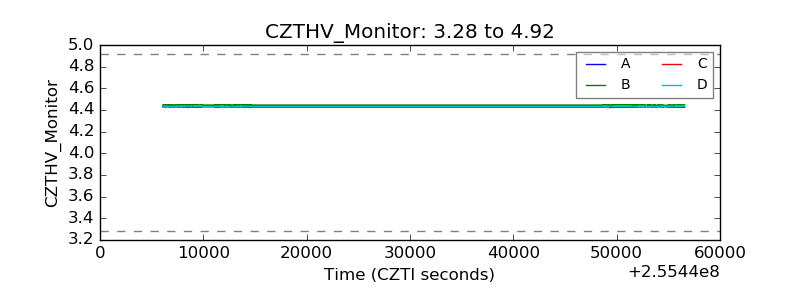 |
| D_VDD | 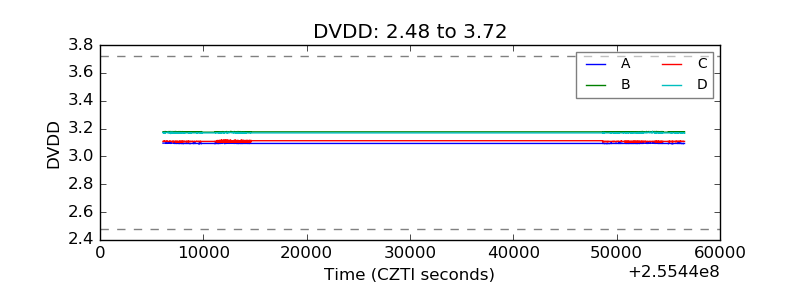 |
| Temperature 1 |  |
| Veto HV Monitor | 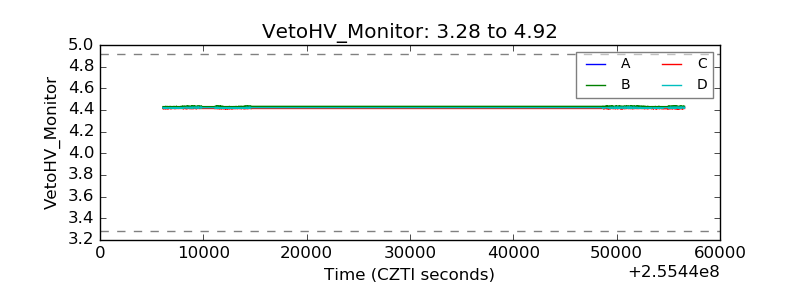 |
| Veto LLD | 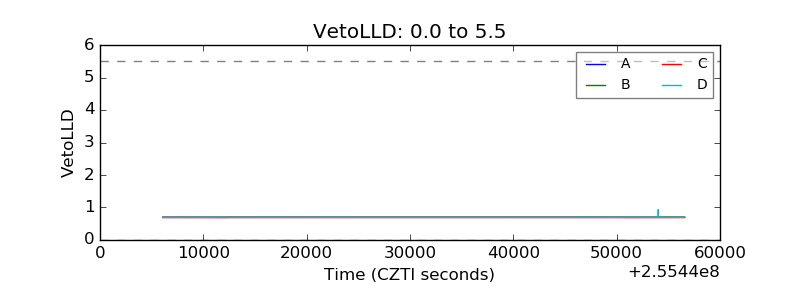 |
| Alpha Counter | 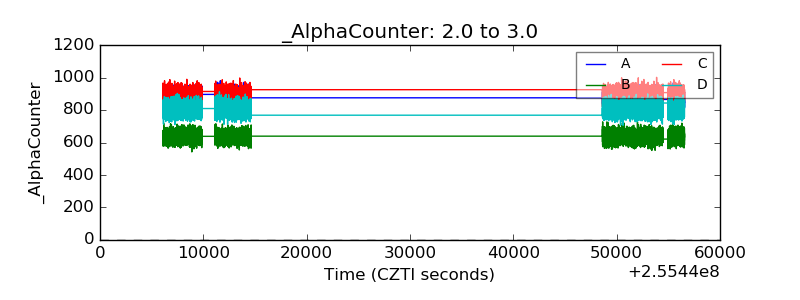 |
| _CPM_Rate | 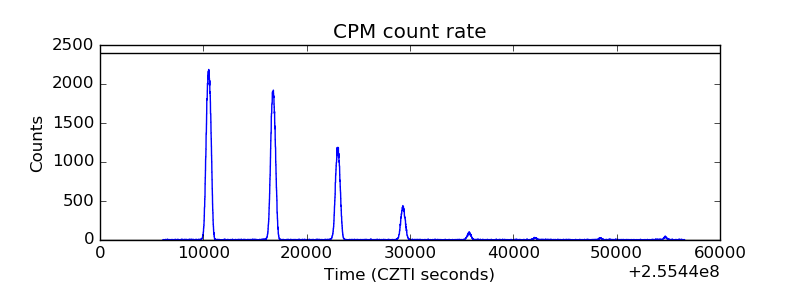 |
| CZT Counter | 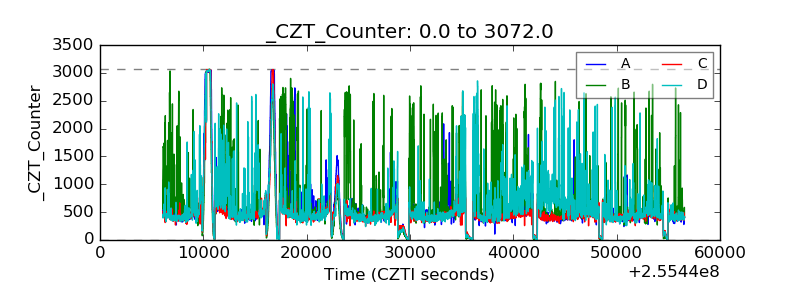 |
| +2.5 Volts monitor |  |
| +5 Volts monitor | 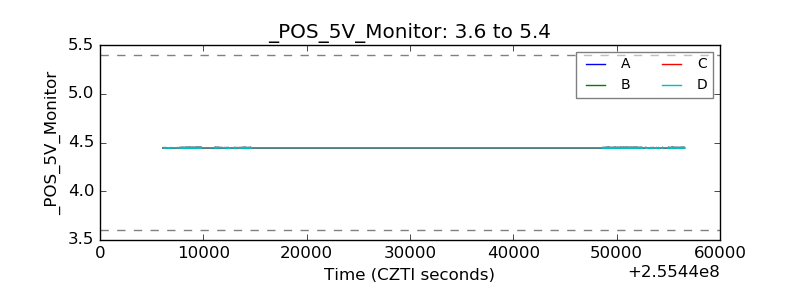 |
| _ROLL_ROT | 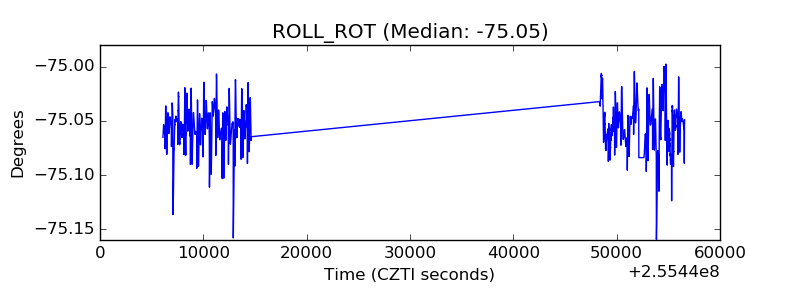 |
| _Roll_DEC |  |
| _Roll_RA | 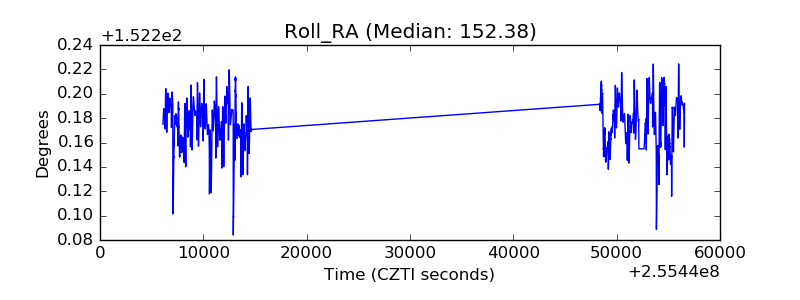 |
| Veto Counter | 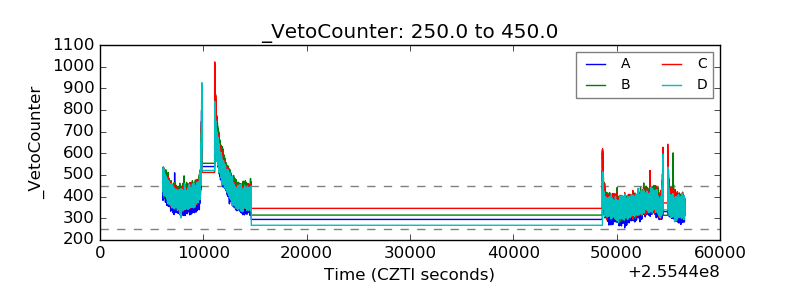 |