| Param | Original file | Final file |
|---|---|---|
| Filename | modeM0/AS1G08_021T01_9000001880_12745cztM0_level2.evt | modeM0/AS1G08_021T01_9000001880_12745cztM0_level2_quad_clean.evt |
| Size (bytes) | 906,949,440 | 189,256,320 |
| Size | 864.9 MB | 180.5 MB |
| Events in quadrant A | 6,197,427 | 1,224,281 |
| Events in quadrant B | 7,942,651 | 1,218,497 |
| Events in quadrant C | 5,768,672 | 1,213,987 |
| Events in quadrant D | 6,670,744 | 1,169,550 |
| Mode M0 | |||
|---|---|---|---|
| Quadrant | BADHDUFLAG | Total packets | Discarded packets |
| A | 0 | 27263 | 4 |
| B | 0 | 32176 | 3 |
| C | 0 | 26543 | 3 |
| D | 0 | 29061 | 3 |
| Mode SS | |||
|---|---|---|---|
| Quadrant | BADHDUFLAG | Total packets | Discarded packets |
| A | 0 | 270 | 0 |
| B | 0 | 270 | 0 |
| C | 0 | 270 | 0 |
| D | 0 | 270 | 0 |
| Mode M9 | |||
|---|---|---|---|
| Quadrant | BADHDUFLAG | Total packets | Discarded packets |
| A | 0 | 17 | 0 |
| B | 0 | 17 | 0 |
| C | 0 | 17 | 0 |
| D | 0 | 17 | 0 |
| Quadrant | Total seconds | Saturated seconds | Saturation percentage |
|---|---|---|---|
| A | 13100 | 165 | 1.259542% |
| B | 13100 | 738 | 5.633588% |
| C | 13100 | 124 | 0.946565% |
| D | 13100 | 200 | 1.526718% |
Noise dominated data is calculated using 1-second bins in cleaned event files. If a bin has >2000 counts, and if more than 50% of those come from <1% of pixels, then it is considered to be noise-dominated and hence unusable.
| Quadrant | # 1 sec bins | Bins with >0 counts | Bins with >2000 counts | High rate bins dominated by noise | Noise dominated (total time) | Noise dominated (detector-on time) | Marked lightcurve |
|---|---|---|---|---|---|---|---|
| A | 14841 | 13104 | 21 | 21 | 0.14% | 0.16% | 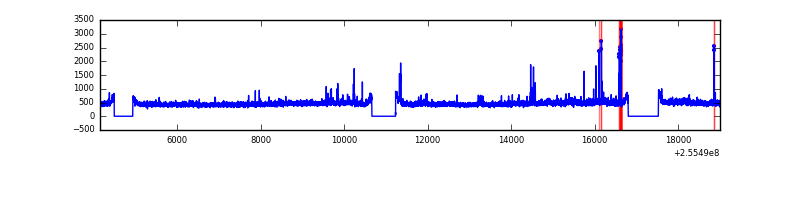 |
| B | 14841 | 13104 | 402 | 402 | 2.71% | 3.07% | 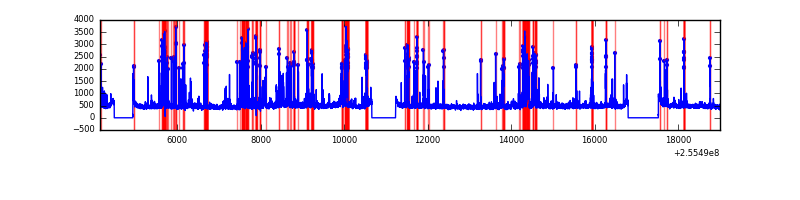 |
| C | 14841 | 13104 | 0 | 0 | 0.00% | 0.00% | 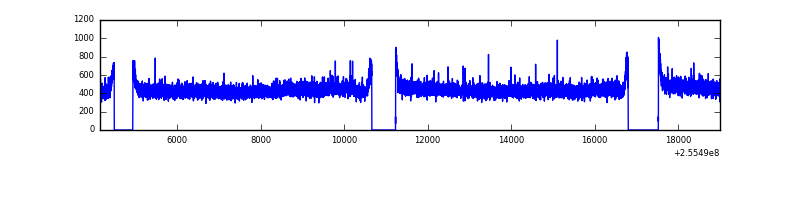 |
| D | 14841 | 13104 | 79 | 79 | 0.53% | 0.60% | 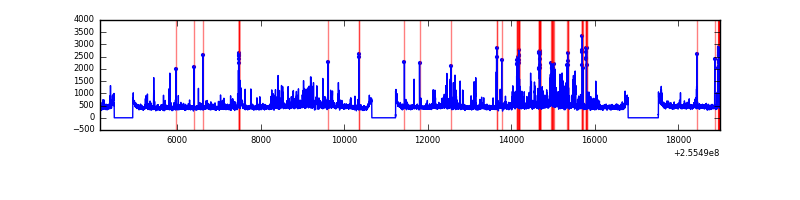 |
Top three noisy pixels from each quadrant. If the there are fewer than three noisy pixels in the level2.evt file, extra rows are filled as -1
| Pixel properties | Quadrant properties | ||||||
|---|---|---|---|---|---|---|---|
| Quadrant | DetID | PixID | Counts | Sigma | Mean | Median | Sigma |
| A | 8 | 15 | 118292 | 384.03 | 1507 | 1474 | 304.2 |
| A | 15 | 222 | 91918 | 297.33 | 1507 | 1474 | 304.2 |
| A | 12 | 189 | 81709 | 263.77 | 1507 | 1474 | 304.2 |
| B | 4 | 239 | 1882815 | 6673.51 | 1484 | 1443 | 281.9 |
| B | 0 | 214 | 89475 | 312.26 | 1484 | 1443 | 281.9 |
| B | 3 | 209 | 48565 | 167.15 | 1484 | 1443 | 281.9 |
| C | 8 | 128 | 12758 | 33.22 | 1473 | 1478 | 339.6 |
| C | 13 | 61 | 10513 | 26.61 | 1473 | 1478 | 339.6 |
| C | 8 | 112 | 6932 | 16.06 | 1473 | 1478 | 339.6 |
| D | 1 | 52 | 806201 | 2120.02 | 1444 | 1414 | 379.6 |
| D | 2 | 136 | 144465 | 376.83 | 1444 | 1414 | 379.6 |
| D | 10 | 199 | 111002 | 288.68 | 1444 | 1414 | 379.6 |
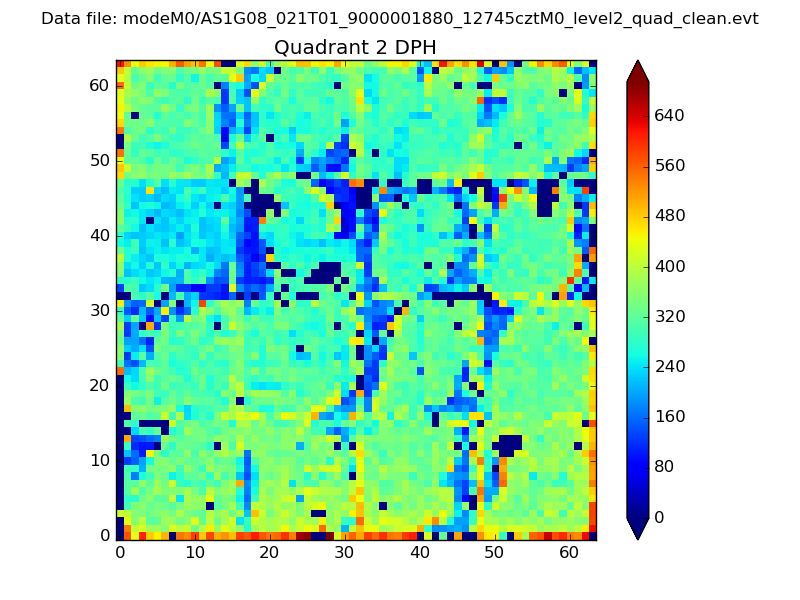
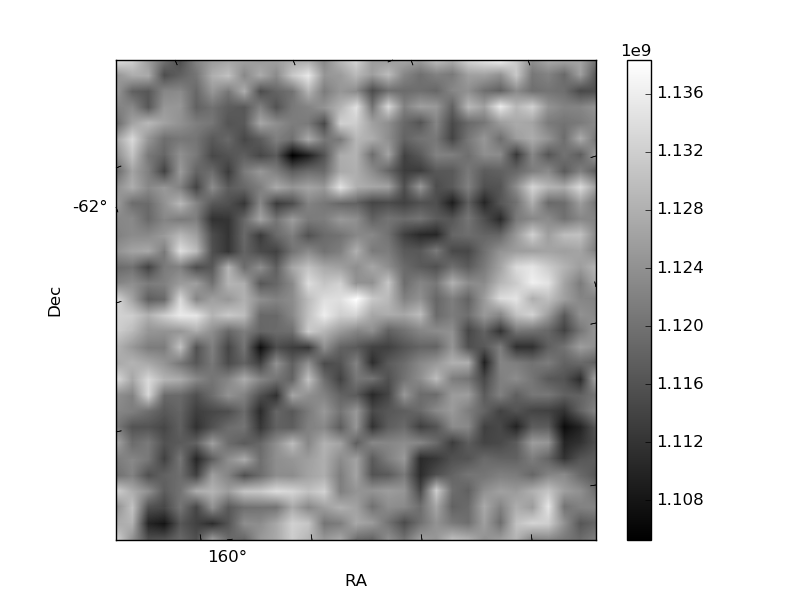
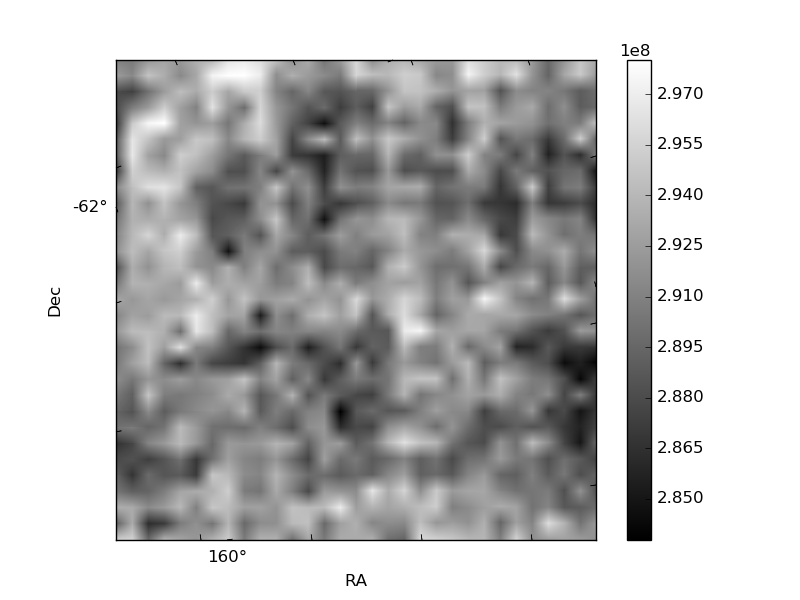
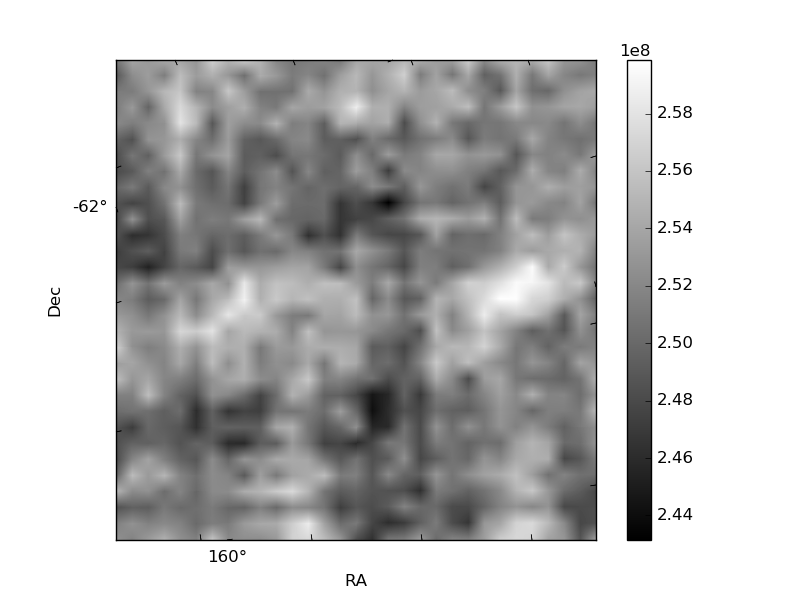
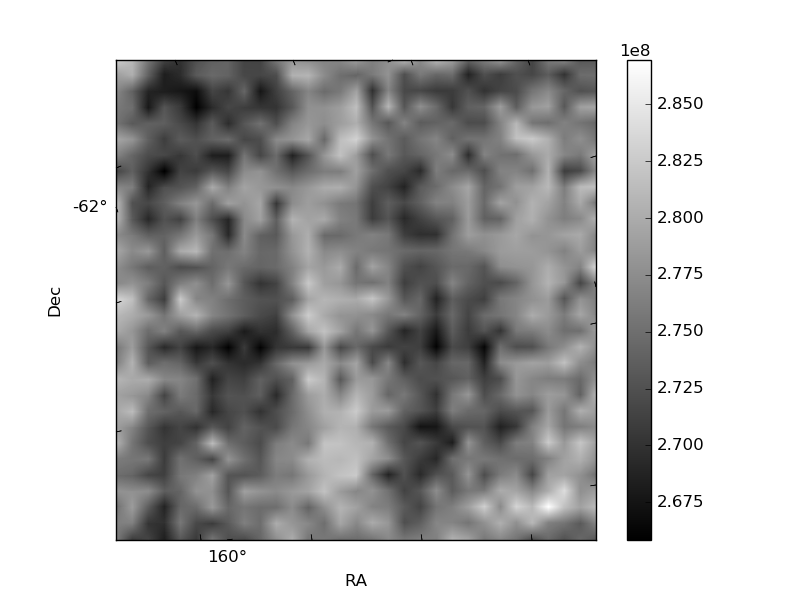
Histogram calculated using DETX and DETY for each event in the final _common_clean file
| Quadrant A | 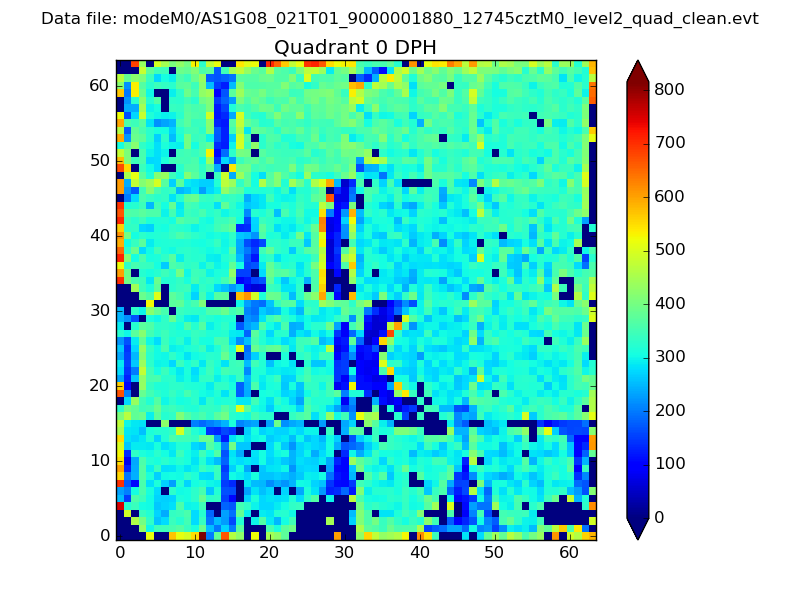 |
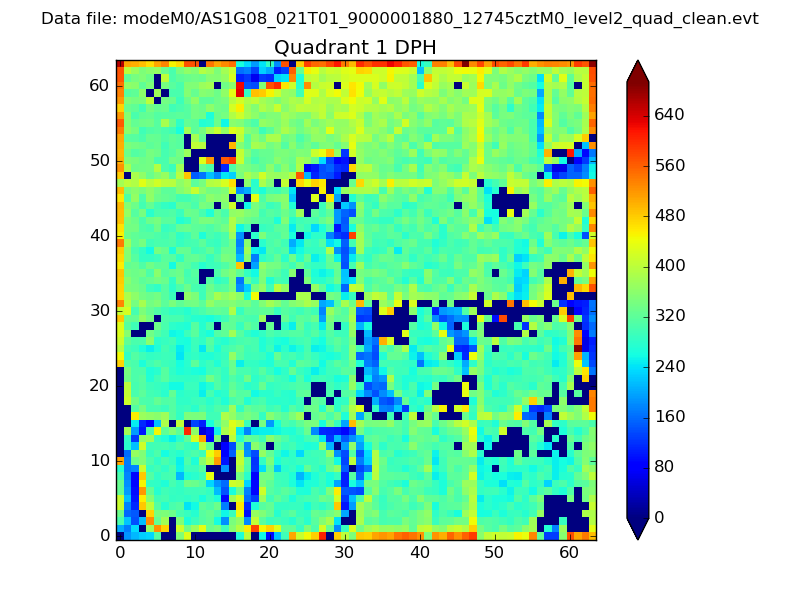 |
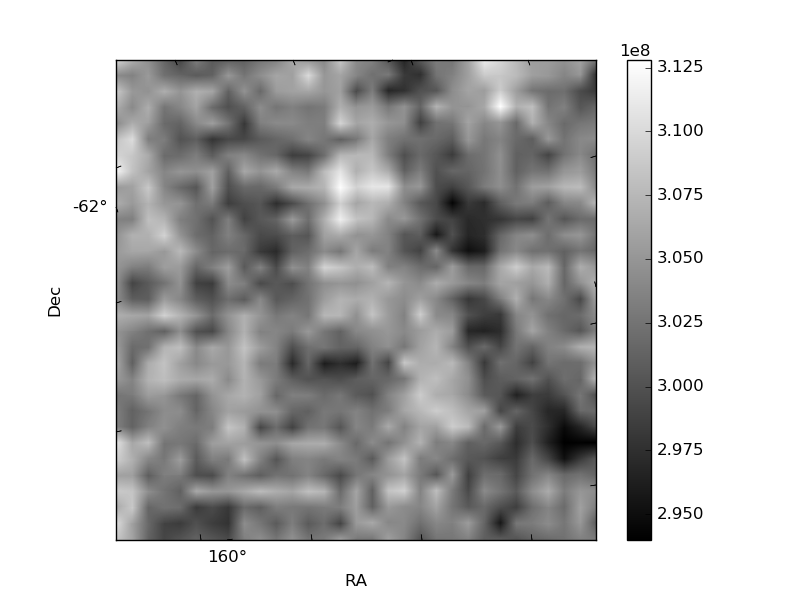
Quadrant B |
|---|---|---|---|
| Quadrant D | 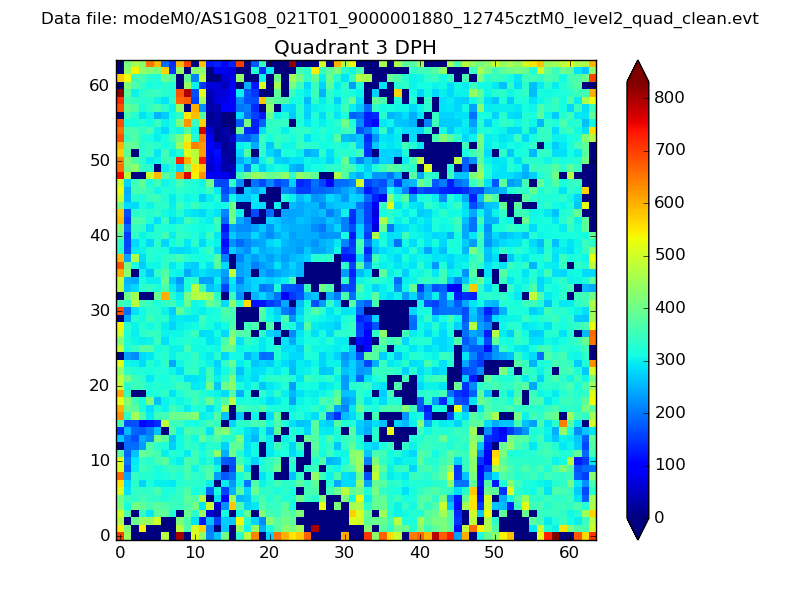 |
 |
Quadrant C |
| Plot type | Count rate plots | Images |
|---|---|---|
| Comparison with Poisson distribution Blue bars denote a histogram of data divided into 1 sec bins. Red curve is a Poisson curve with rate = median count rate of data. |
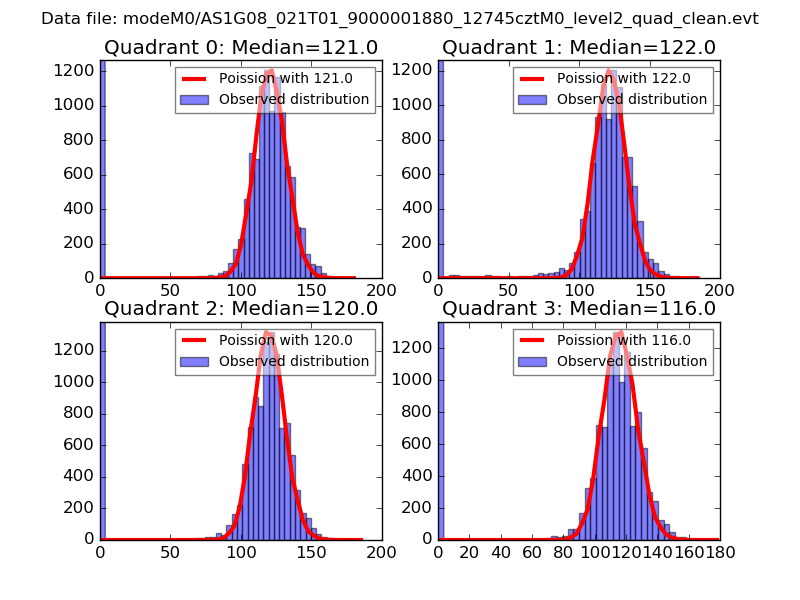 |
 |
| Quadrant-wise count rates Data is divided into 100 sec bins |
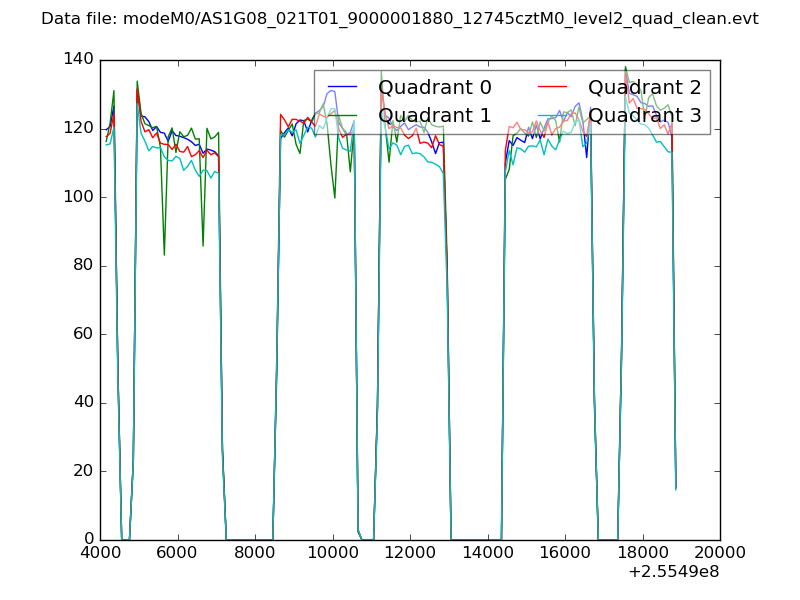 |
|
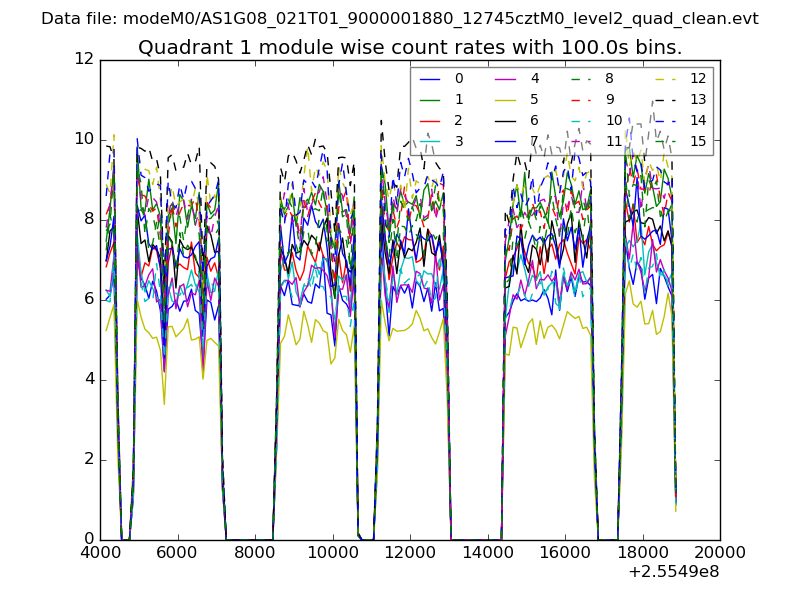
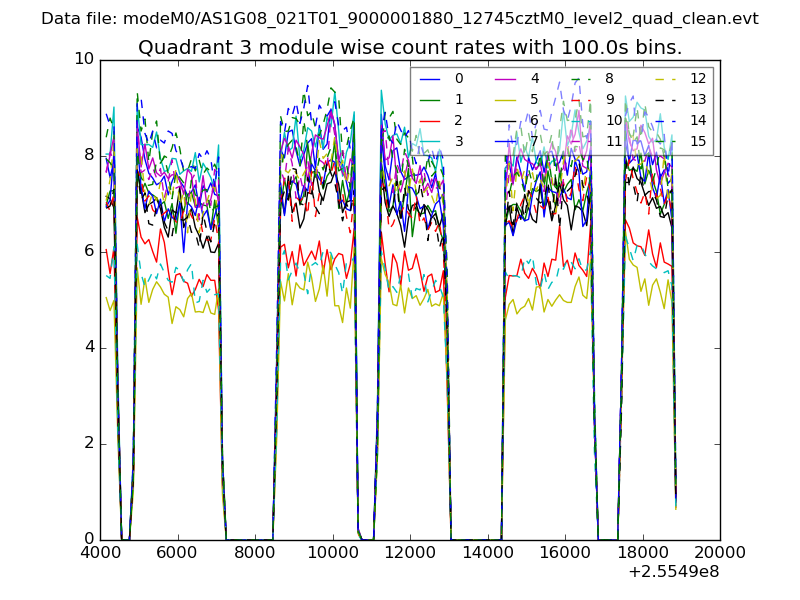
| Module-wise count rates for Quadrant A Data is divided into 100 sec bins |
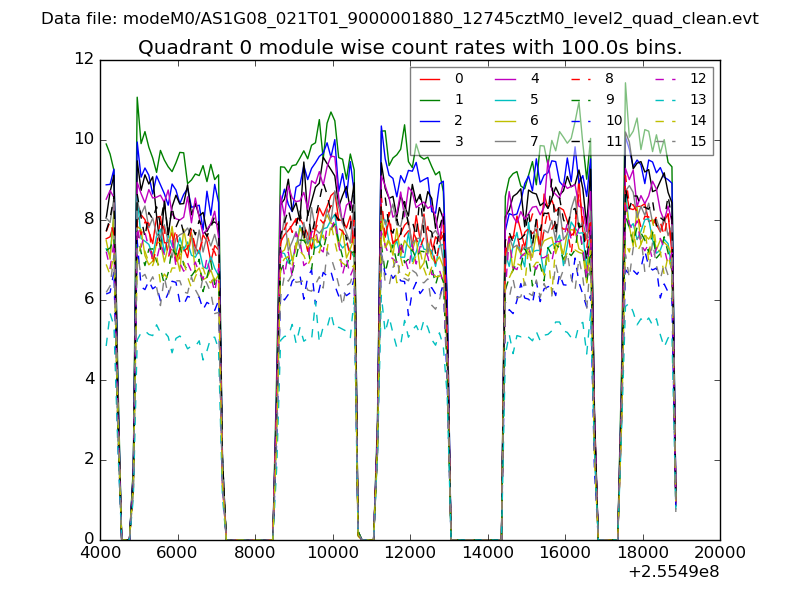 |
 |
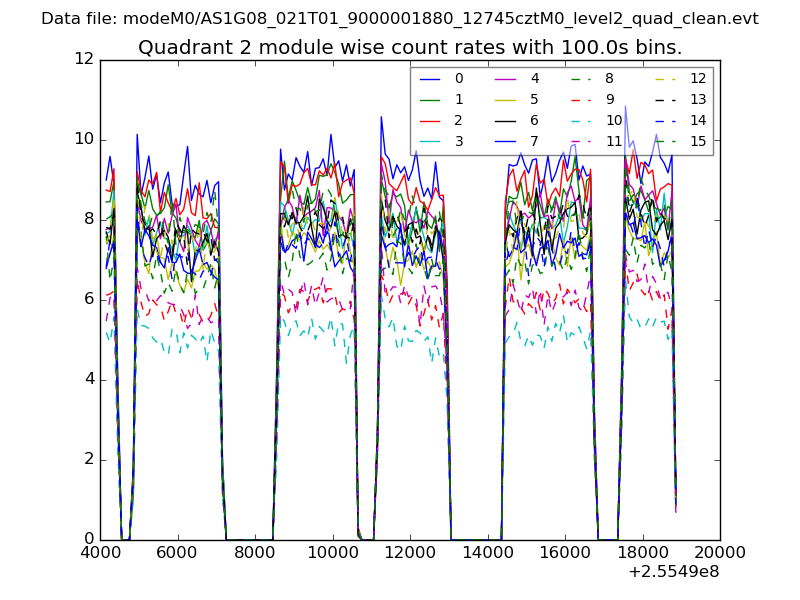
| Module-wise count rates for Quadrant B Data is divided into 100 sec bins |
 |
 |
| Module-wise count rates for Quadrant C Data is divided into 100 sec bins |
 |
 |
| Module-wise count rates for Quadrant D Data is divided into 100 sec bins |
 |
 |
| Parameter | Plot |
|---|---|
| CZT HV Monitor | 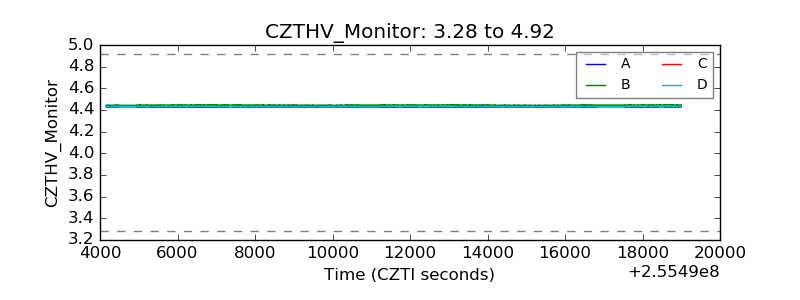 |
| D_VDD | 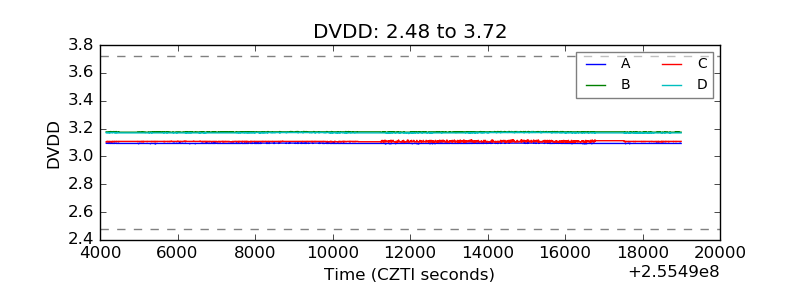 |
| Temperature 1 | 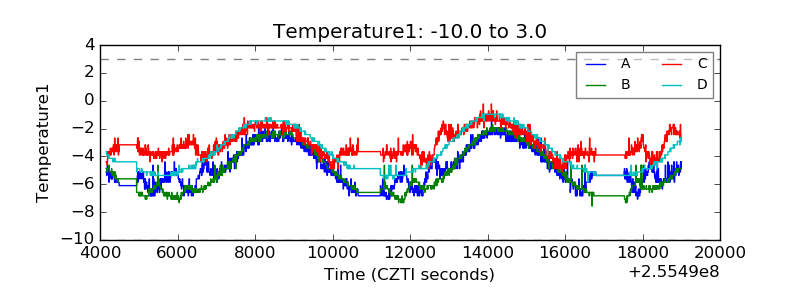 |
| Veto HV Monitor | 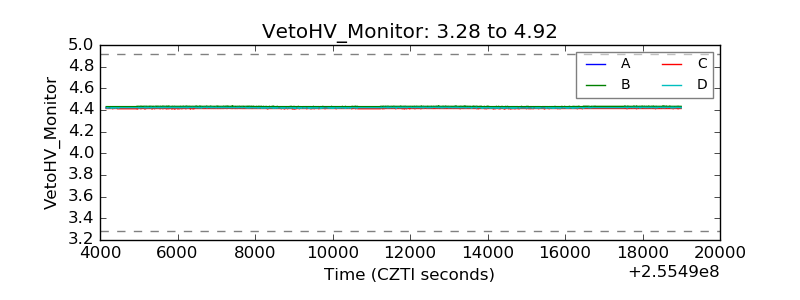 |
| Veto LLD |  |
| Alpha Counter | 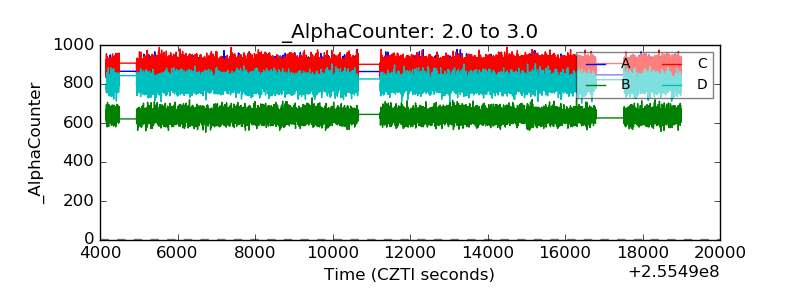 |
| _CPM_Rate | 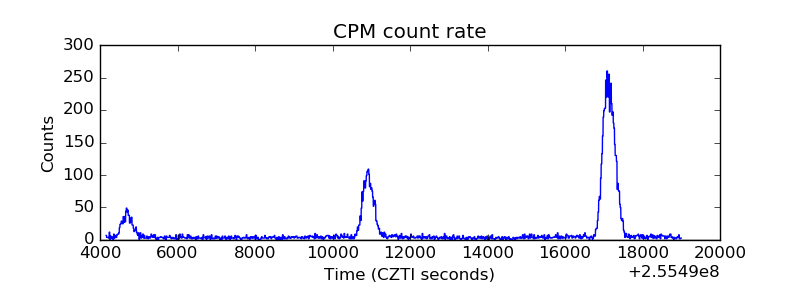 |
| CZT Counter | 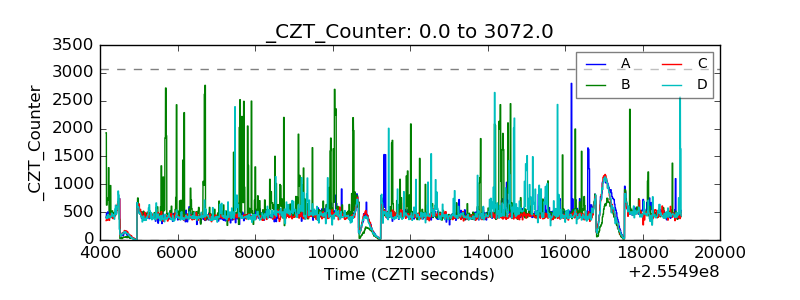 |
| +2.5 Volts monitor | 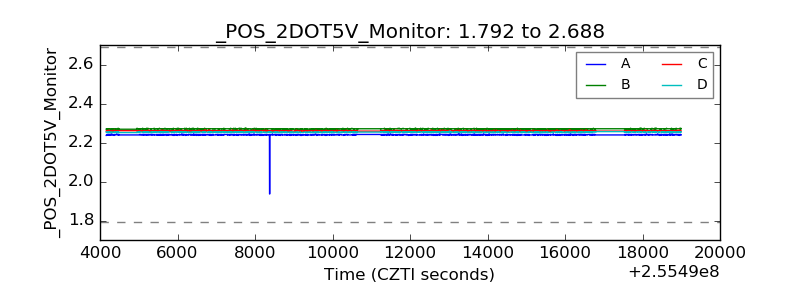 |
| +5 Volts monitor | 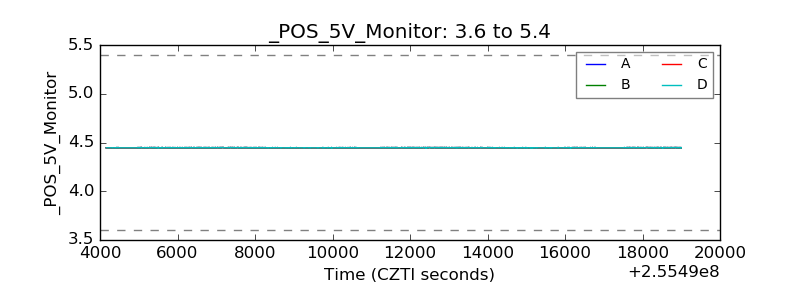 |
| _ROLL_ROT | 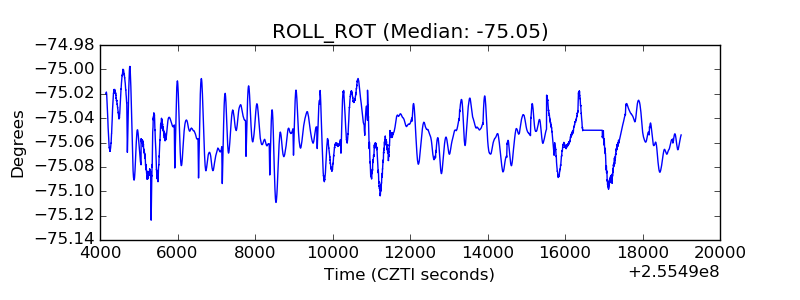 |
| _Roll_DEC | 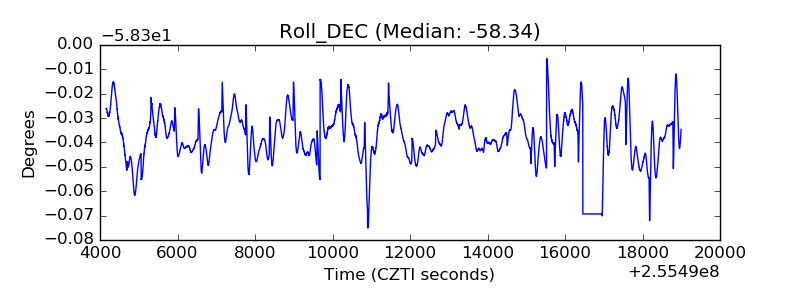 |
| _Roll_RA | 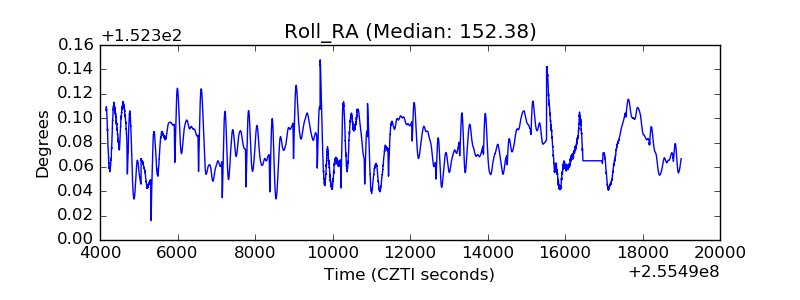 |
| Veto Counter | 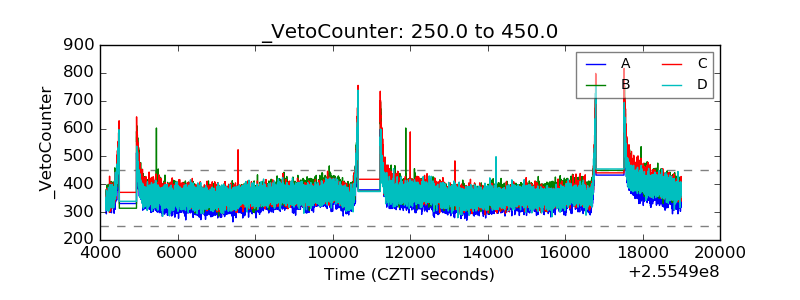 |