| Param | Original file | Final file |
|---|---|---|
| Filename | modeM0/AS1G08_021T01_9000001880_12746cztM0_level2.evt | modeM0/AS1G08_021T01_9000001880_12746cztM0_level2_quad_clean.evt |
| Size (bytes) | 276,552,000 | 41,898,240 |
| Size | 263.7 MB | 40.0 MB |
| Events in quadrant A | 1,711,389 | 256,721 |
| Events in quadrant B | 2,064,978 | 258,902 |
| Events in quadrant C | 1,534,763 | 258,820 |
| Events in quadrant D | 2,819,867 | 240,712 |
| Mode M0 | |||
|---|---|---|---|
| Quadrant | BADHDUFLAG | Total packets | Discarded packets |
| A | 0 | 7380 | 0 |
| B | 0 | 8490 | 0 |
| C | 0 | 7150 | 0 |
| D | 0 | 10770 | 0 |
| Mode SS | |||
|---|---|---|---|
| Quadrant | BADHDUFLAG | Total packets | Discarded packets |
| A | 0 | 72 | 0 |
| B | 0 | 72 | 0 |
| C | 0 | 72 | 0 |
| D | 0 | 72 | 0 |
| Quadrant | Total seconds | Saturated seconds | Saturation percentage |
|---|---|---|---|
| A | 3572 | 7 | 0.195969% |
| B | 3572 | 147 | 4.115342% |
| C | 3572 | 2 | 0.055991% |
| D | 3572 | 292 | 8.174692% |
Noise dominated data is calculated using 1-second bins in cleaned event files. If a bin has >2000 counts, and if more than 50% of those come from <1% of pixels, then it is considered to be noise-dominated and hence unusable.
| Quadrant | # 1 sec bins | Bins with >0 counts | Bins with >2000 counts | High rate bins dominated by noise | Noise dominated (total time) | Noise dominated (detector-on time) | Marked lightcurve |
|---|---|---|---|---|---|---|---|
| A | 3573 | 3573 | 3 | 3 | 0.08% | 0.08% | 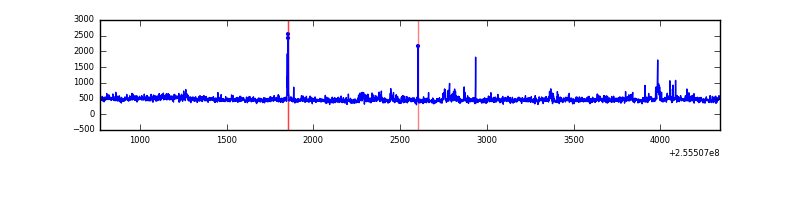 |
| B | 3573 | 3573 | 114 | 114 | 3.19% | 3.19% | 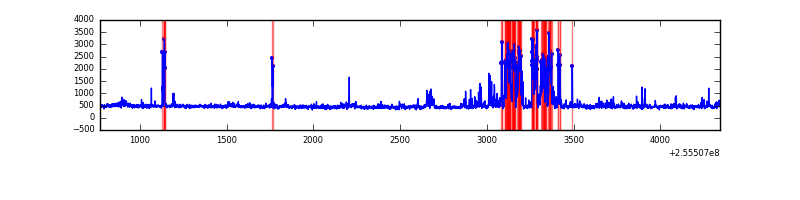 |
| C | 3573 | 3573 | 0 | 0 | 0.00% | 0.00% | 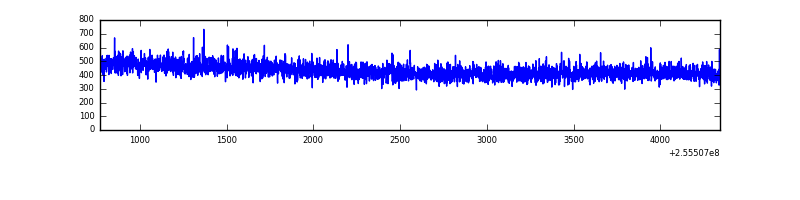 |
| D | 3573 | 3573 | 313 | 313 | 8.76% | 8.76% | 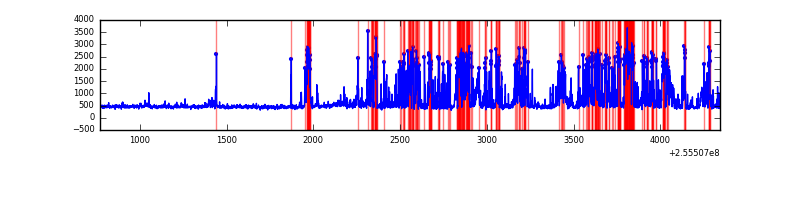 |
Top three noisy pixels from each quadrant. If the there are fewer than three noisy pixels in the level2.evt file, extra rows are filled as -1
| Pixel properties | Quadrant properties | ||||||
|---|---|---|---|---|---|---|---|
| Quadrant | DetID | PixID | Counts | Sigma | Mean | Median | Sigma |
| A | 12 | 189 | 51687 | 618.49 | 401 | 391 | 82.9 |
| A | 15 | 239 | 51238 | 613.07 | 401 | 391 | 82.9 |
| A | 8 | 15 | 41365 | 494.03 | 401 | 391 | 82.9 |
| B | 4 | 239 | 454325 | 6009.5 | 393 | 382 | 75.5 |
| B | 0 | 214 | 19538 | 253.6 | 393 | 382 | 75.5 |
| B | 0 | 197 | 14585 | 188.03 | 393 | 382 | 75.5 |
| C | 13 | 61 | 2759 | 25.56 | 393 | 393 | 92.6 |
| C | 1 | 5 | 985 | 6.4 | 393 | 393 | 92.6 |
| C | 3 | 202 | 928 | 5.78 | 393 | 393 | 92.6 |
| D | 1 | 52 | 1232936 | 12166.68 | 377 | 369 | 101.3 |
| D | 10 | 199 | 94944 | 933.55 | 377 | 369 | 101.3 |
| D | 2 | 136 | 21013 | 203.78 | 377 | 369 | 101.3 |
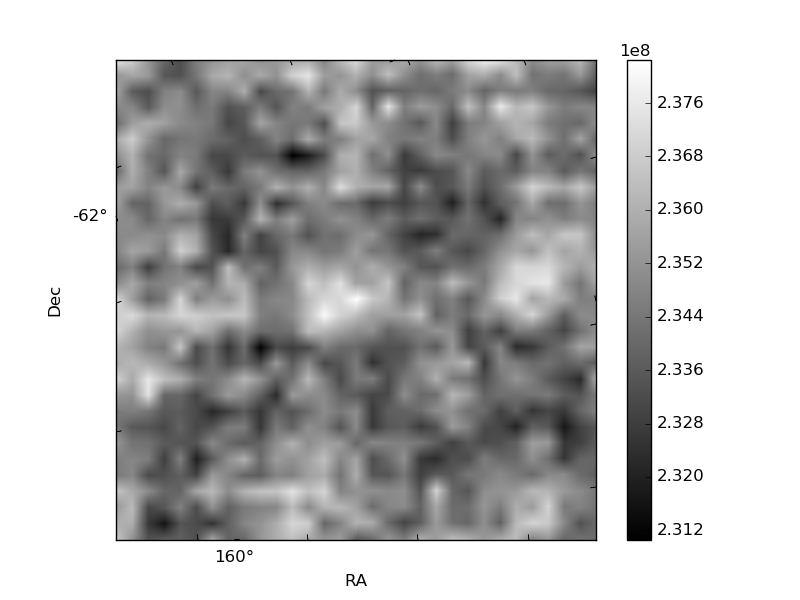
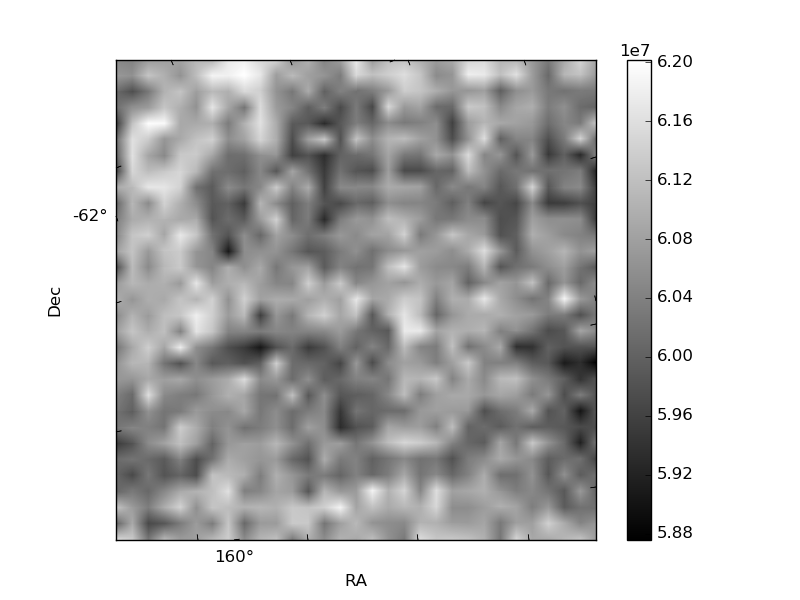
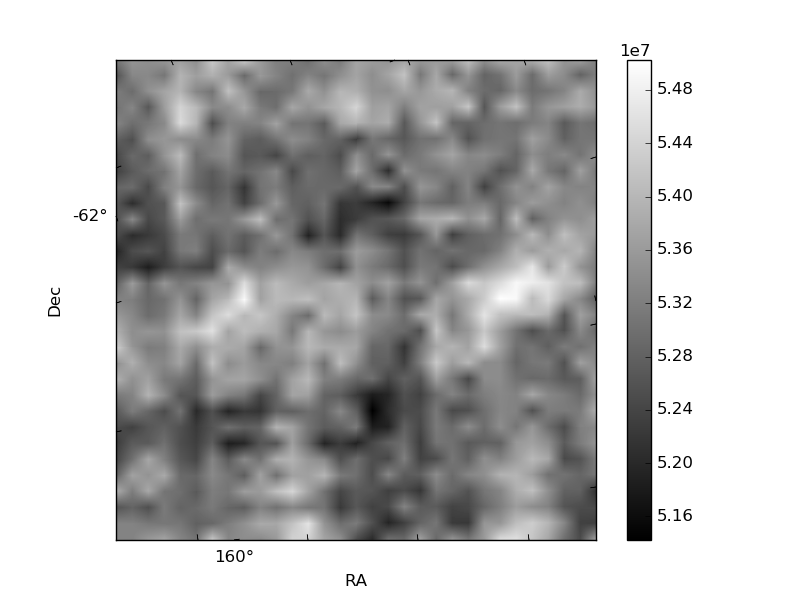
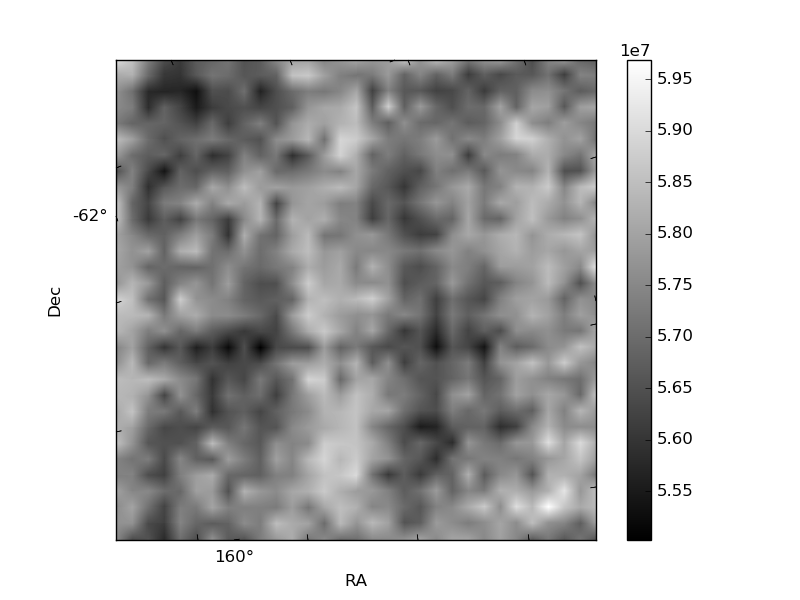
Histogram calculated using DETX and DETY for each event in the final _common_clean file
| Quadrant A | 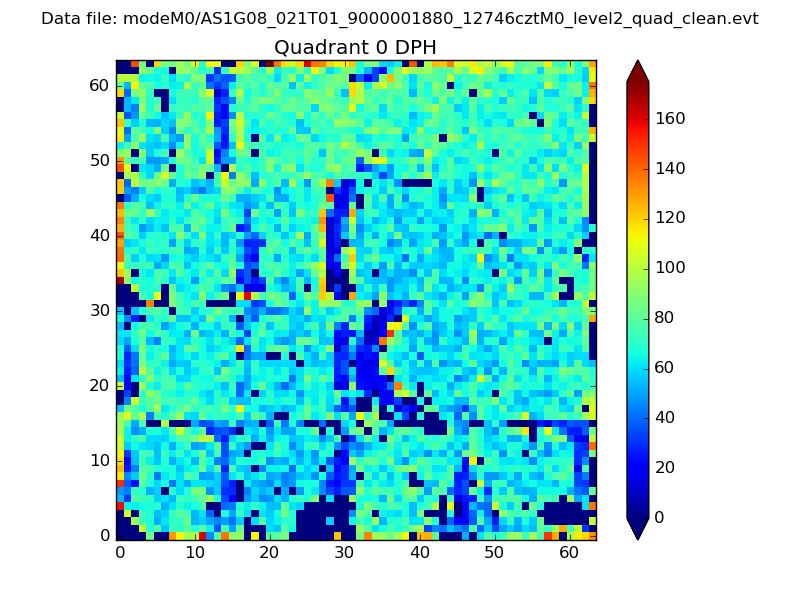 |
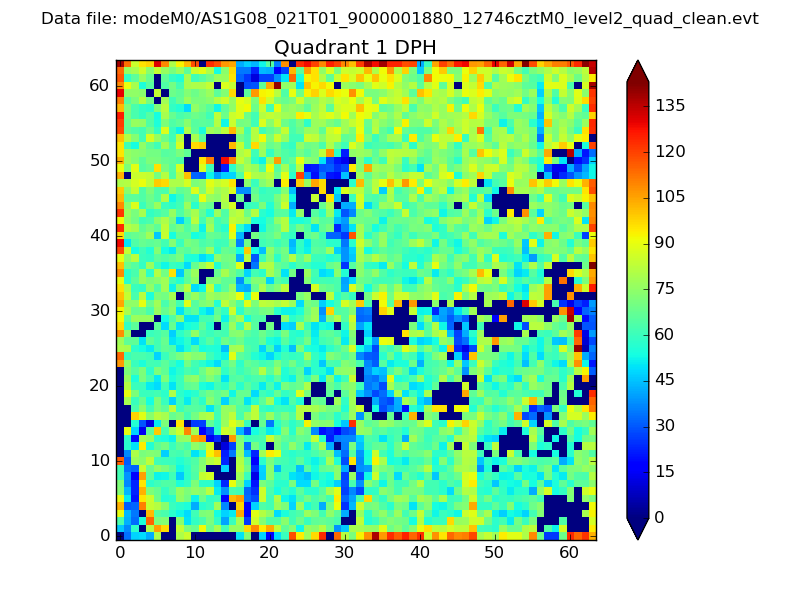 |
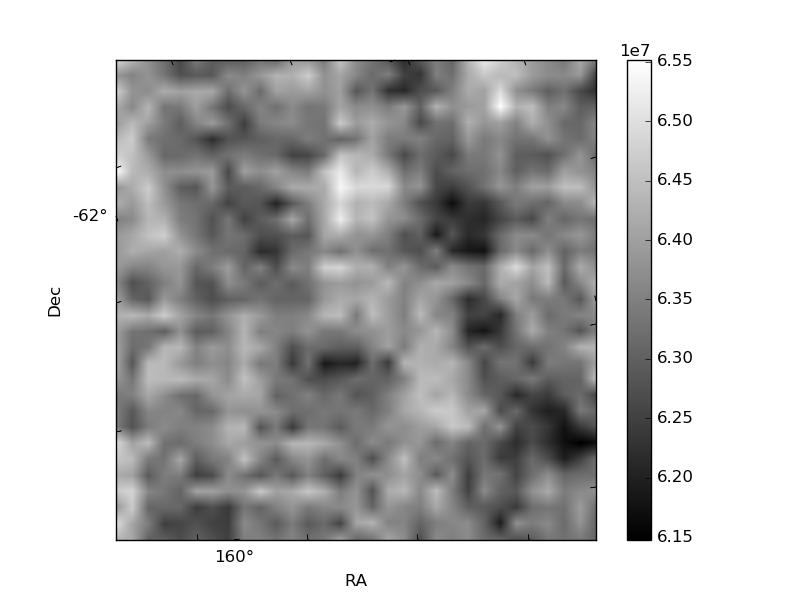
Quadrant B |
|---|---|---|---|
| Quadrant D | 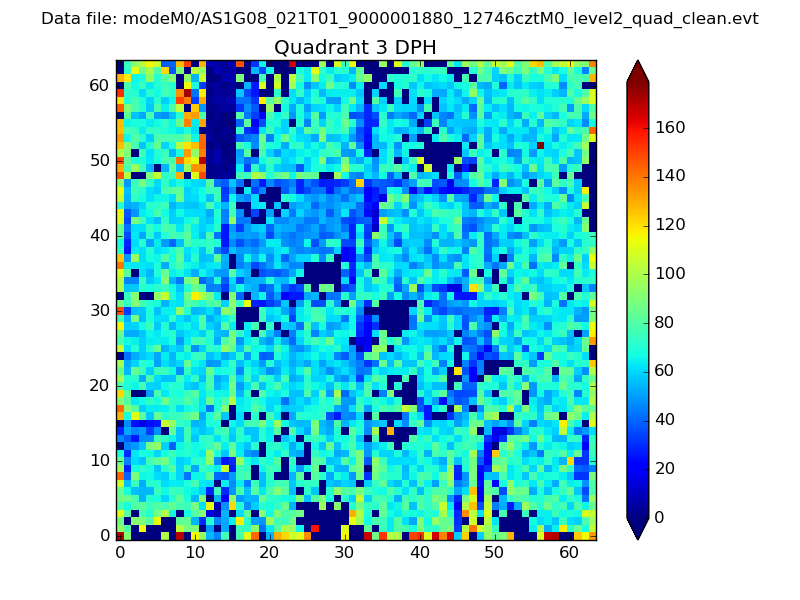 |
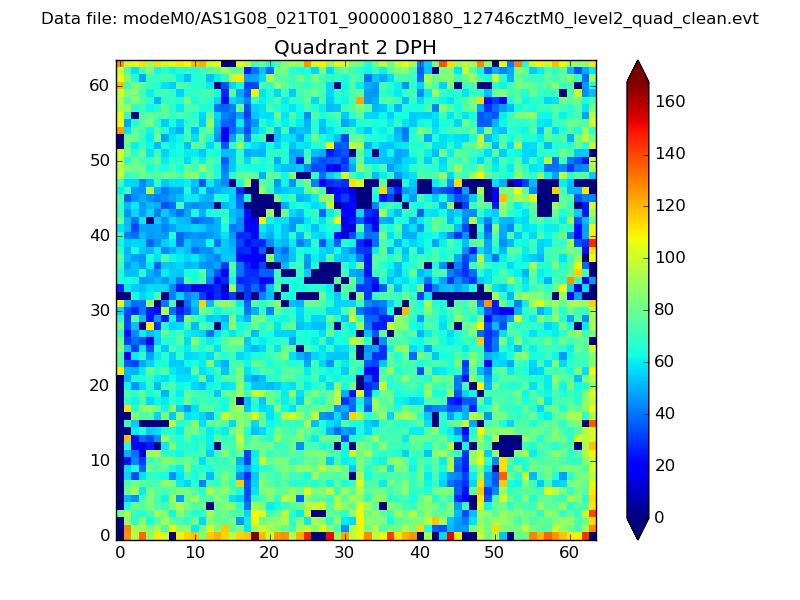 |
Quadrant C |
| Plot type | Count rate plots | Images |
|---|---|---|
| Comparison with Poisson distribution Blue bars denote a histogram of data divided into 1 sec bins. Red curve is a Poisson curve with rate = median count rate of data. |
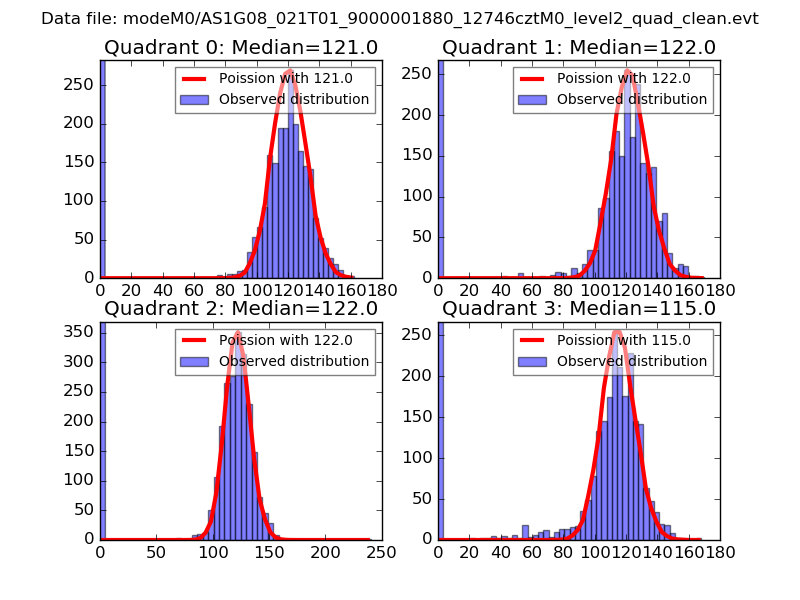 |
 |
| Quadrant-wise count rates Data is divided into 100 sec bins |
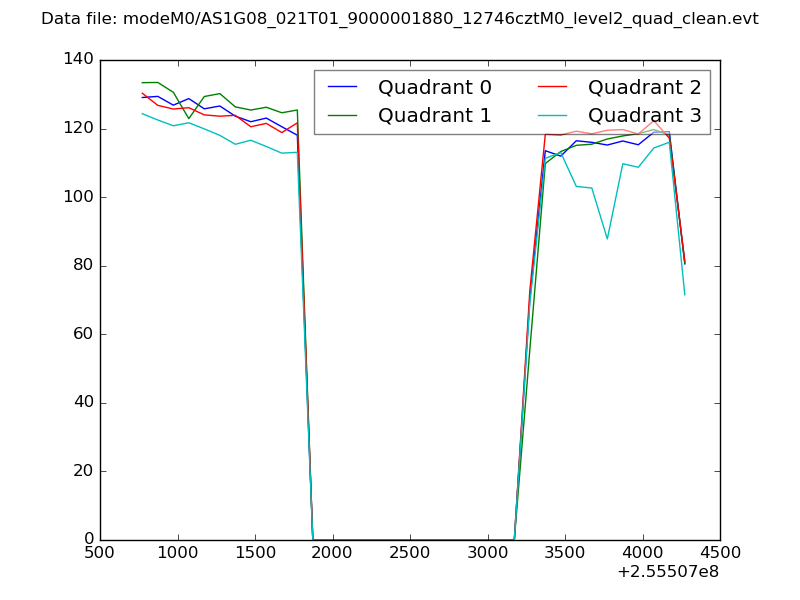 |
|
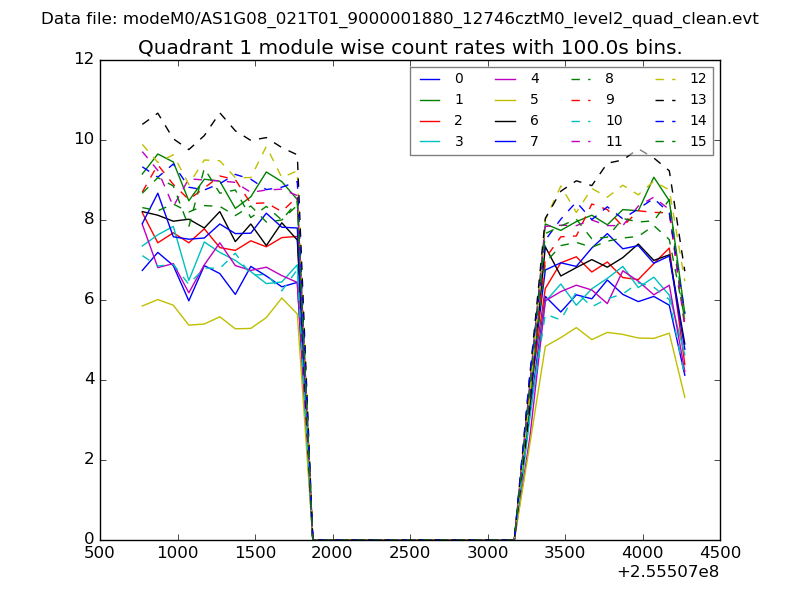
| Module-wise count rates for Quadrant A Data is divided into 100 sec bins |
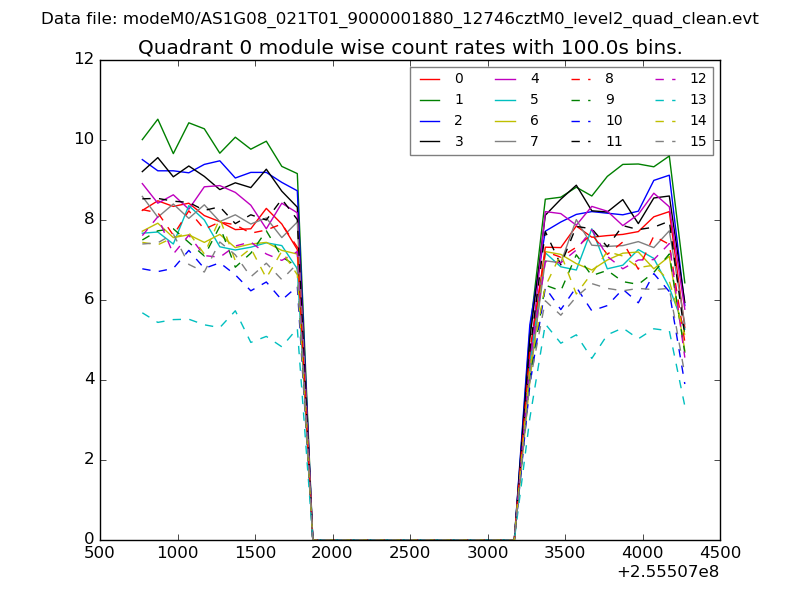 |
 |
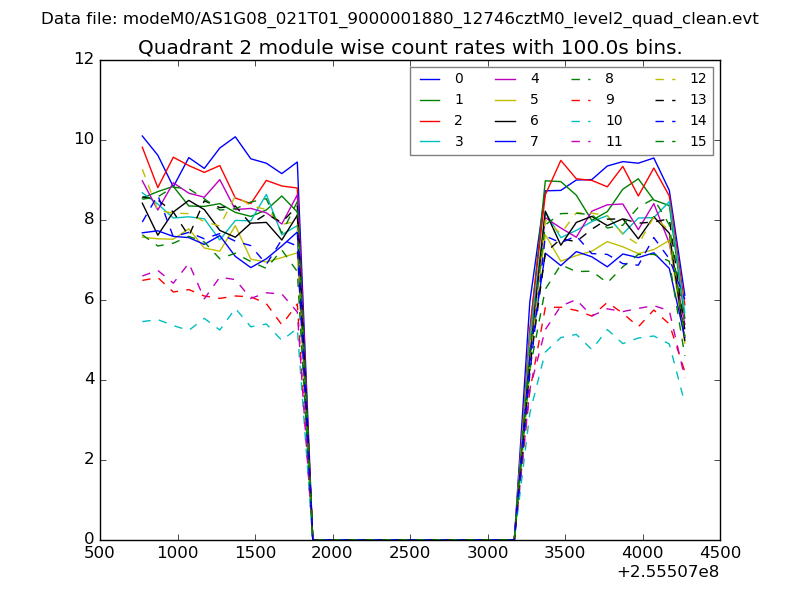
| Module-wise count rates for Quadrant B Data is divided into 100 sec bins |
 |
 |
| Module-wise count rates for Quadrant C Data is divided into 100 sec bins |
 |
 |
| Module-wise count rates for Quadrant D Data is divided into 100 sec bins |
 |
 |
| Parameter | Plot |
|---|---|
| CZT HV Monitor | 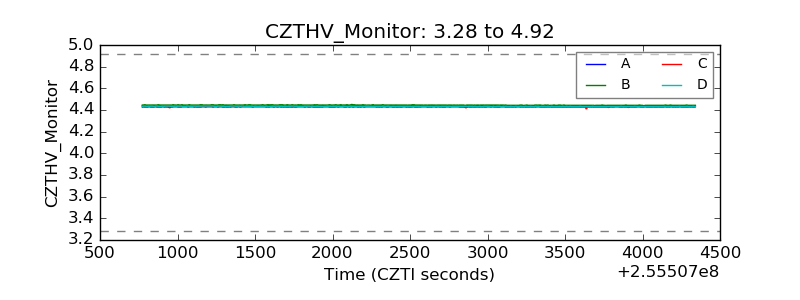 |
| D_VDD | 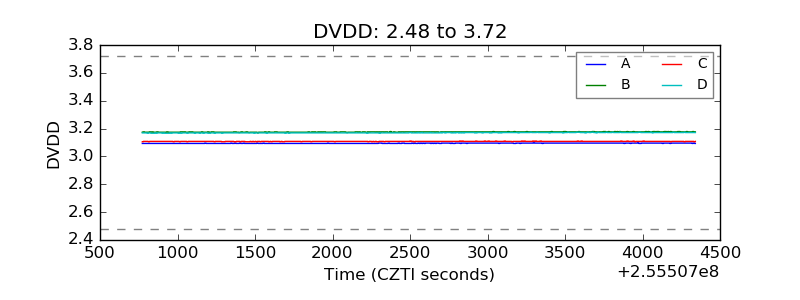 |
| Temperature 1 | 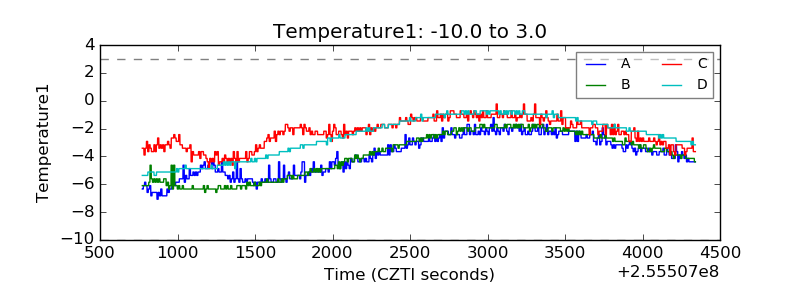 |
| Veto HV Monitor | 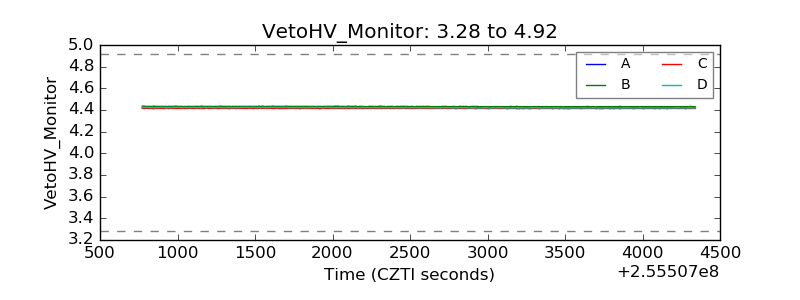 |
| Veto LLD | 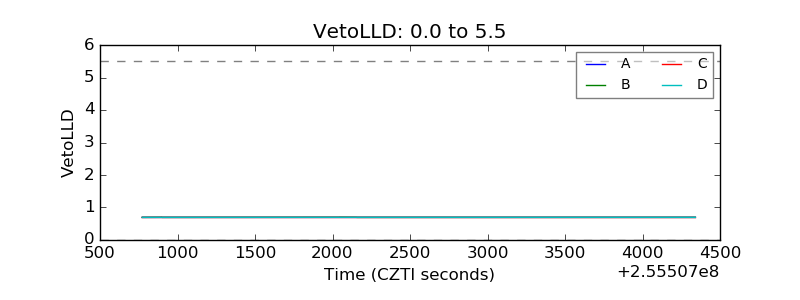 |
| Alpha Counter | 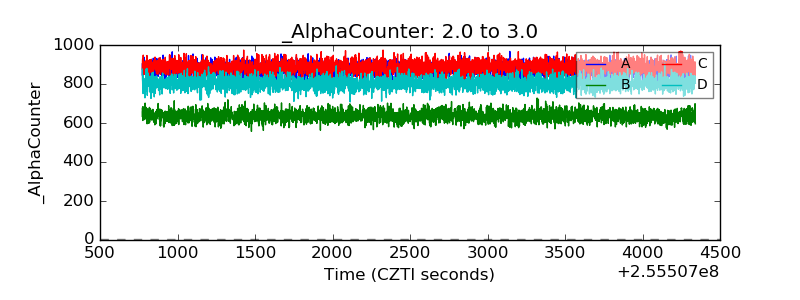 |
| _CPM_Rate | 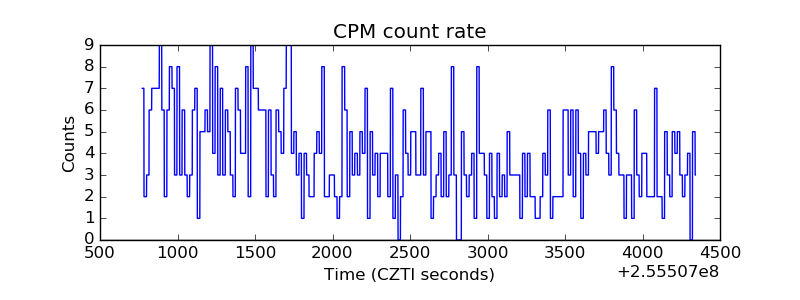 |
| CZT Counter | 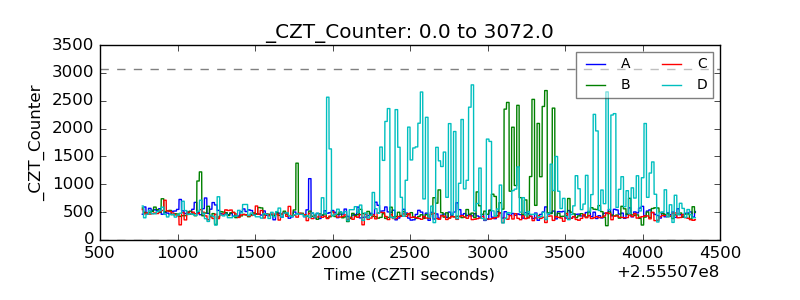 |
| +2.5 Volts monitor |  |
| +5 Volts monitor |  |
| _ROLL_ROT | 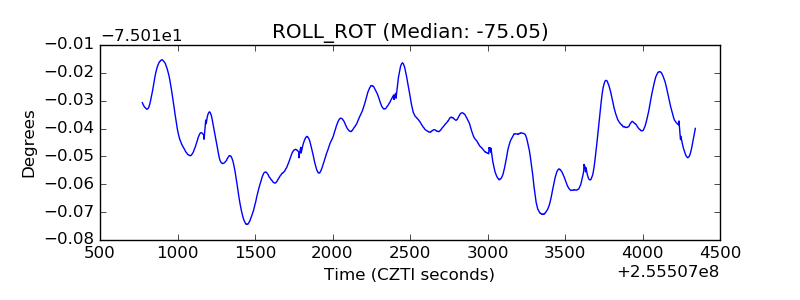 |
| _Roll_DEC | 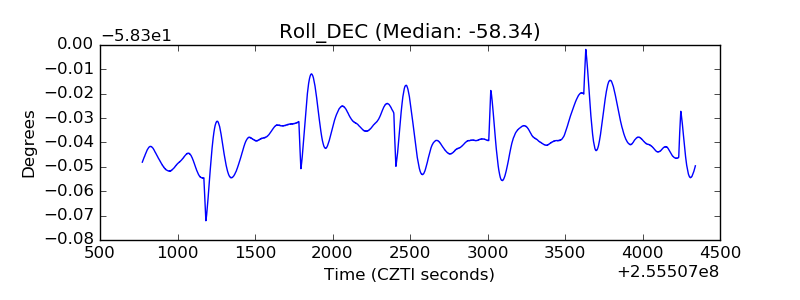 |
| _Roll_RA | 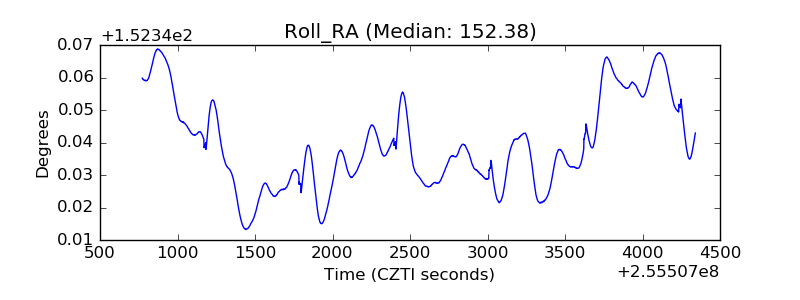 |
| Veto Counter | 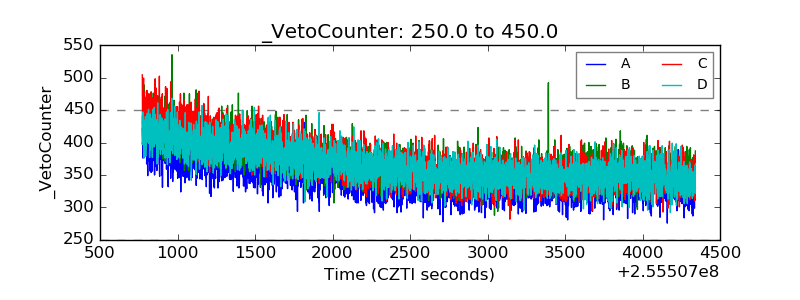 |