| Param | Original file | Final file |
|---|---|---|
| Filename | modeM0/AS1A04_044T01_9000001882cztM0_level2.fits | modeM0/AS1A04_044T01_9000001882cztM0_level2_quad_clean.evt |
| Size (bytes) | 615,329,280 | 597,072,960 |
| Size | 586.8 MB | 569.4 MB |
| Events in quadrant A | 3,769,800 | 3,555,411 |
| Events in quadrant B | 3,511,072 | 3,376,032 |
| Events in quadrant C | 3,685,514 | 3,516,831 |
| Events in quadrant D | 3,211,762 | 3,179,713 |
| Mode M0 | |||
|---|---|---|---|
| Quadrant | BADHDUFLAG | Total packets | Discarded packets |
| A | 0 | 158914 | 0 |
| B | 0 | 170861 | 0 |
| C | 0 | 144536 | 0 |
| D | 0 | 167860 | 0 |
| Mode M9 | |||
|---|---|---|---|
| Quadrant | BADHDUFLAG | Total packets | Discarded packets |
| A | 0 | 105 | 0 |
| B | 0 | 105 | 0 |
| C | 0 | 105 | 0 |
| D | 0 | 105 | 0 |
| Mode SS | |||
|---|---|---|---|
| Quadrant | BADHDUFLAG | Total packets | Discarded packets |
| A | 0 | 1322 | 0 |
| B | 0 | 1322 | 0 |
| C | 0 | 1322 | 0 |
| D | 0 | 1322 | 0 |
| Quadrant | Total seconds | Saturated seconds | Saturation percentage |
|---|---|---|---|
| A | 64945 | 1367 | 2.104858% |
| B | 64945 | 4927 | 7.586419% |
| C | 64945 | 1510 | 2.325044% |
| D | 64945 | 2137 | 3.290477% |
Noise dominated data is calculated using 1-second bins in cleaned event files. If a bin has >2000 counts, and if more than 50% of those come from <1% of pixels, then it is considered to be noise-dominated and hence unusable.
| Quadrant | # 1 sec bins | Bins with >0 counts | Bins with >2000 counts | High rate bins dominated by noise | Noise dominated (total time) | Noise dominated (detector-on time) | Marked lightcurve |
|---|---|---|---|---|---|---|---|
| A | 75444 | 64943 | 0 | 0 | 0.00% | 0.00% |  |
| B | 75444 | 64712 | 0 | 0 | 0.00% | 0.00% | 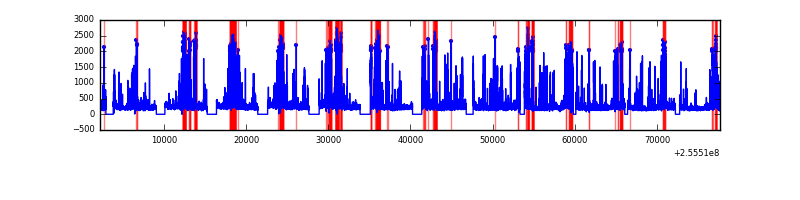 |
| C | 75444 | 64745 | 0 | 0 | 0.00% | 0.00% |  |
| D | 75444 | 64937 | 0 | 0 | 0.00% | 0.00% |  |
Top three noisy pixels from each quadrant. If the there are fewer than three noisy pixels in the level2.evt file, extra rows are filled as -1
| Pixel properties | Quadrant properties | ||||||
|---|---|---|---|---|---|---|---|
| Quadrant | DetID | PixID | Counts | Sigma | Mean | Median | Sigma |
| A | 14 | 188 | 3749 | 11.64 | 979 | 917 | 243.4 |
| A | 0 | 29 | 3629 | 11.14 | 979 | 917 | 243.4 |
| A | 14 | 204 | 3144 | 9.15 | 979 | 917 | 243.4 |
| B | 2 | 9 | 3063 | 11.76 | 927 | 883 | 185.4 |
| B | 3 | 17 | 2325 | 7.78 | 927 | 883 | 185.4 |
| B | 14 | 254 | 2305 | 7.67 | 927 | 883 | 185.4 |
| C | 12 | 241 | 2594 | 6.7 | 972 | 902 | 252.5 |
| C | 3 | 126 | 2481 | 6.25 | 972 | 902 | 252.5 |
| C | 2 | 191 | 2444 | 6.11 | 972 | 902 | 252.5 |
| D | 3 | 14 | 2431 | 6.48 | 916 | 831 | 247.1 |
| D | 6 | 231 | 2364 | 6.2 | 916 | 831 | 247.1 |
| D | 7 | 5 | 2261 | 5.79 | 916 | 831 | 247.1 |
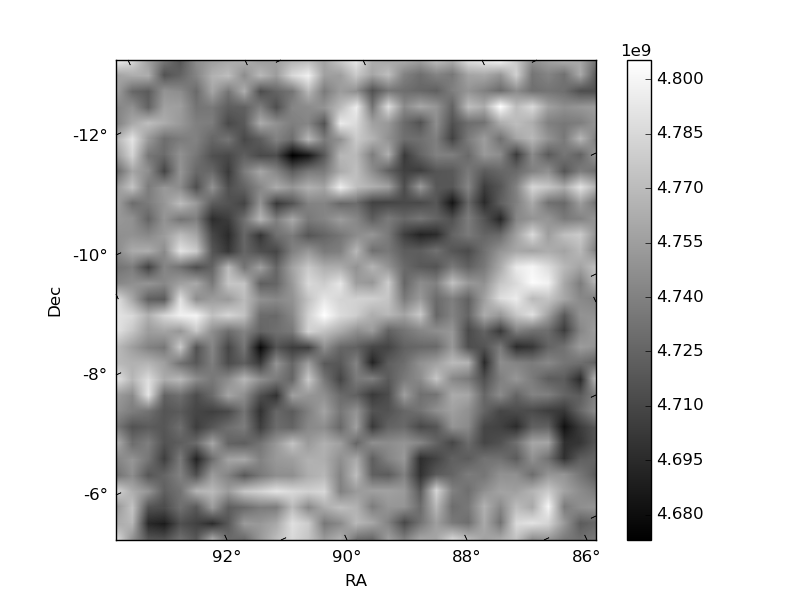
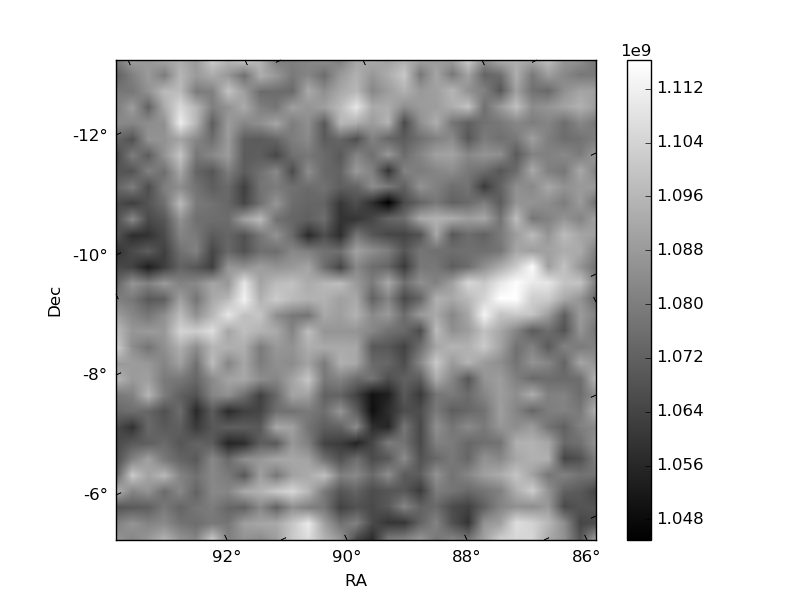
Histogram calculated using DETX and DETY for each event in the final _common_clean file
| Quadrant A | 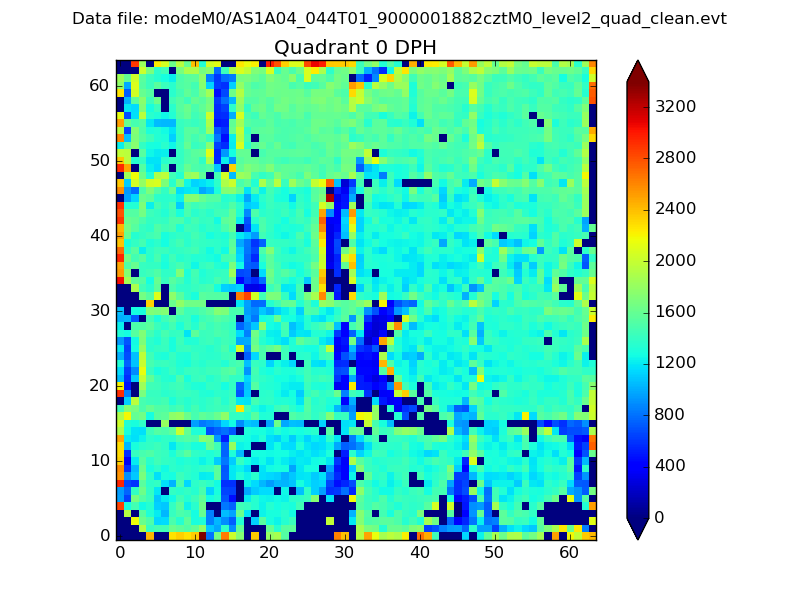 |
 |
Quadrant B |
|---|---|---|---|
| Quadrant D | 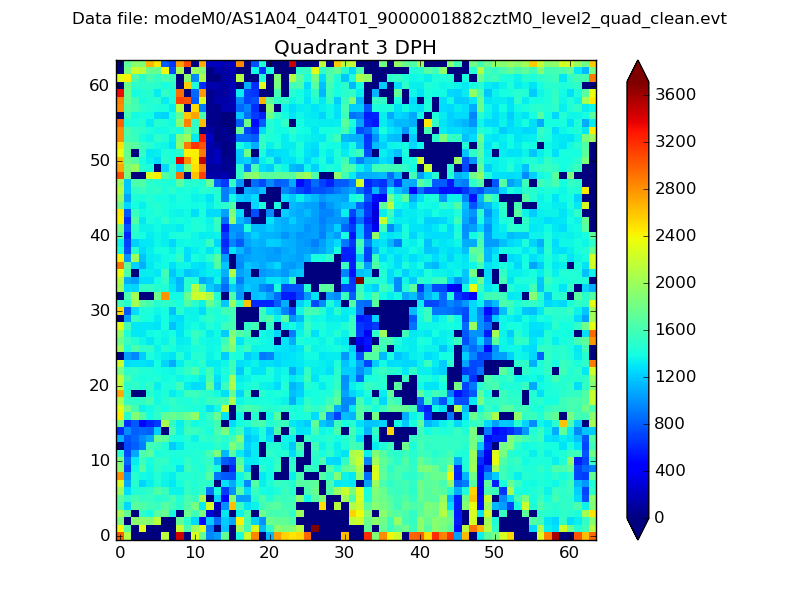 |
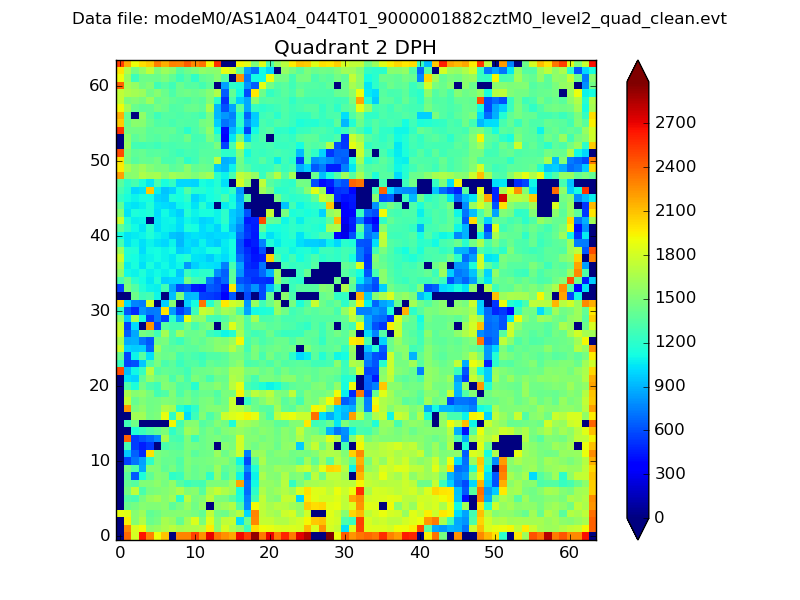 |
Quadrant C |
| Plot type | Count rate plots | Images |
|---|---|---|
| Comparison with Poisson distribution Blue bars denote a histogram of data divided into 1 sec bins. Red curve is a Poisson curve with rate = median count rate of data. |
 |
 |
| Quadrant-wise count rates Data is divided into 100 sec bins |
 |
|
| Module-wise count rates for Quadrant A Data is divided into 100 sec bins |
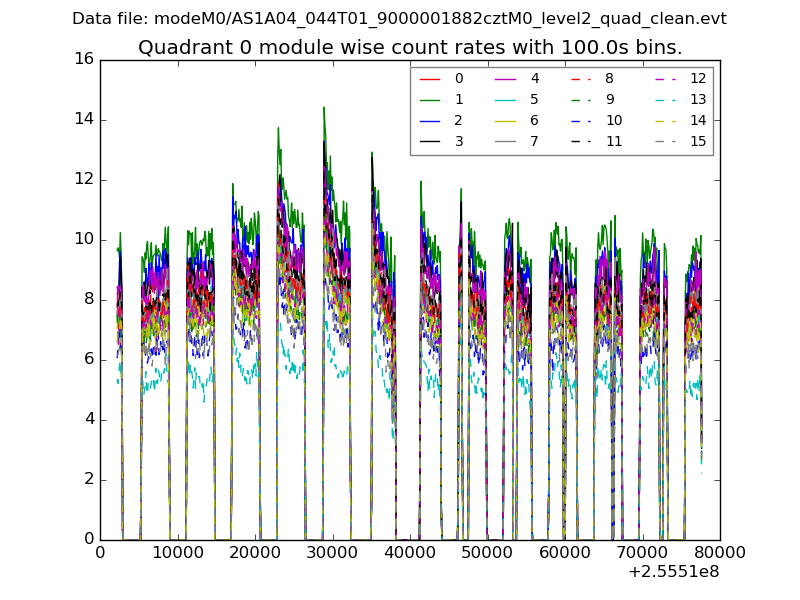 |
 |
| Module-wise count rates for Quadrant B Data is divided into 100 sec bins |
 |
 |
| Module-wise count rates for Quadrant C Data is divided into 100 sec bins |
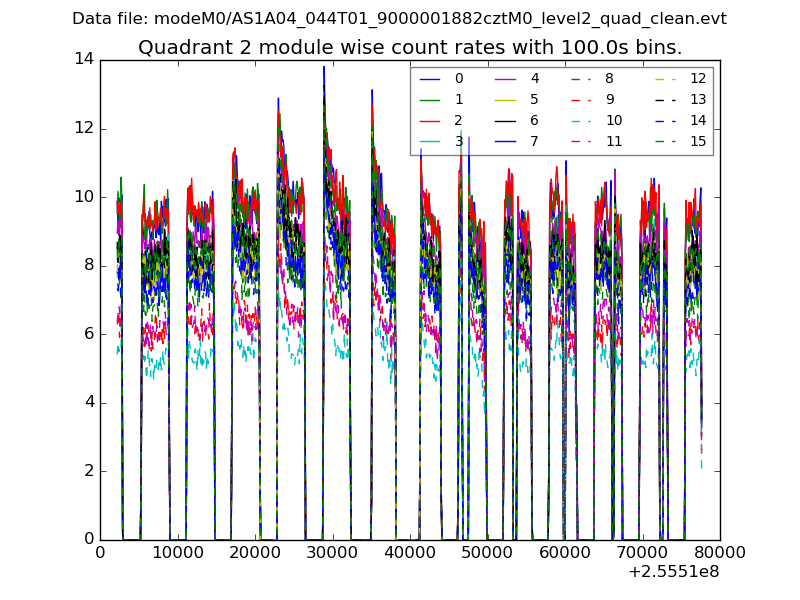 |
 |
| Module-wise count rates for Quadrant D Data is divided into 100 sec bins |
 |
 |
| Parameter | Plot |
|---|---|
| CZT HV Monitor |  |
| D_VDD | 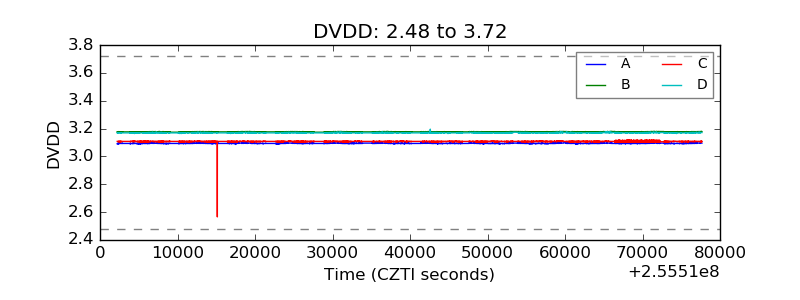 |
| Temperature 1 |  |
| Veto HV Monitor | 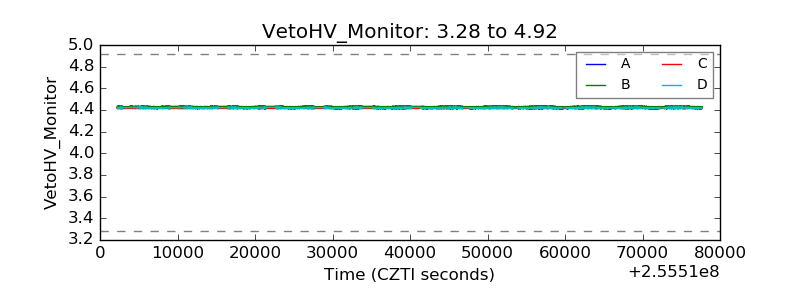 |
| Veto LLD | 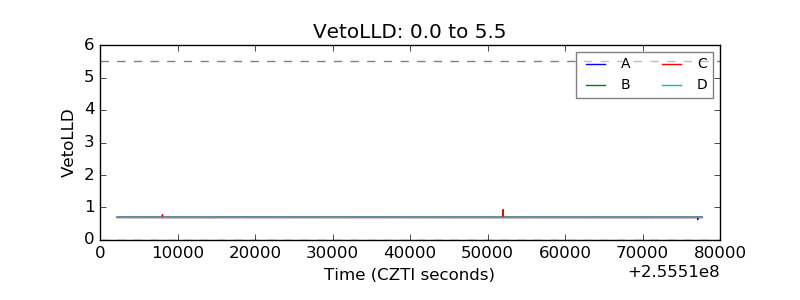 |
| Alpha Counter | 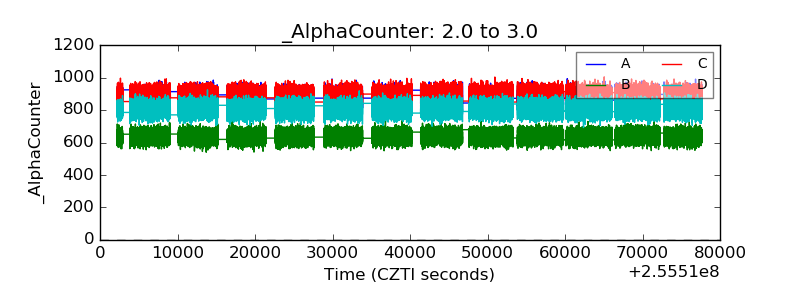 |
| _CPM_Rate |  |
| CZT Counter |  |
| +2.5 Volts monitor | 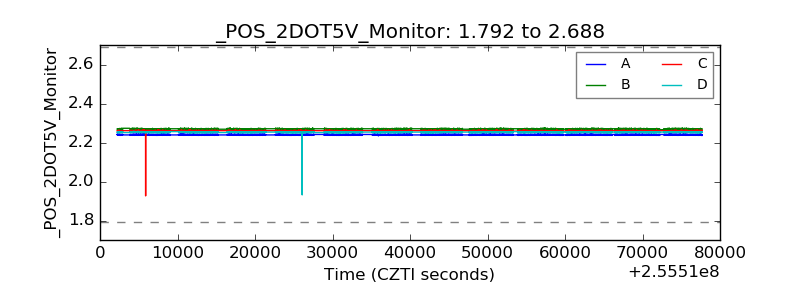 |
| +5 Volts monitor | 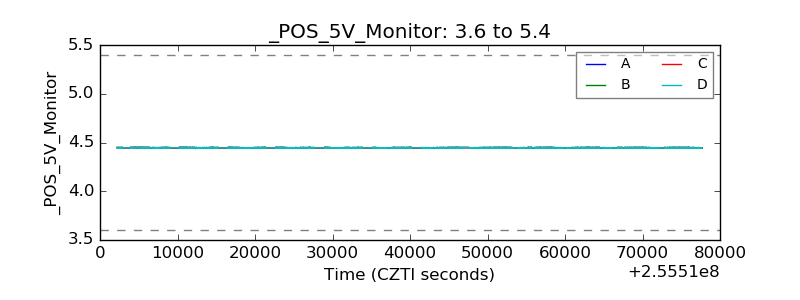 |
| _ROLL_ROT | 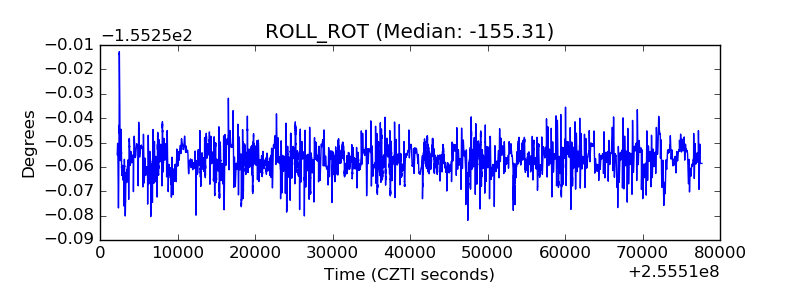 |
| _Roll_DEC |  |
| _Roll_RA | 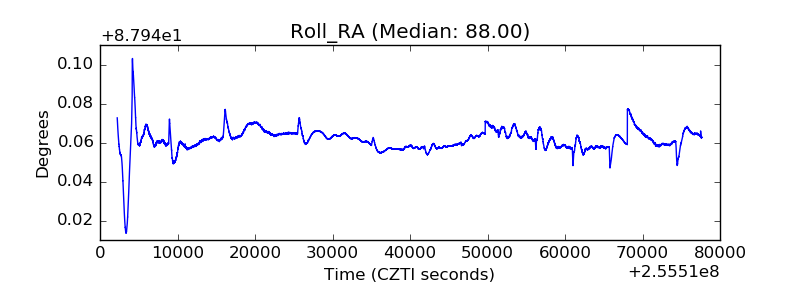 |
| Veto Counter | 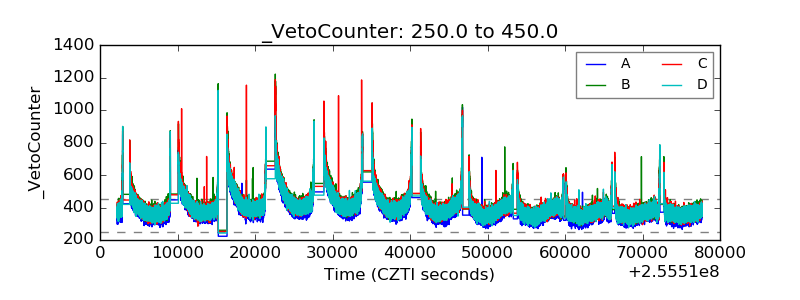 |