| Param | Original file | Final file |
|---|---|---|
| Filename | modeM0/AS1A04_044T01_9000001882_12747cztM0_level2.evt | modeM0/AS1A04_044T01_9000001882_12747cztM0_level2_quad_clean.evt |
| Size (bytes) | 497,465,280 | 76,296,960 |
| Size | 474.4 MB | 72.8 MB |
| Events in quadrant A | 3,425,762 | 464,146 |
| Events in quadrant B | 3,958,284 | 456,640 |
| Events in quadrant C | 3,106,427 | 477,455 |
| Events in quadrant D | 4,127,389 | 451,799 |
| Mode M0 | |||
|---|---|---|---|
| Quadrant | BADHDUFLAG | Total packets | Discarded packets |
| A | 0 | 14144 | 3 |
| B | 0 | 15910 | 2 |
| C | 0 | 13594 | 2 |
| D | 0 | 16649 | 2 |
| Mode M9 | |||
|---|---|---|---|
| Quadrant | BADHDUFLAG | Total packets | Discarded packets |
| A | 0 | 15 | 0 |
| B | 0 | 15 | 0 |
| C | 0 | 15 | 0 |
| D | 0 | 16 | 0 |
| Mode SS | |||
|---|---|---|---|
| Quadrant | BADHDUFLAG | Total packets | Discarded packets |
| A | 0 | 132 | 0 |
| B | 0 | 132 | 0 |
| C | 0 | 132 | 0 |
| D | 0 | 132 | 0 |
| Quadrant | Total seconds | Saturated seconds | Saturation percentage |
|---|---|---|---|
| A | 6606 | 75 | 1.135332% |
| B | 6606 | 293 | 4.435362% |
| C | 6606 | 37 | 0.560097% |
| D | 6606 | 167 | 2.528005% |
Noise dominated data is calculated using 1-second bins in cleaned event files. If a bin has >2000 counts, and if more than 50% of those come from <1% of pixels, then it is considered to be noise-dominated and hence unusable.
| Quadrant | # 1 sec bins | Bins with >0 counts | Bins with >2000 counts | High rate bins dominated by noise | Noise dominated (total time) | Noise dominated (detector-on time) | Marked lightcurve |
|---|---|---|---|---|---|---|---|
| A | 7648 | 6609 | 6 | 6 | 0.08% | 0.09% | 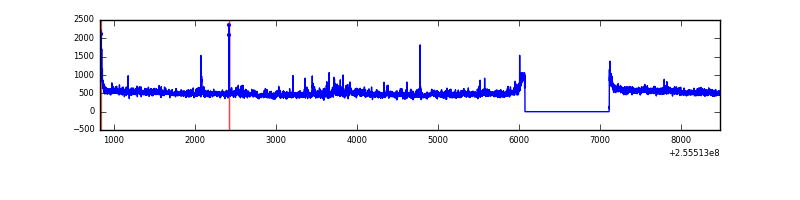 |
| B | 7648 | 6609 | 165 | 165 | 2.16% | 2.50% | 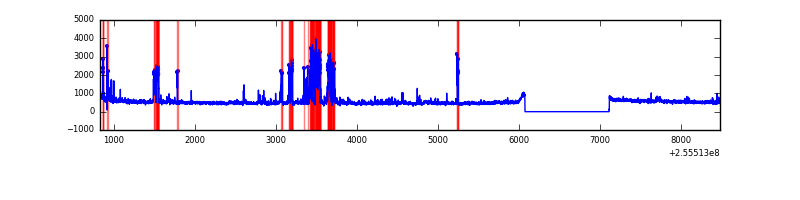 |
| C | 7648 | 6609 | 0 | 0 | 0.00% | 0.00% | 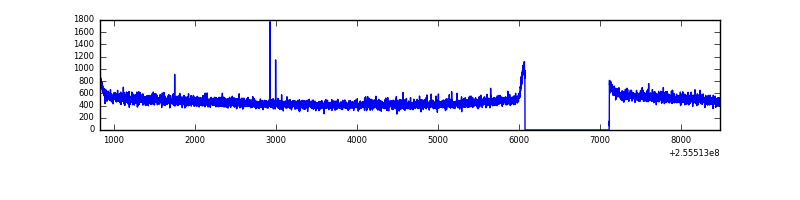 |
| D | 7648 | 6609 | 119 | 119 | 1.56% | 1.80% | 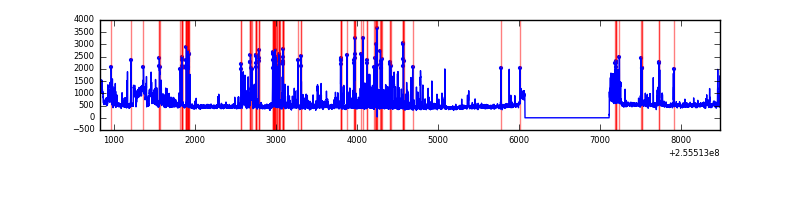 |
Top three noisy pixels from each quadrant. If the there are fewer than three noisy pixels in the level2.evt file, extra rows are filled as -1
| Pixel properties | Quadrant properties | ||||||
|---|---|---|---|---|---|---|---|
| Quadrant | DetID | PixID | Counts | Sigma | Mean | Median | Sigma |
| A | 8 | 15 | 142801 | 857.67 | 816 | 801 | 165.6 |
| A | 15 | 222 | 76825 | 459.18 | 816 | 801 | 165.6 |
| A | 15 | 239 | 30162 | 177.34 | 816 | 801 | 165.6 |
| B | 4 | 239 | 639805 | 4153.62 | 805 | 787 | 153.8 |
| B | 0 | 214 | 50701 | 324.44 | 805 | 787 | 153.8 |
| B | 3 | 209 | 32332 | 205.04 | 805 | 787 | 153.8 |
| C | 13 | 61 | 5858 | 27.28 | 795 | 802 | 185.4 |
| C | 14 | 234 | 5027 | 22.79 | 795 | 802 | 185.4 |
| C | 3 | 202 | 1945 | 6.17 | 795 | 802 | 185.4 |
| D | 1 | 52 | 928203 | 4484.05 | 781 | 765 | 206.8 |
| D | 10 | 199 | 80923 | 387.55 | 781 | 765 | 206.8 |
| D | 13 | 170 | 60779 | 290.16 | 781 | 765 | 206.8 |
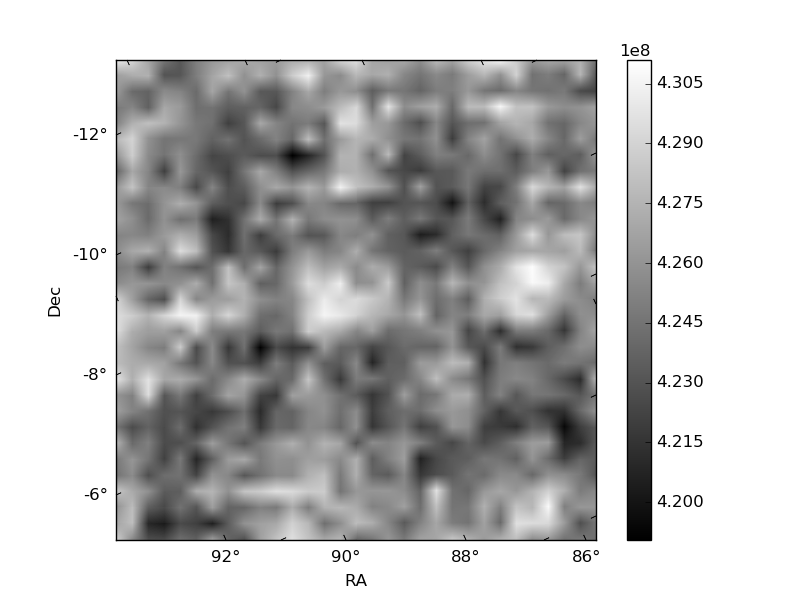
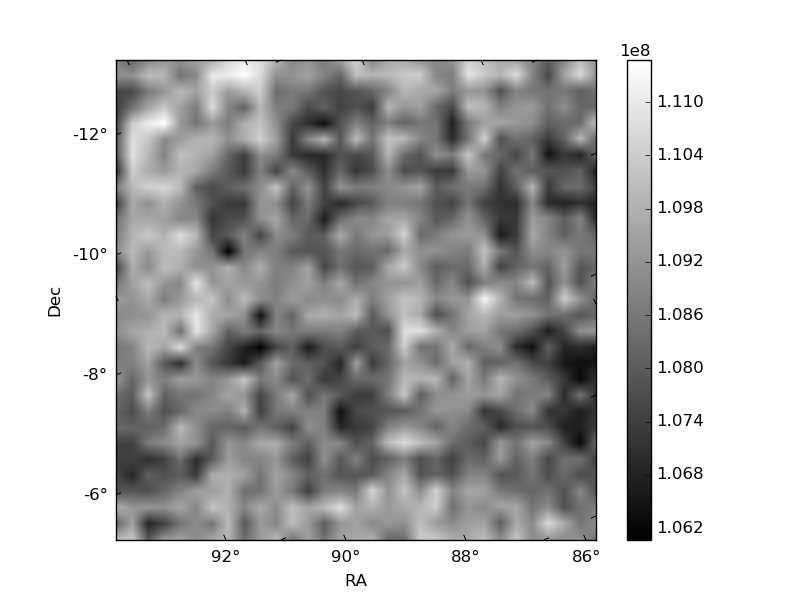
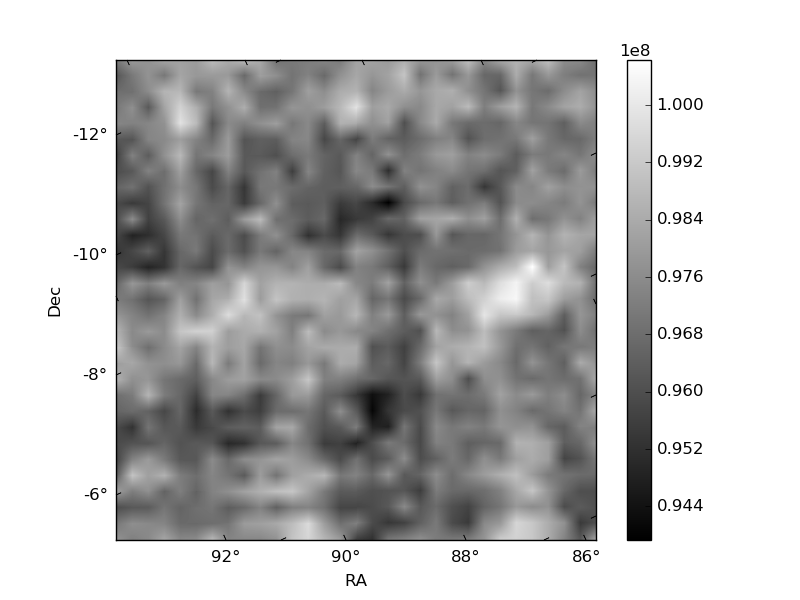
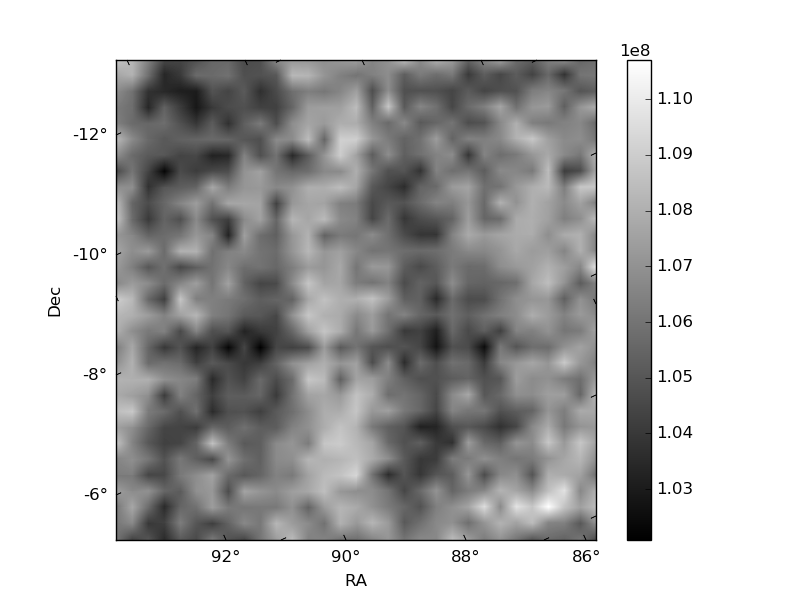
Histogram calculated using DETX and DETY for each event in the final _common_clean file
| Quadrant A | 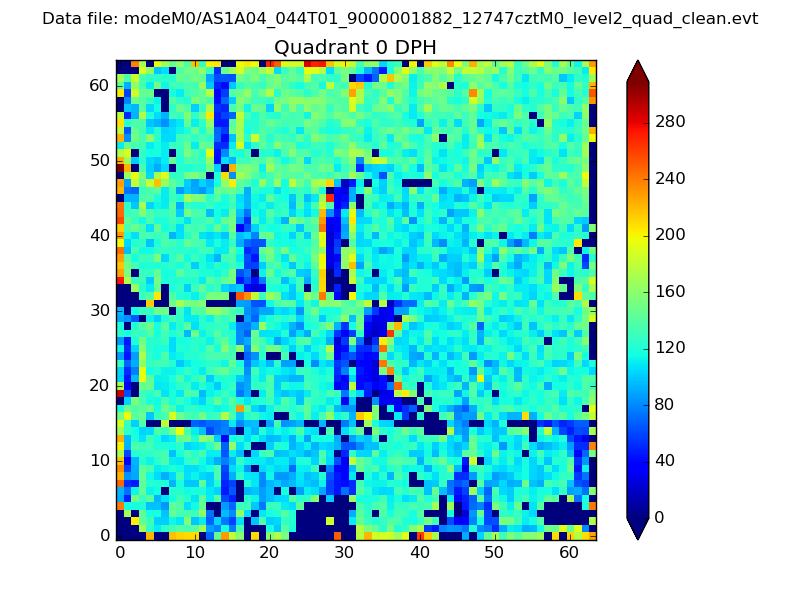 |
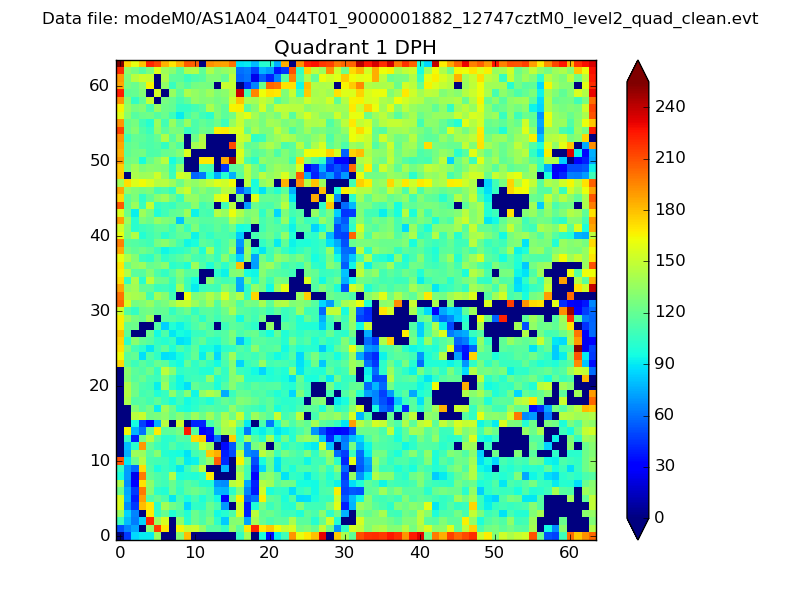 |
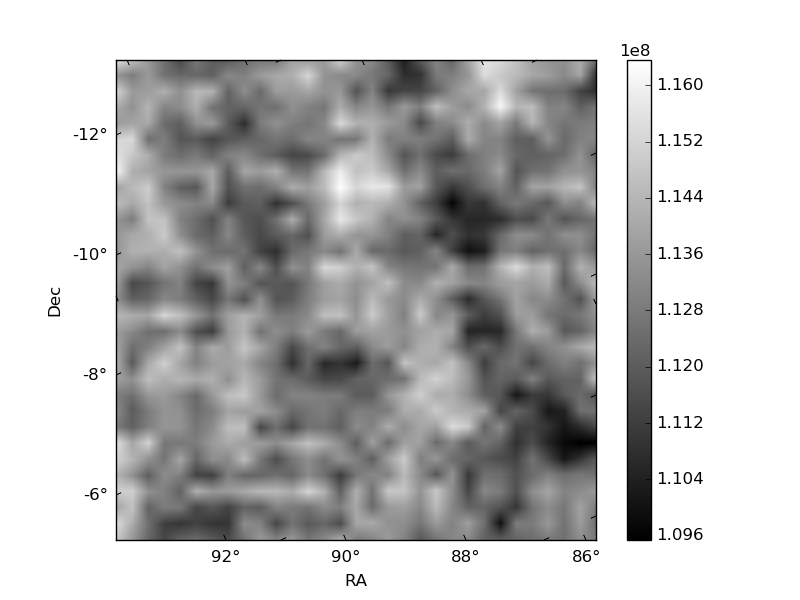
Quadrant B |
|---|---|---|---|
| Quadrant D | 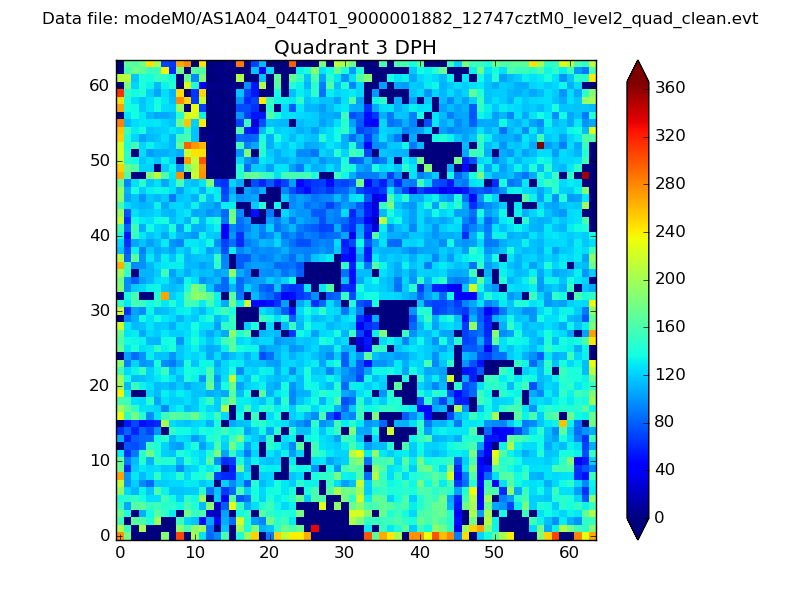 |
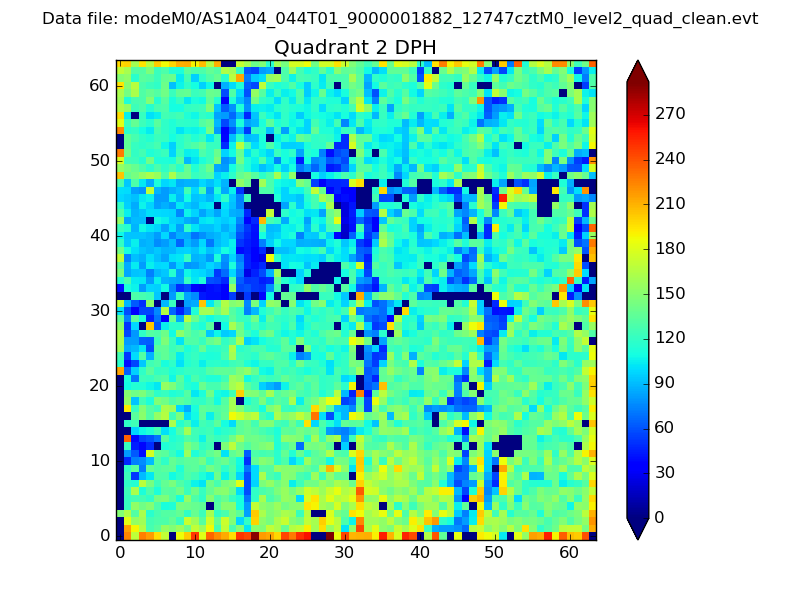 |
Quadrant C |
| Plot type | Count rate plots | Images |
|---|---|---|
| Comparison with Poisson distribution Blue bars denote a histogram of data divided into 1 sec bins. Red curve is a Poisson curve with rate = median count rate of data. |
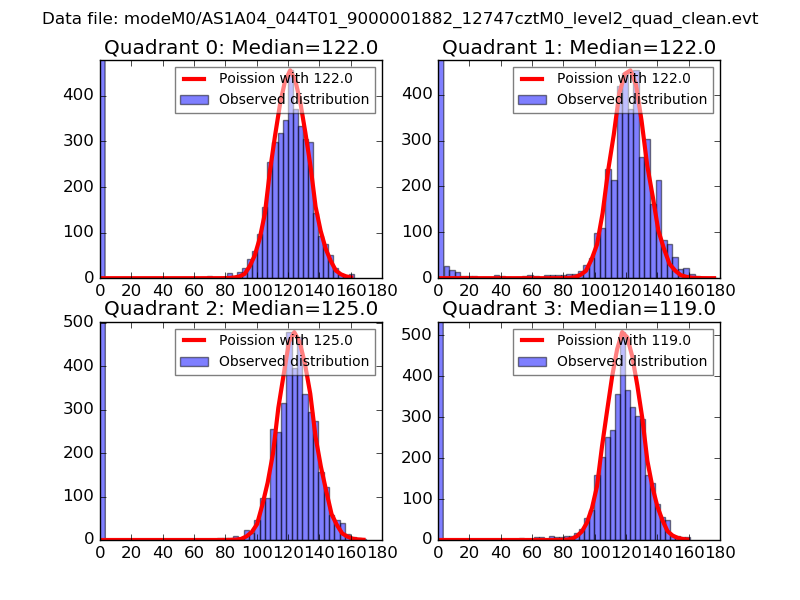 |
 |
| Quadrant-wise count rates Data is divided into 100 sec bins |
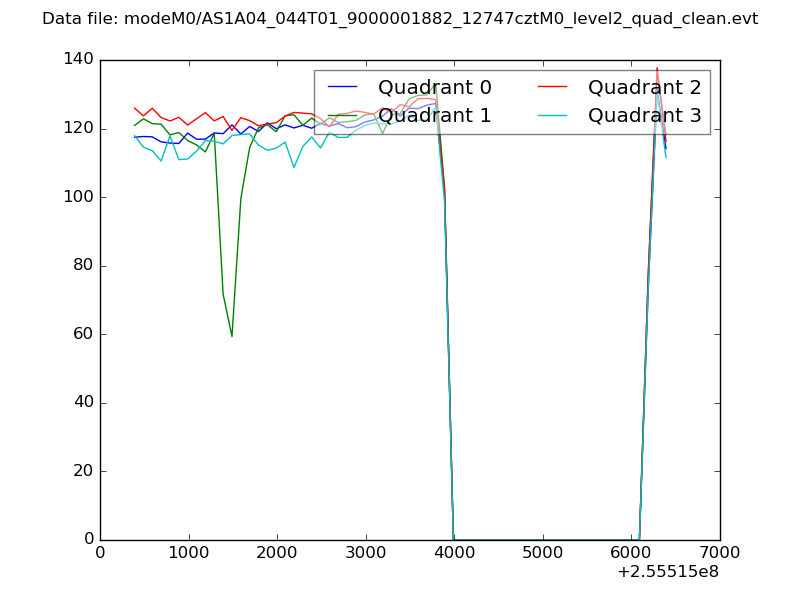 |
|
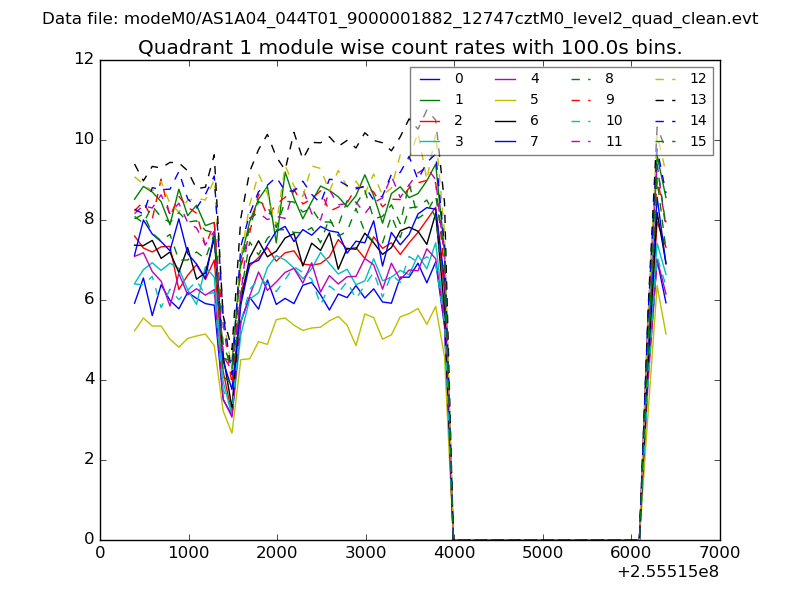
| Module-wise count rates for Quadrant A Data is divided into 100 sec bins |
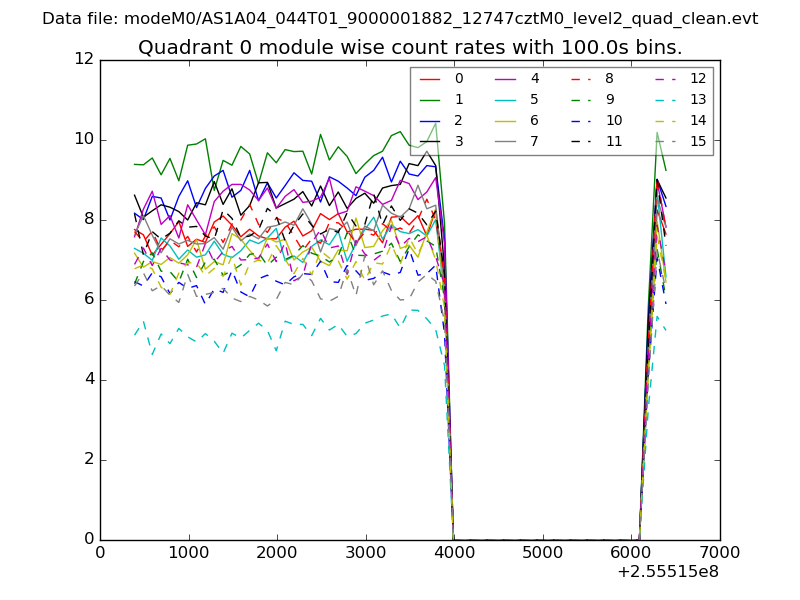 |
 |
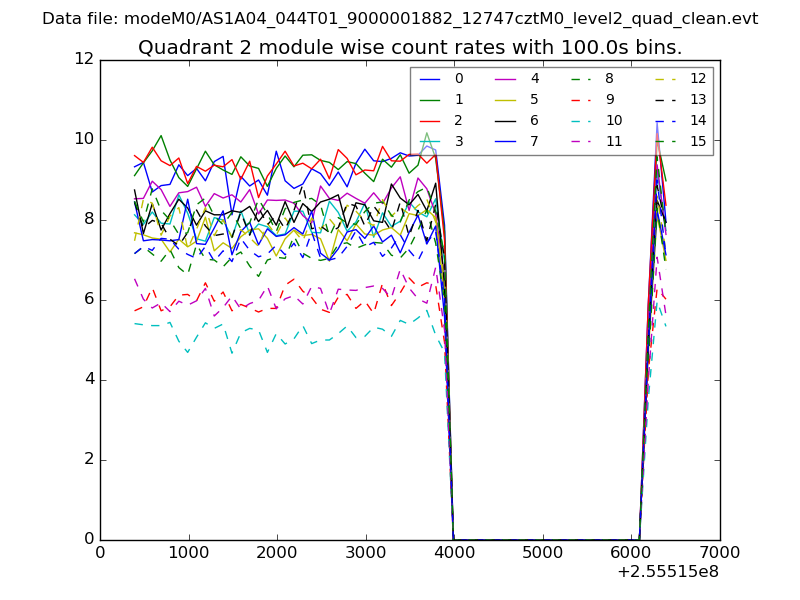
| Module-wise count rates for Quadrant B Data is divided into 100 sec bins |
 |
 |
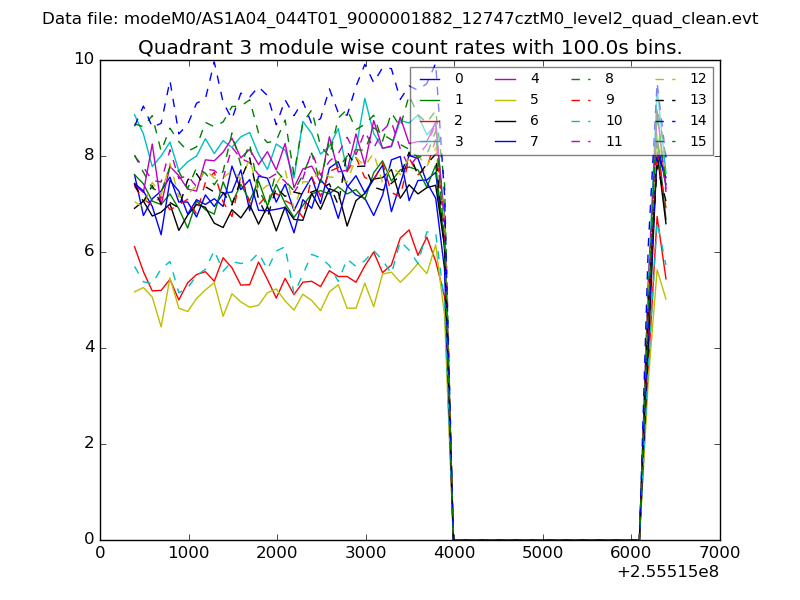
| Module-wise count rates for Quadrant C Data is divided into 100 sec bins |
 |
 |
| Module-wise count rates for Quadrant D Data is divided into 100 sec bins |
 |
 |
| Parameter | Plot |
|---|---|
| CZT HV Monitor | 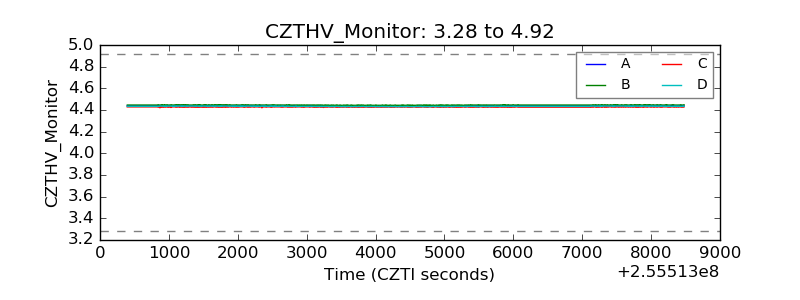 |
| D_VDD | 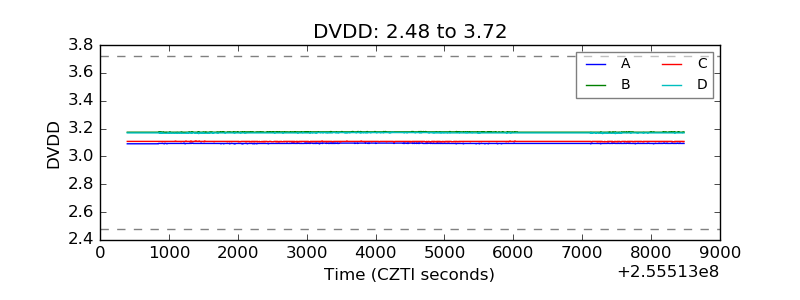 |
| Temperature 1 | 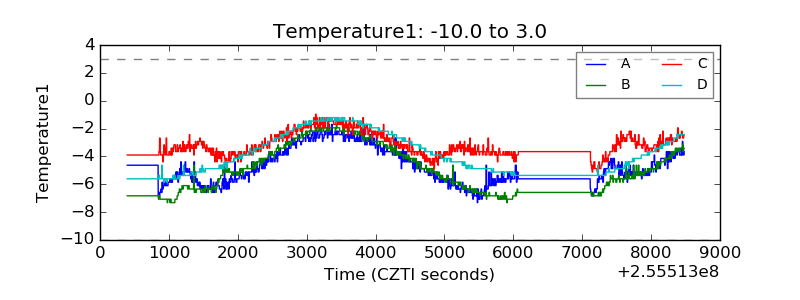 |
| Veto HV Monitor | 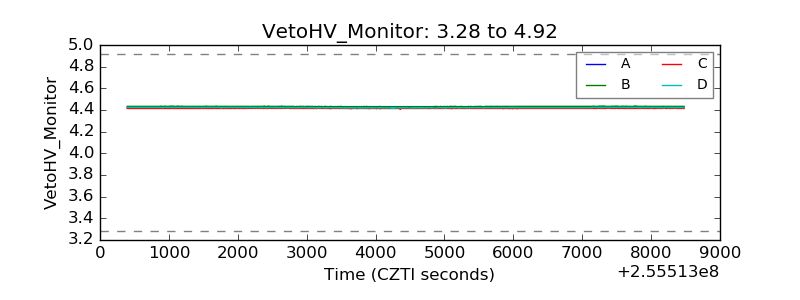 |
| Veto LLD | 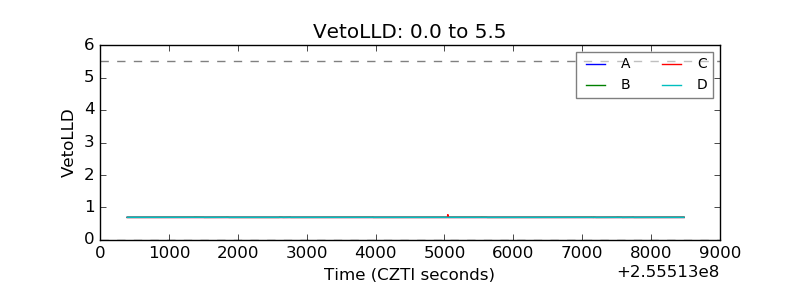 |
| Alpha Counter | 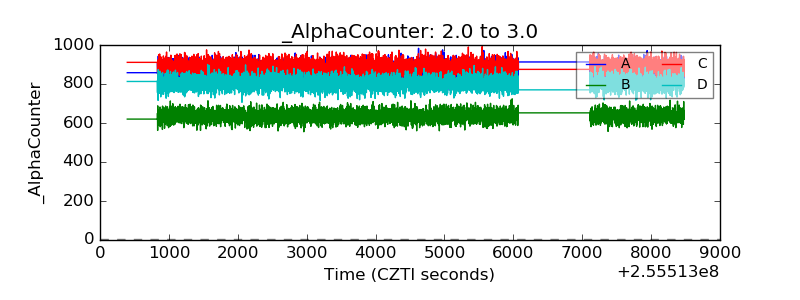 |
| _CPM_Rate | 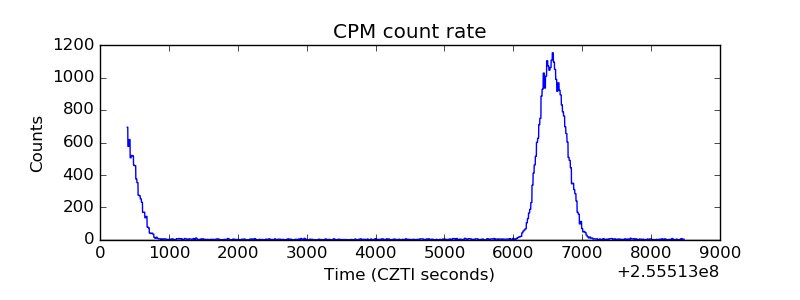 |
| CZT Counter | 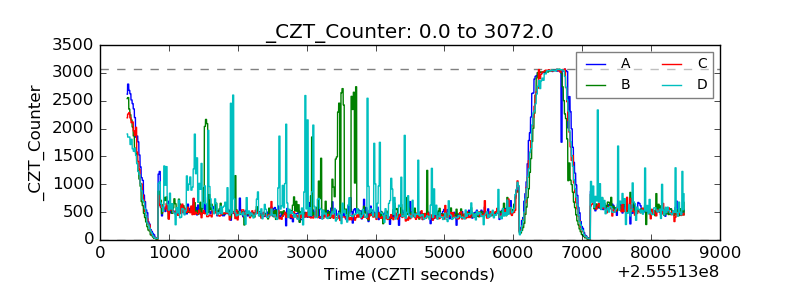 |
| +2.5 Volts monitor |  |
| +5 Volts monitor |  |
| _ROLL_ROT | 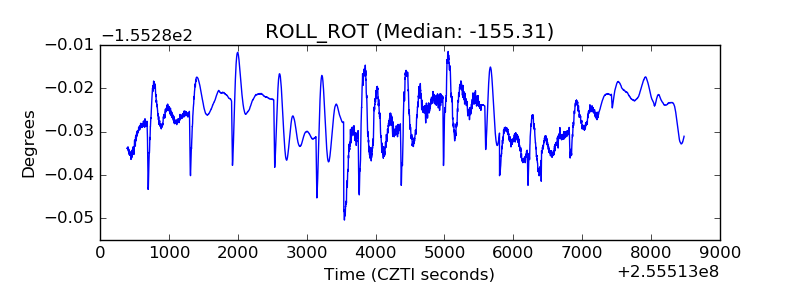 |
| _Roll_DEC |  |
| _Roll_RA | 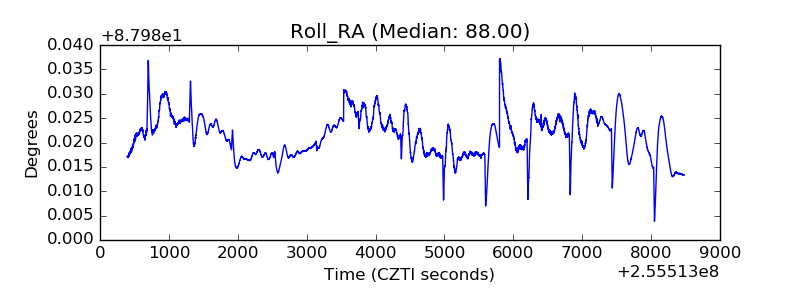 |
| Veto Counter | 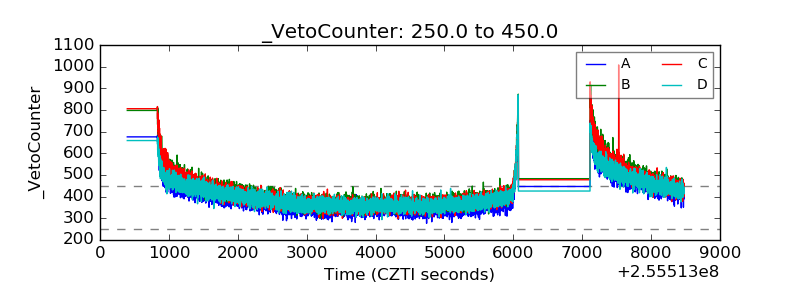 |