| Param | Original file | Final file |
|---|---|---|
| Filename | modeM0/AS1A04_044T01_9000001882_12750cztM0_level2.evt | modeM0/AS1A04_044T01_9000001882_12750cztM0_level2_quad_clean.evt |
| Size (bytes) | 498,744,000 | 96,759,360 |
| Size | 475.6 MB | 92.3 MB |
| Events in quadrant A | 3,382,887 | 629,922 |
| Events in quadrant B | 4,509,744 | 615,795 |
| Events in quadrant C | 3,118,054 | 635,944 |
| Events in quadrant D | 3,667,678 | 610,337 |
| Mode M0 | |||
|---|---|---|---|
| Quadrant | BADHDUFLAG | Total packets | Discarded packets |
| A | 0 | 14123 | 3 |
| B | 0 | 17568 | 2 |
| C | 0 | 13364 | 2 |
| D | 0 | 15016 | 2 |
| Mode M9 | |||
|---|---|---|---|
| Quadrant | BADHDUFLAG | Total packets | Discarded packets |
| A | 0 | 14 | 0 |
| B | 0 | 14 | 0 |
| C | 0 | 14 | 0 |
| D | 0 | 15 | 0 |
| Mode SS | |||
|---|---|---|---|
| Quadrant | BADHDUFLAG | Total packets | Discarded packets |
| A | 0 | 128 | 0 |
| B | 0 | 128 | 0 |
| C | 0 | 128 | 0 |
| D | 0 | 128 | 0 |
| Quadrant | Total seconds | Saturated seconds | Saturation percentage |
|---|---|---|---|
| A | 6278 | 105 | 1.672507% |
| B | 6278 | 475 | 7.566104% |
| C | 6278 | 56 | 0.892004% |
| D | 6278 | 113 | 1.799936% |
Noise dominated data is calculated using 1-second bins in cleaned event files. If a bin has >2000 counts, and if more than 50% of those come from <1% of pixels, then it is considered to be noise-dominated and hence unusable.
| Quadrant | # 1 sec bins | Bins with >0 counts | Bins with >2000 counts | High rate bins dominated by noise | Noise dominated (total time) | Noise dominated (detector-on time) | Marked lightcurve |
|---|---|---|---|---|---|---|---|
| A | 7488 | 6278 | 2 | 2 | 0.03% | 0.03% |  |
| B | 7488 | 6278 | 324 | 324 | 4.33% | 5.16% |  |
| C | 7488 | 6278 | 0 | 0 | 0.00% | 0.00% | 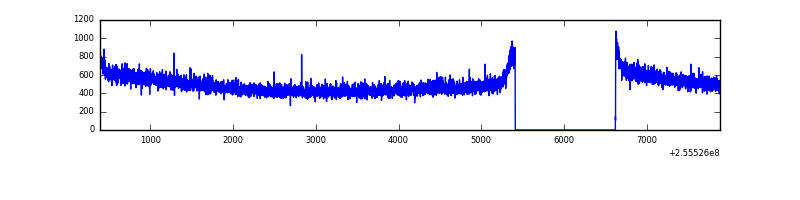 |
| D | 7488 | 6278 | 45 | 45 | 0.60% | 0.72% | 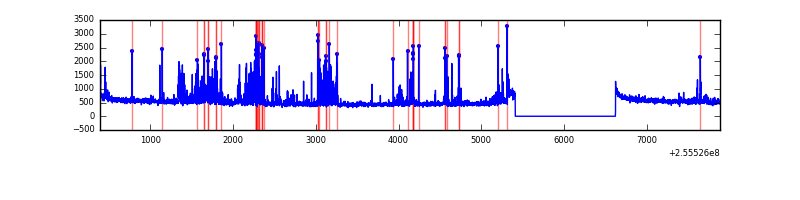 |
Top three noisy pixels from each quadrant. If the there are fewer than three noisy pixels in the level2.evt file, extra rows are filled as -1
| Pixel properties | Quadrant properties | ||||||
|---|---|---|---|---|---|---|---|
| Quadrant | DetID | PixID | Counts | Sigma | Mean | Median | Sigma |
| A | 8 | 15 | 56771 | 332.13 | 836 | 820 | 168.5 |
| A | 15 | 239 | 40965 | 238.31 | 836 | 820 | 168.5 |
| A | 15 | 222 | 33403 | 193.42 | 836 | 820 | 168.5 |
| B | 4 | 239 | 1146721 | 7492.19 | 811 | 794 | 152.9 |
| B | 15 | 32 | 69891 | 451.76 | 811 | 794 | 152.9 |
| B | 0 | 214 | 28044 | 178.16 | 811 | 794 | 152.9 |
| C | 13 | 61 | 5771 | 26.92 | 800 | 804 | 184.5 |
| C | 3 | 202 | 1952 | 6.22 | 800 | 804 | 184.5 |
| C | -1 | -1 | -1 | -1.0 | 800 | 804 | 184.5 |
| D | 1 | 52 | 392001 | 1896.38 | 798 | 782 | 206.3 |
| D | 2 | 136 | 130795 | 630.22 | 798 | 782 | 206.3 |
| D | 8 | 195 | 48260 | 230.14 | 798 | 782 | 206.3 |
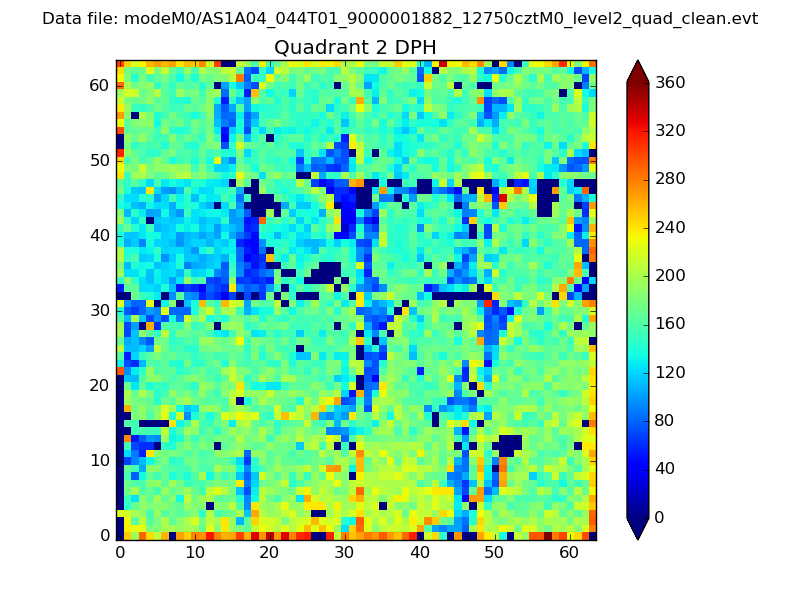
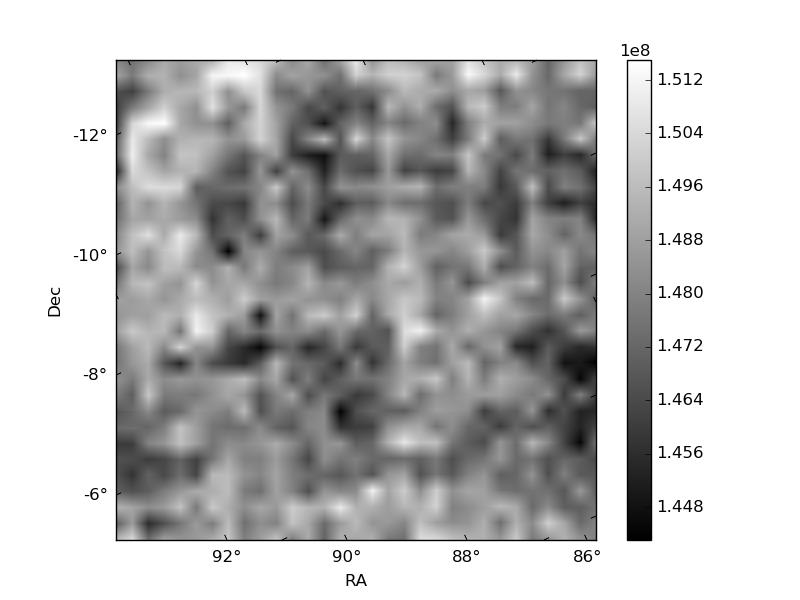
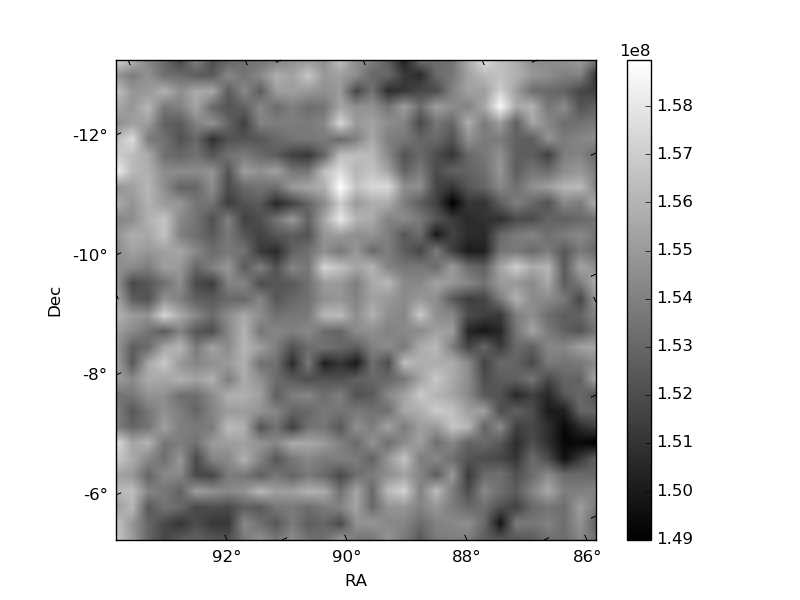
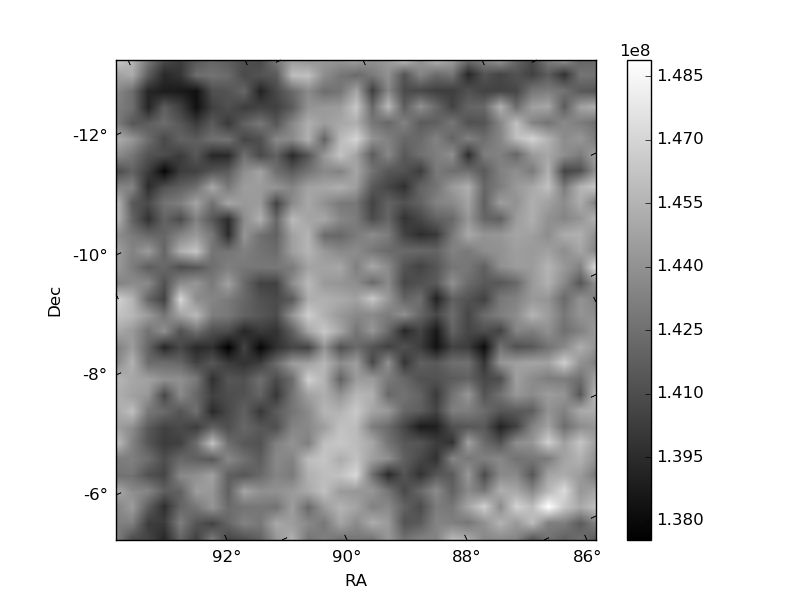
Histogram calculated using DETX and DETY for each event in the final _common_clean file
| Quadrant A | 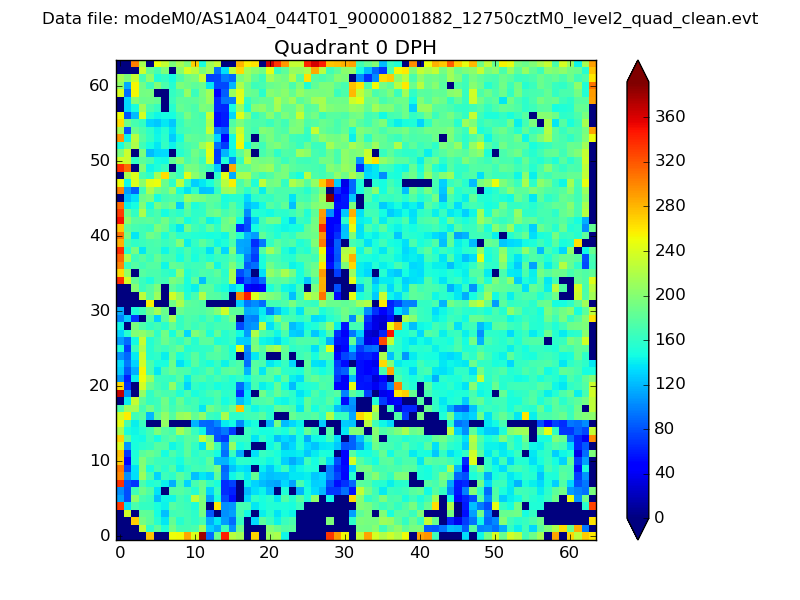 |
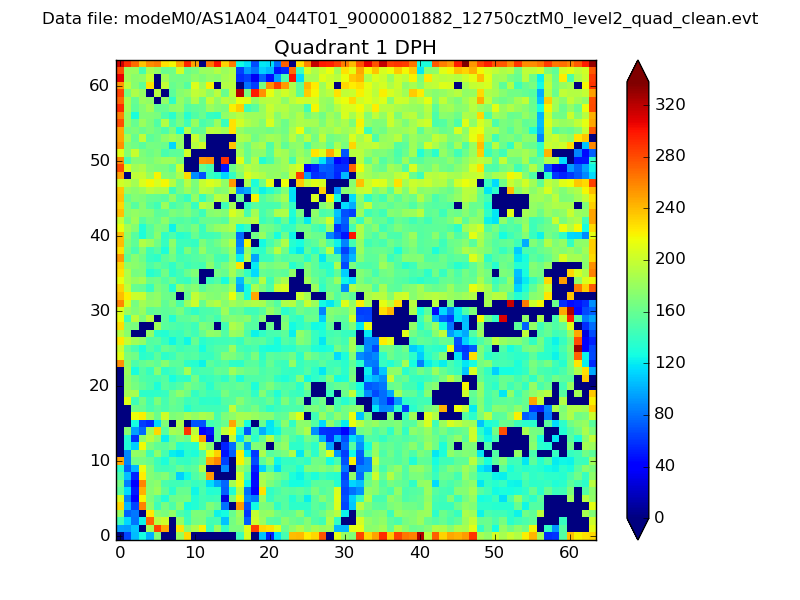 |
Quadrant B |
|---|---|---|---|
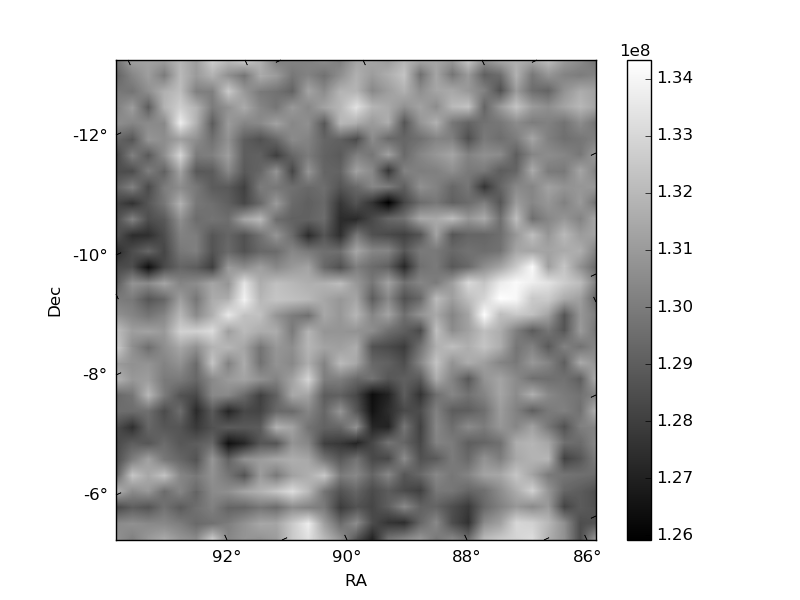
| Quadrant D | 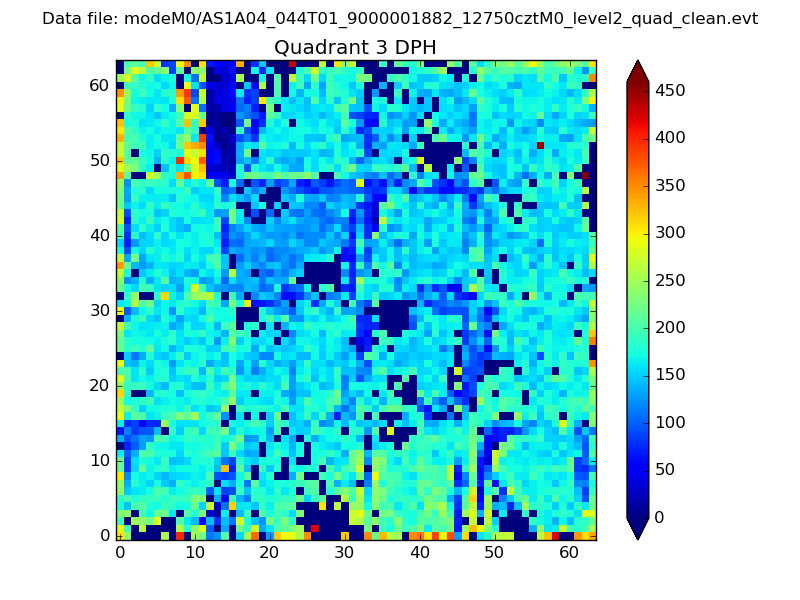 |
 |
Quadrant C |
| Plot type | Count rate plots | Images |
|---|---|---|
| Comparison with Poisson distribution Blue bars denote a histogram of data divided into 1 sec bins. Red curve is a Poisson curve with rate = median count rate of data. |
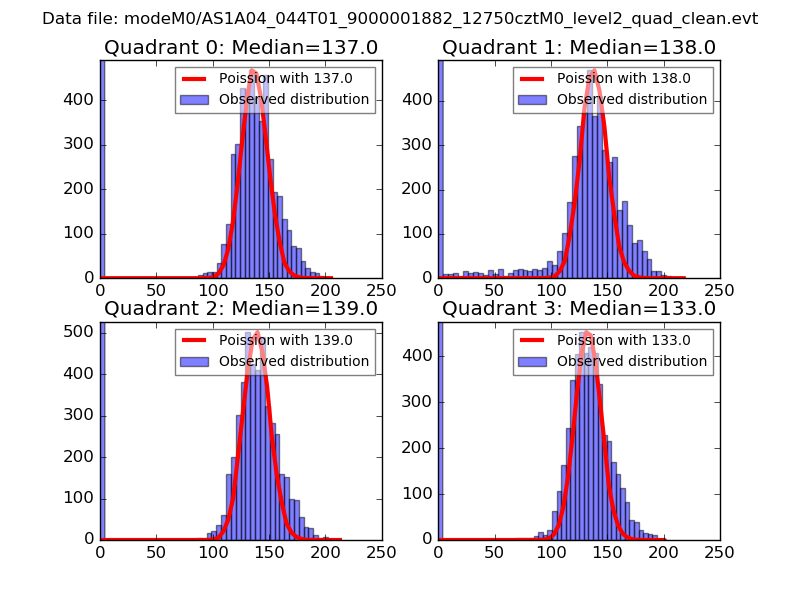 |
 |
| Quadrant-wise count rates Data is divided into 100 sec bins |
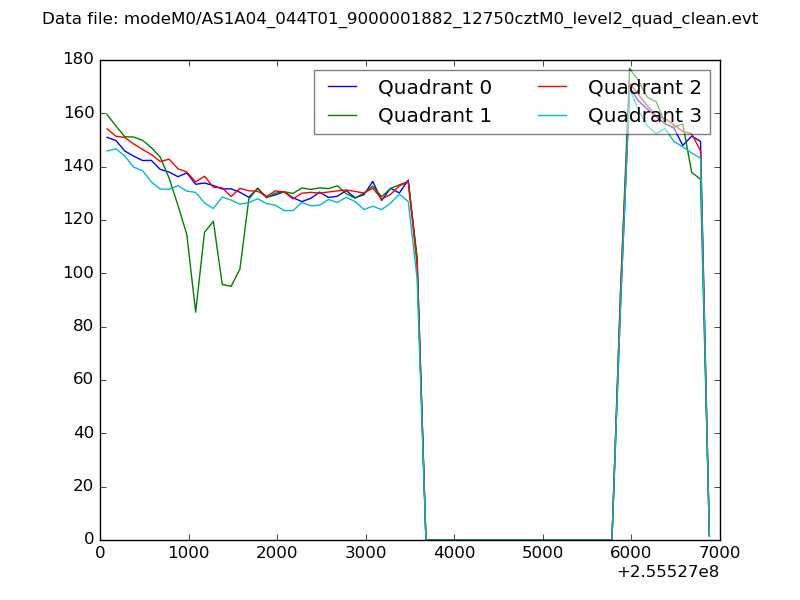 |
|
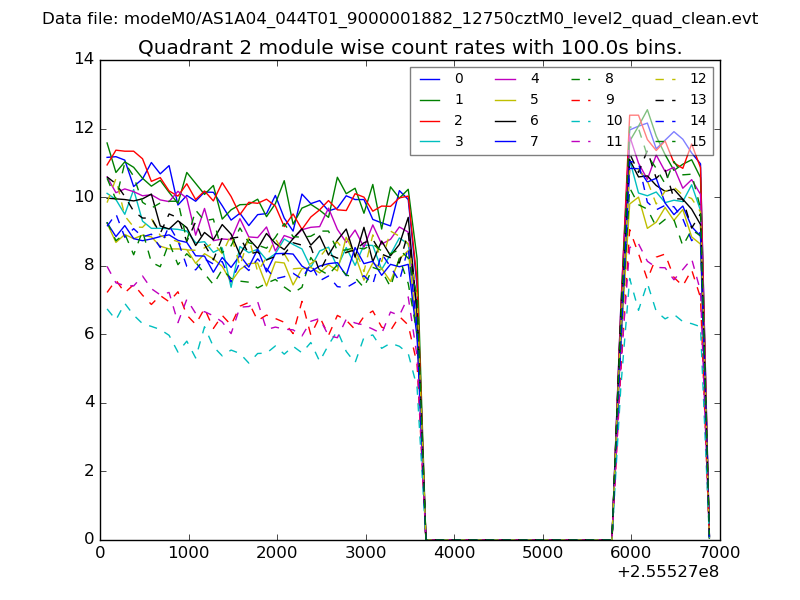
| Module-wise count rates for Quadrant A Data is divided into 100 sec bins |
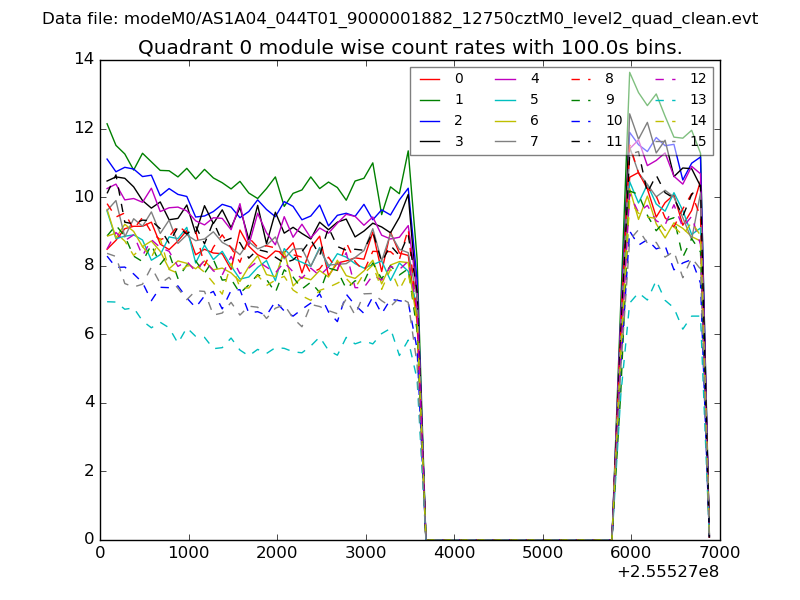 |
 |
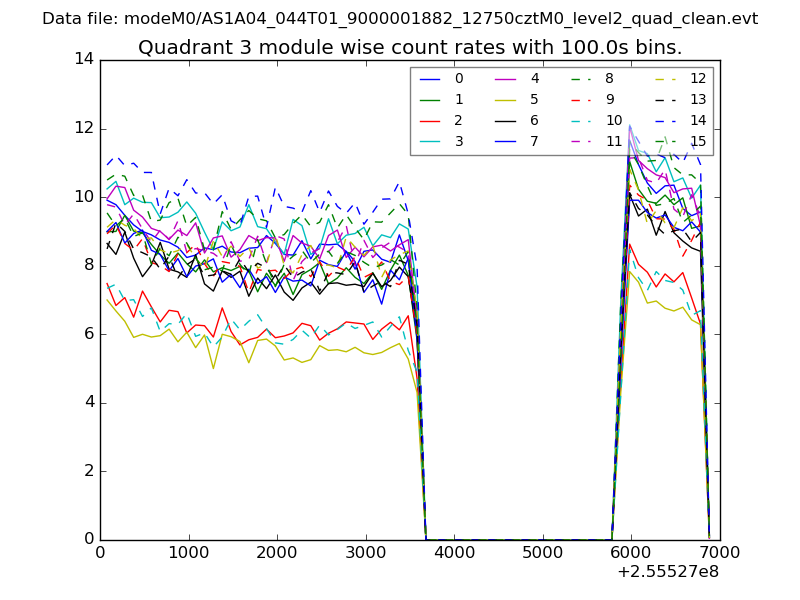
| Module-wise count rates for Quadrant B Data is divided into 100 sec bins |
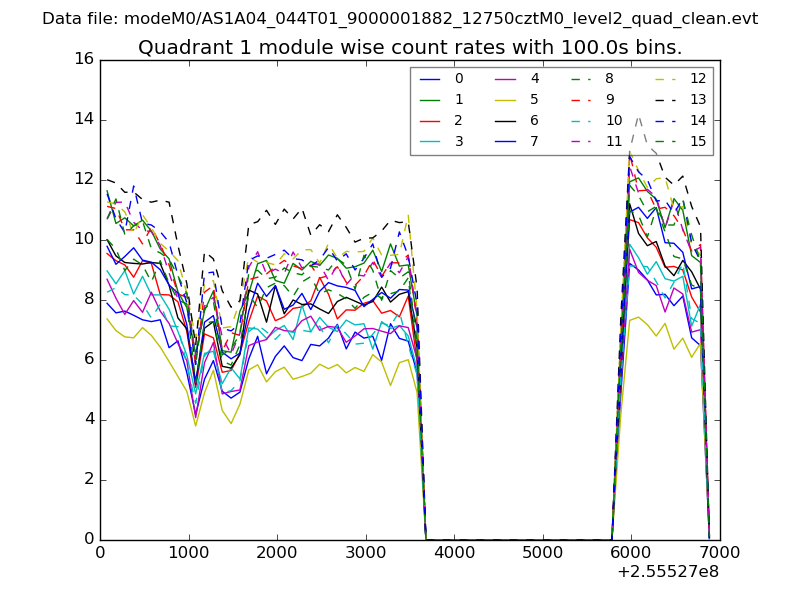 |
 |
| Module-wise count rates for Quadrant C Data is divided into 100 sec bins |
 |
 |
| Module-wise count rates for Quadrant D Data is divided into 100 sec bins |
 |
 |
| Parameter | Plot |
|---|---|
| CZT HV Monitor | 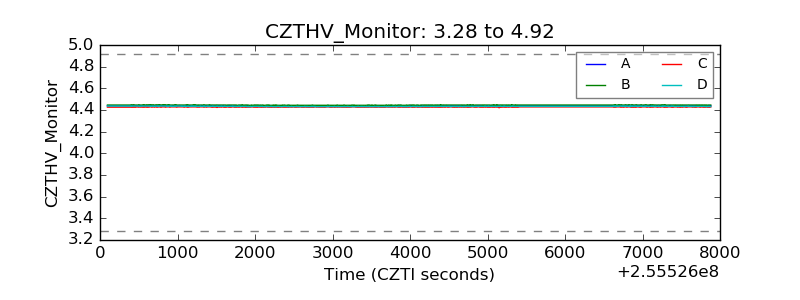 |
| D_VDD | 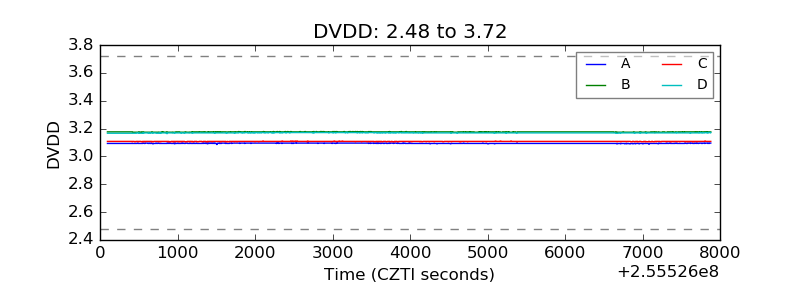 |
| Temperature 1 | 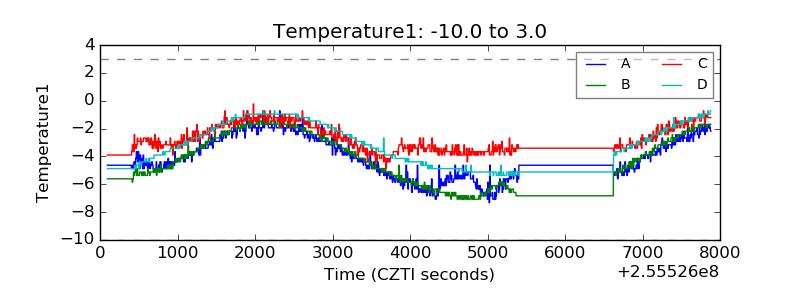 |
| Veto HV Monitor | 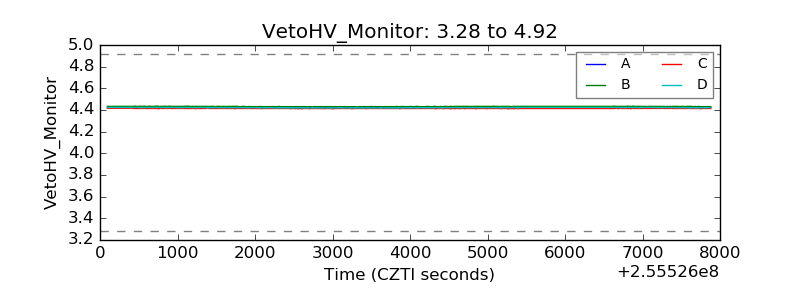 |
| Veto LLD | 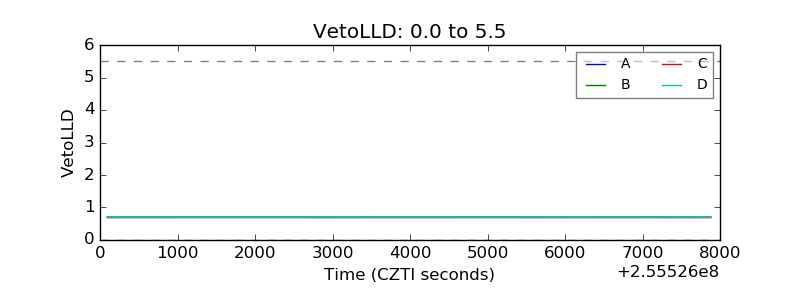 |
| Alpha Counter | 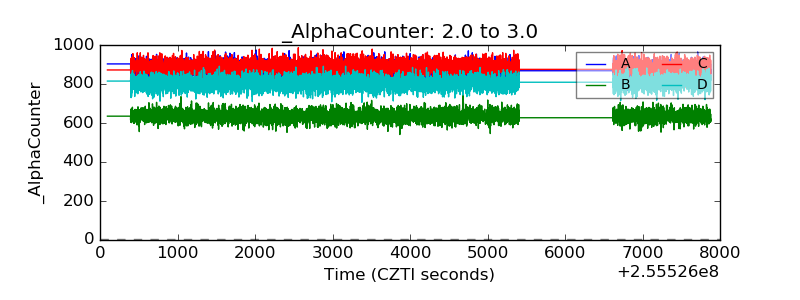 |
| _CPM_Rate | 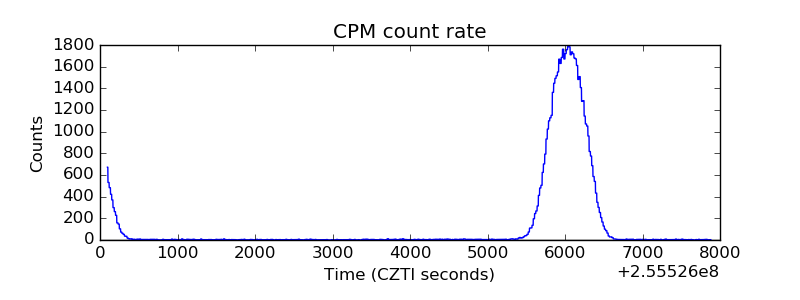 |
| CZT Counter | 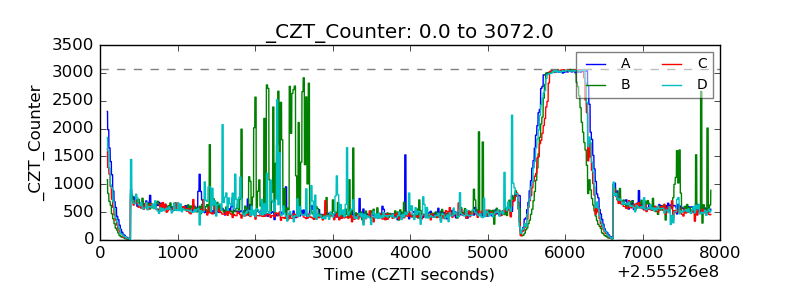 |
| +2.5 Volts monitor |  |
| +5 Volts monitor |  |
| _ROLL_ROT | 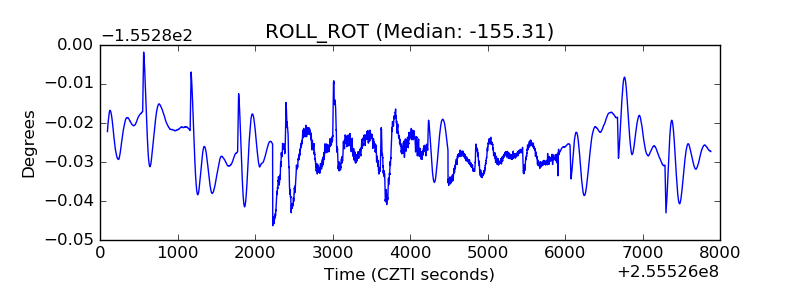 |
| _Roll_DEC | 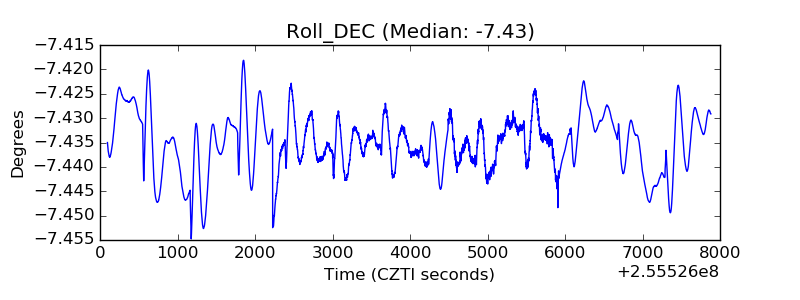 |
| _Roll_RA | 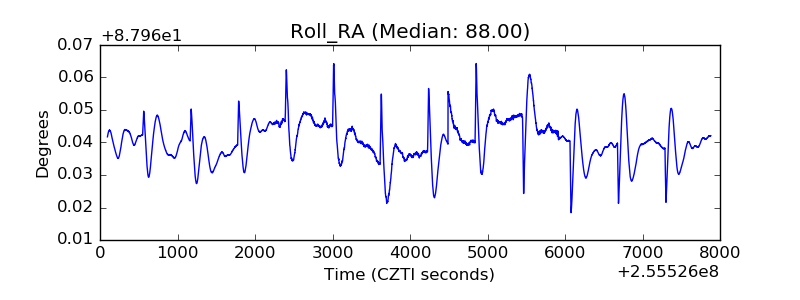 |
| Veto Counter | 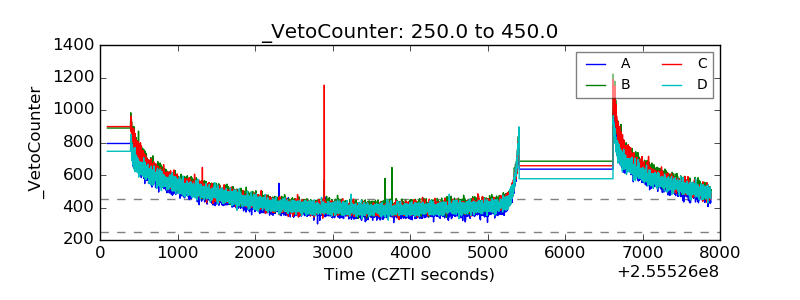 |