| Param | Original file | Final file |
|---|---|---|
| Filename | modeM0/AS1A04_044T01_9000001882_12754cztM0_level2.evt | modeM0/AS1A04_044T01_9000001882_12754cztM0_level2_quad_clean.evt |
| Size (bytes) | 555,865,920 | 93,038,400 |
| Size | 530.1 MB | 88.7 MB |
| Events in quadrant A | 3,977,920 | 590,271 |
| Events in quadrant B | 4,494,493 | 577,379 |
| Events in quadrant C | 3,282,568 | 603,394 |
| Events in quadrant D | 4,610,121 | 564,064 |
| Mode M0 | |||
|---|---|---|---|
| Quadrant | BADHDUFLAG | Total packets | Discarded packets |
| A | 0 | 16557 | 3 |
| B | 0 | 17901 | 2 |
| C | 0 | 14555 | 2 |
| D | 0 | 18657 | 2 |
| Mode M9 | |||
|---|---|---|---|
| Quadrant | BADHDUFLAG | Total packets | Discarded packets |
| A | 0 | 14 | 0 |
| B | 0 | 14 | 0 |
| C | 0 | 14 | 0 |
| D | 0 | 15 | 0 |
| Mode SS | |||
|---|---|---|---|
| Quadrant | BADHDUFLAG | Total packets | Discarded packets |
| A | 0 | 140 | 0 |
| B | 0 | 140 | 0 |
| C | 0 | 140 | 0 |
| D | 0 | 140 | 0 |
| Quadrant | Total seconds | Saturated seconds | Saturation percentage |
|---|---|---|---|
| A | 6922 | 114 | 1.646923% |
| B | 6922 | 461 | 6.659925% |
| C | 6922 | 66 | 0.953482% |
| D | 6922 | 358 | 5.171916% |
Noise dominated data is calculated using 1-second bins in cleaned event files. If a bin has >2000 counts, and if more than 50% of those come from <1% of pixels, then it is considered to be noise-dominated and hence unusable.
| Quadrant | # 1 sec bins | Bins with >0 counts | Bins with >2000 counts | High rate bins dominated by noise | Noise dominated (total time) | Noise dominated (detector-on time) | Marked lightcurve |
|---|---|---|---|---|---|---|---|
| A | 7773 | 6924 | 0 | 0 | 0.00% | 0.00% | 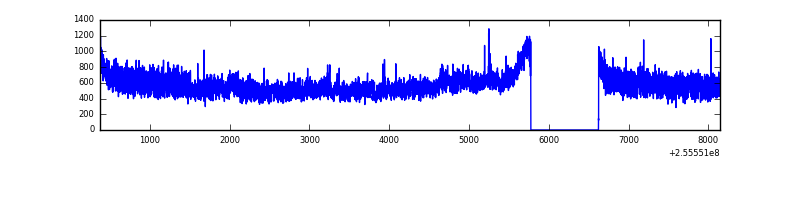 |
| B | 7773 | 6924 | 255 | 255 | 3.28% | 3.68% | 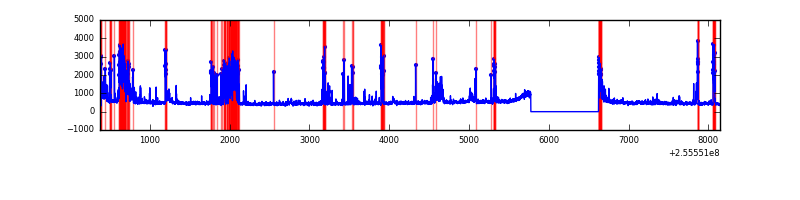 |
| C | 7773 | 6924 | 1 | 1 | 0.01% | 0.01% | 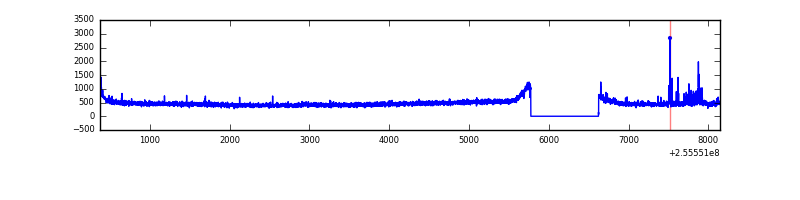 |
| D | 7773 | 6924 | 318 | 318 | 4.09% | 4.59% | 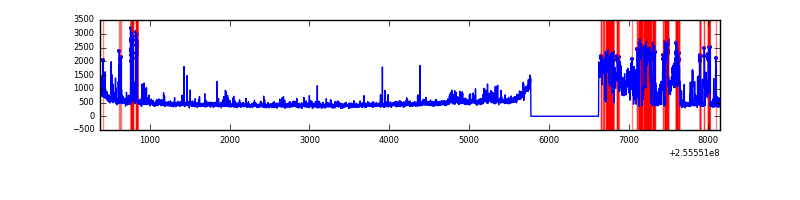 |
Top three noisy pixels from each quadrant. If the there are fewer than three noisy pixels in the level2.evt file, extra rows are filled as -1
| Pixel properties | Quadrant properties | ||||||
|---|---|---|---|---|---|---|---|
| Quadrant | DetID | PixID | Counts | Sigma | Mean | Median | Sigma |
| A | 0 | 23 | 550895 | 3222.16 | 839 | 821 | 170.7 |
| A | 15 | 222 | 149483 | 870.81 | 839 | 821 | 170.7 |
| A | 0 | 226 | 42428 | 243.72 | 839 | 821 | 170.7 |
| B | 4 | 239 | 1128366 | 7162.81 | 820 | 800 | 157.4 |
| B | 3 | 64 | 41554 | 258.89 | 820 | 800 | 157.4 |
| B | 0 | 214 | 23749 | 145.78 | 820 | 800 | 157.4 |
| C | 15 | 208 | 108101 | 563.23 | 814 | 820 | 190.5 |
| C | 13 | 61 | 5964 | 27.01 | 814 | 820 | 190.5 |
| C | 3 | 202 | 1971 | 6.04 | 814 | 820 | 190.5 |
| D | 1 | 52 | 1465350 | 7506.15 | 803 | 781 | 195.1 |
| D | 2 | 136 | 35907 | 180.03 | 803 | 781 | 195.1 |
| D | 8 | 195 | 33177 | 166.03 | 803 | 781 | 195.1 |
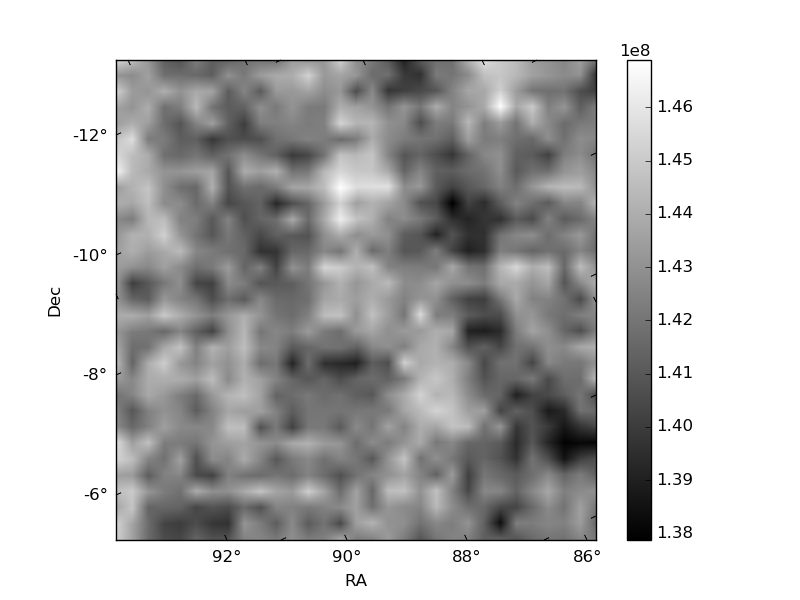
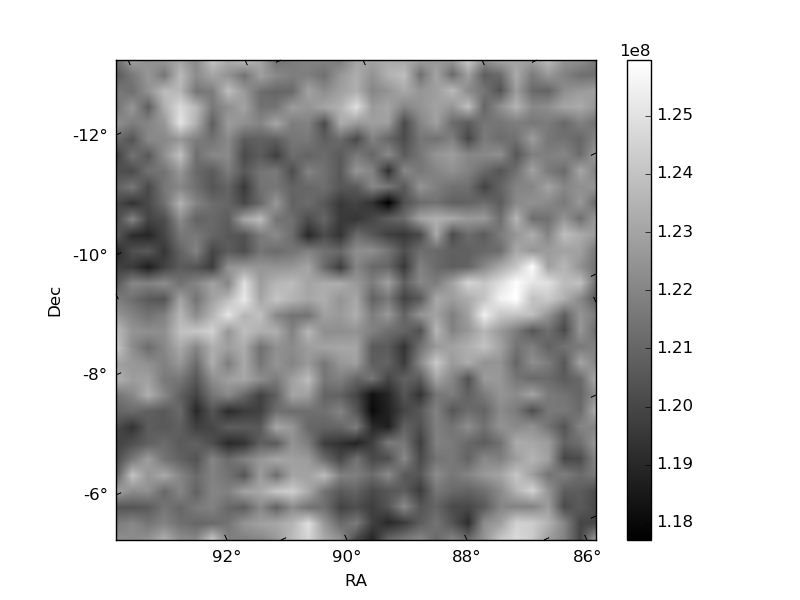
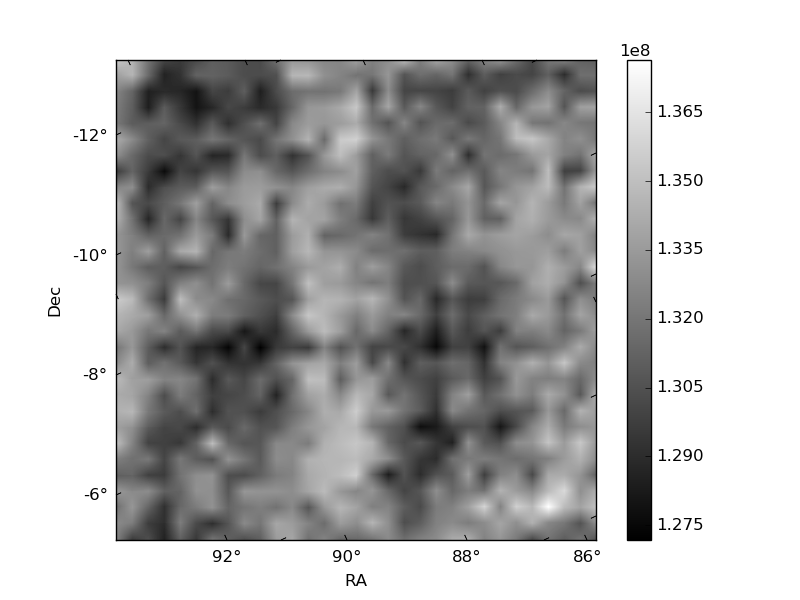
Histogram calculated using DETX and DETY for each event in the final _common_clean file
| Quadrant A | 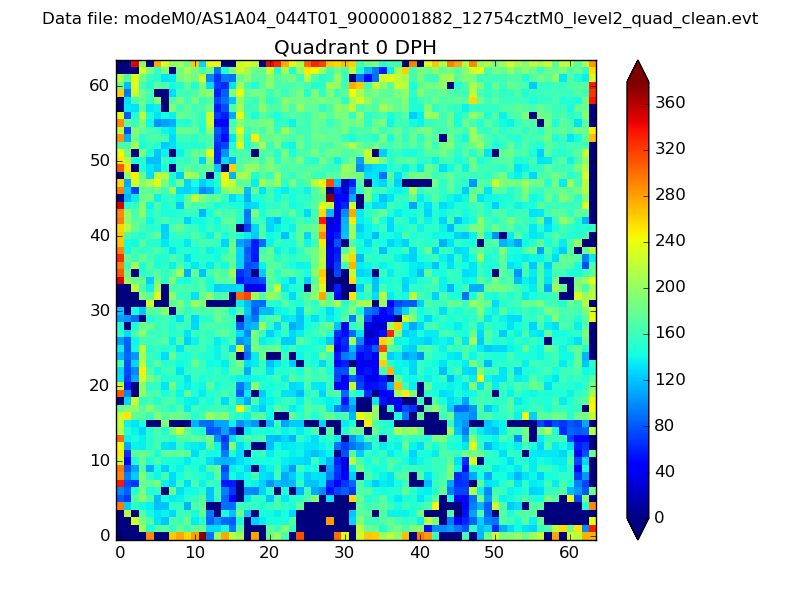 |
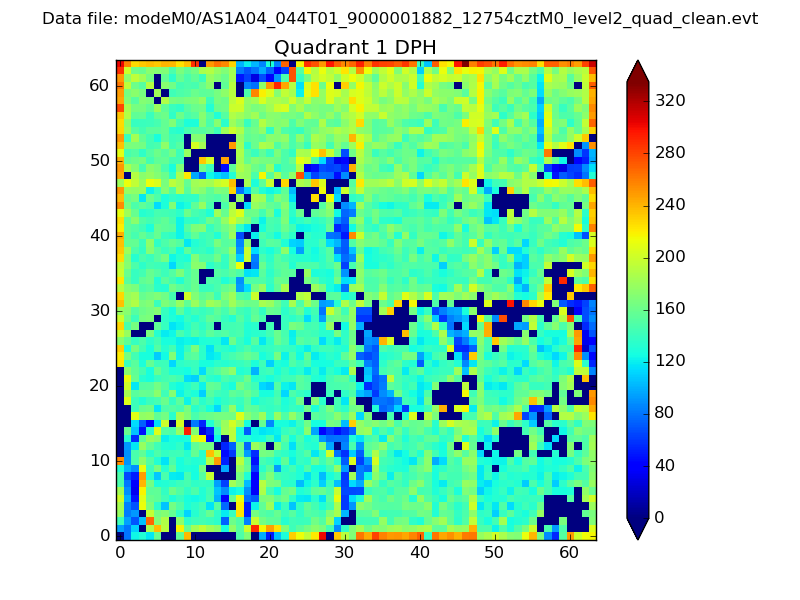 |
Quadrant B |
|---|---|---|---|
| Quadrant D | 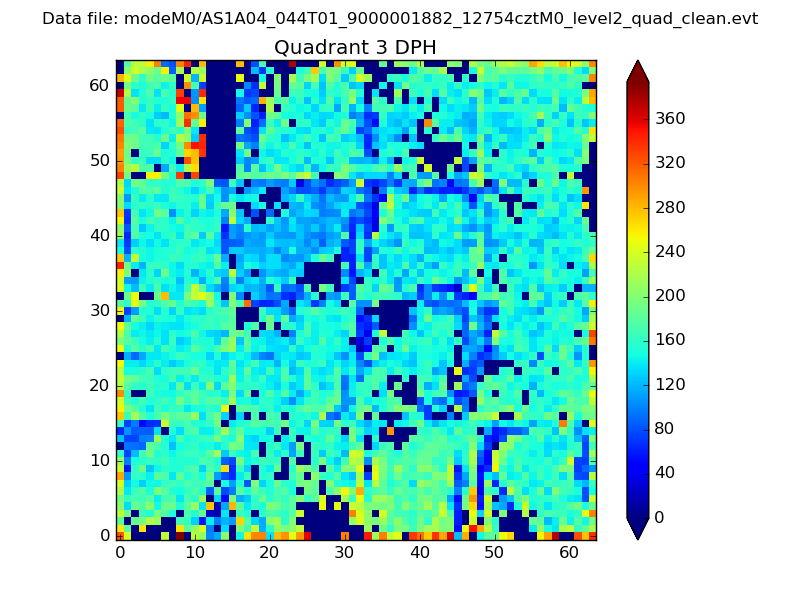 |
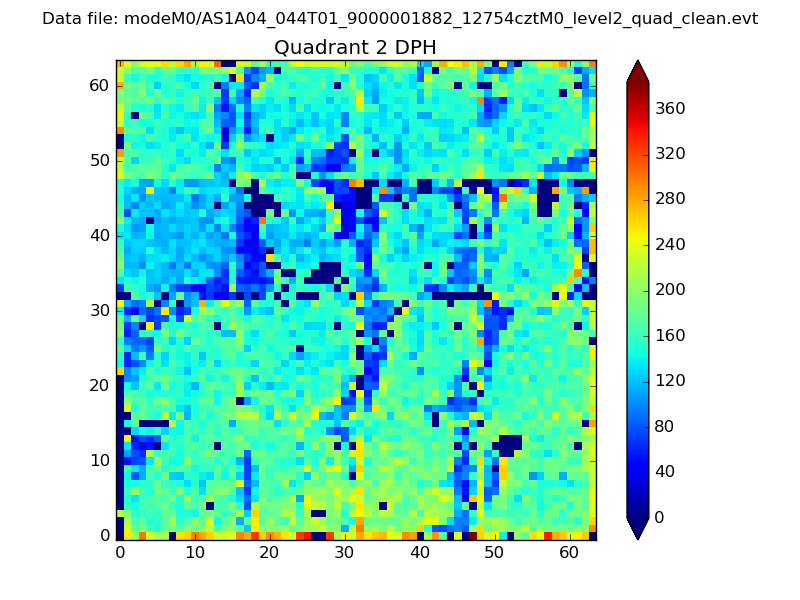 |
Quadrant C |
| Plot type | Count rate plots | Images |
|---|---|---|
| Comparison with Poisson distribution Blue bars denote a histogram of data divided into 1 sec bins. Red curve is a Poisson curve with rate = median count rate of data. |
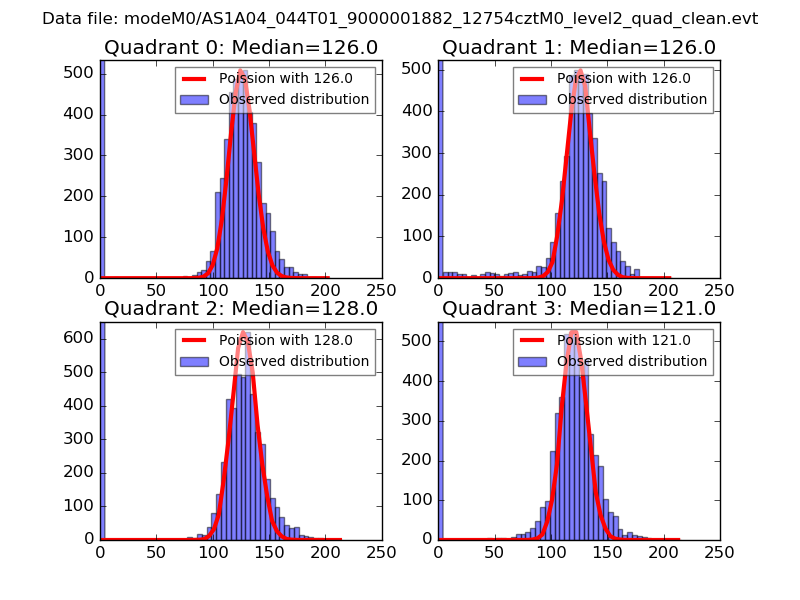 |
 |
| Quadrant-wise count rates Data is divided into 100 sec bins |
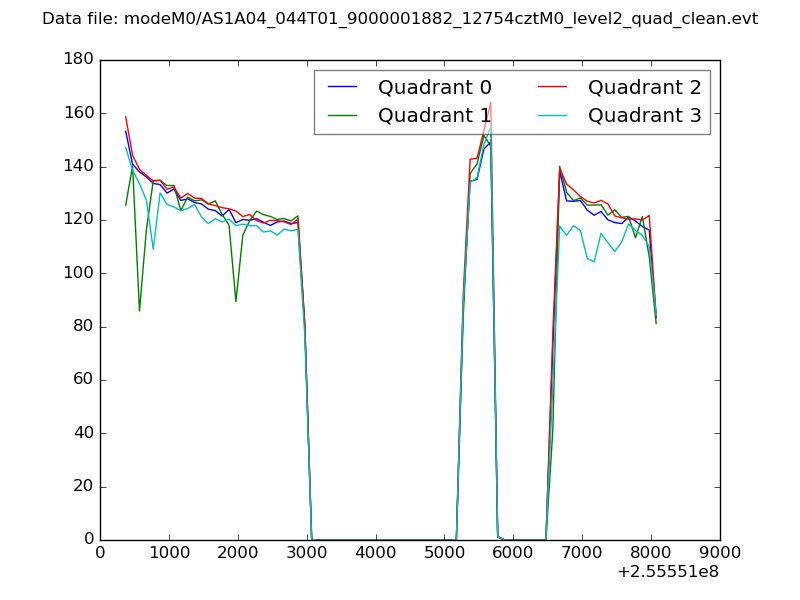 |
|
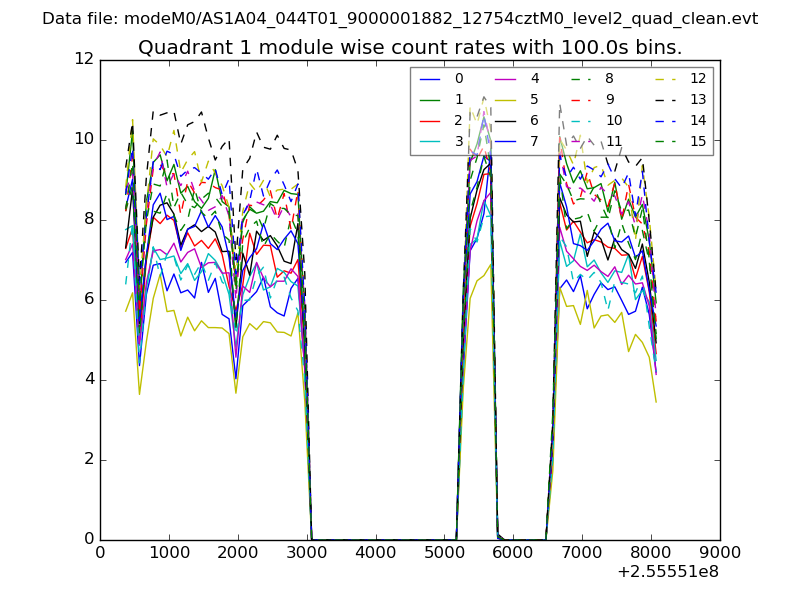
| Module-wise count rates for Quadrant A Data is divided into 100 sec bins |
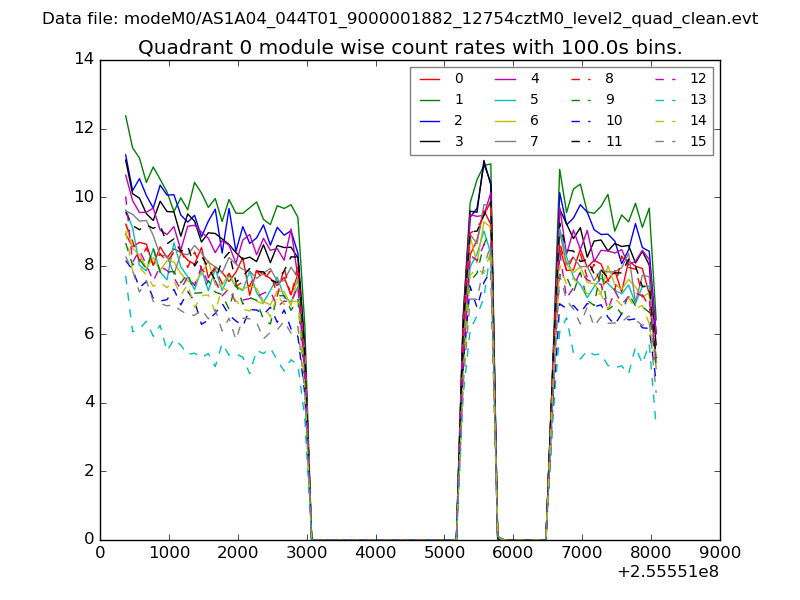 |
 |
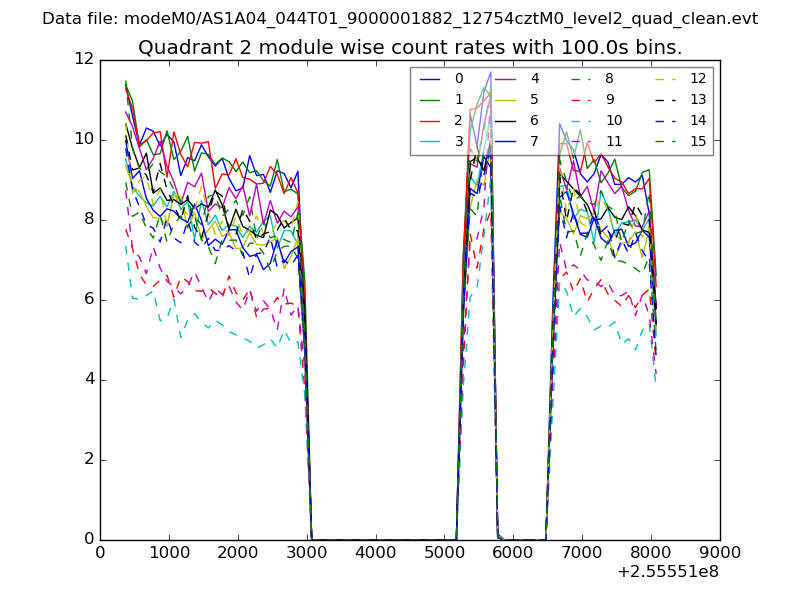
| Module-wise count rates for Quadrant B Data is divided into 100 sec bins |
 |
 |
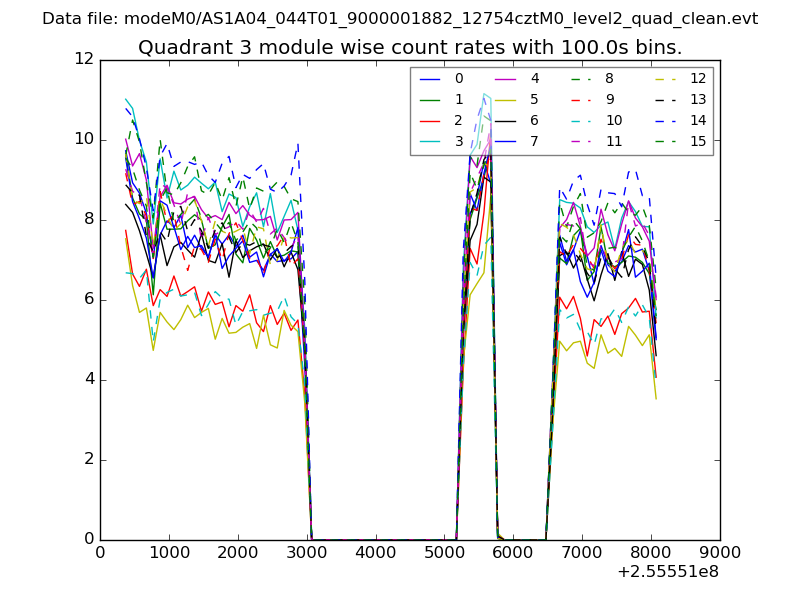
| Module-wise count rates for Quadrant C Data is divided into 100 sec bins |
 |
 |
| Module-wise count rates for Quadrant D Data is divided into 100 sec bins |
 |
 |
| Parameter | Plot |
|---|---|
| CZT HV Monitor | 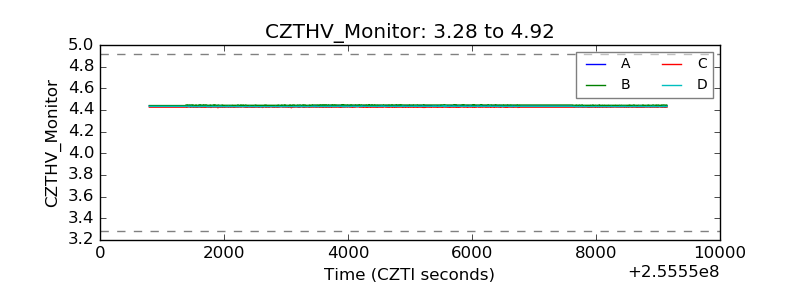 |
| D_VDD | 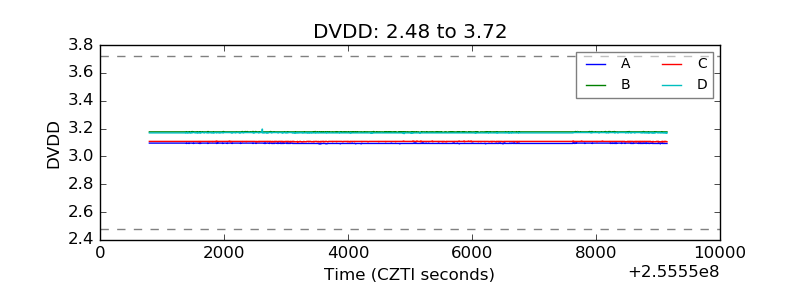 |
| Temperature 1 | 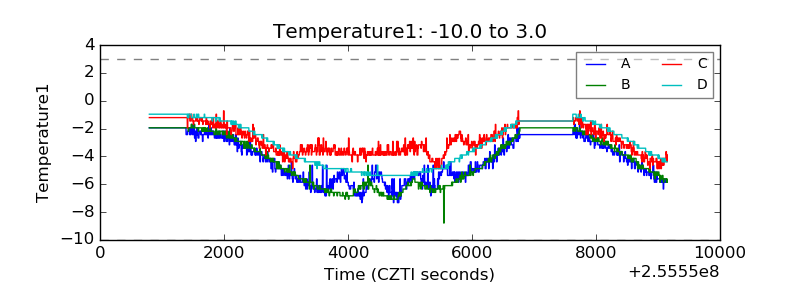 |
| Veto HV Monitor | 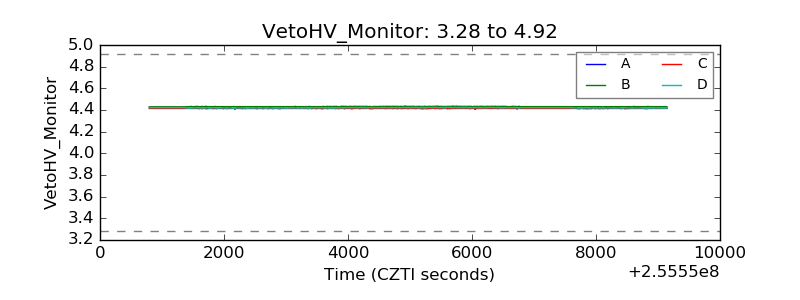 |
| Veto LLD | 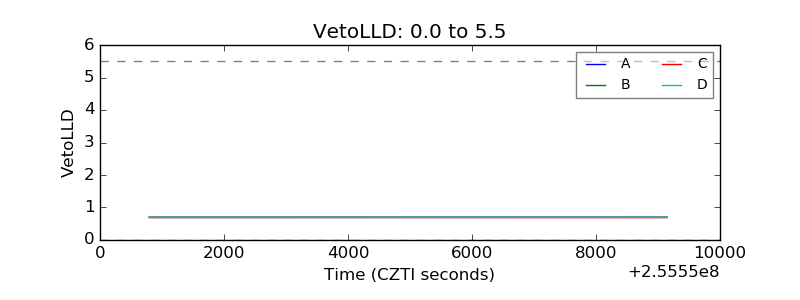 |
| Alpha Counter | 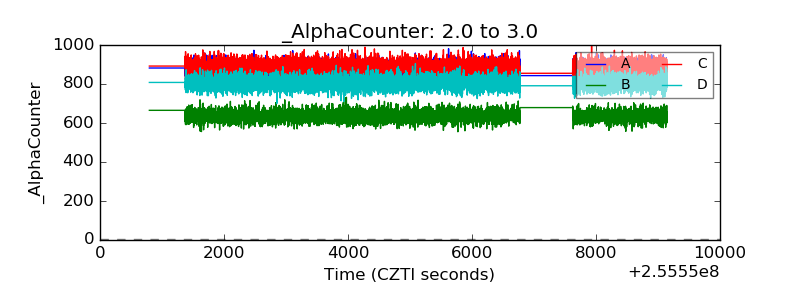 |
| _CPM_Rate | 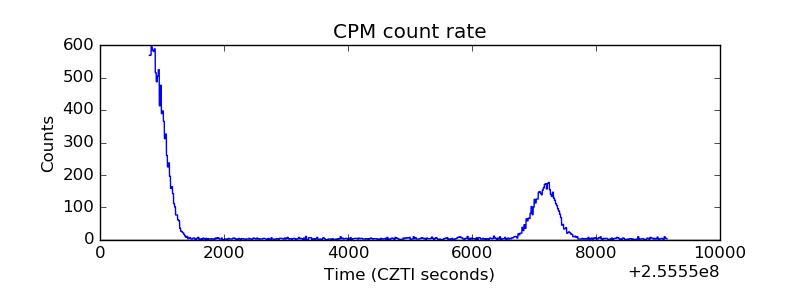 |
| CZT Counter | 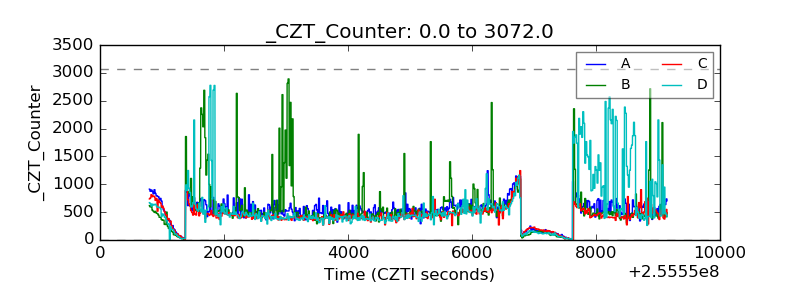 |
| +2.5 Volts monitor |  |
| +5 Volts monitor |  |
| _ROLL_ROT | 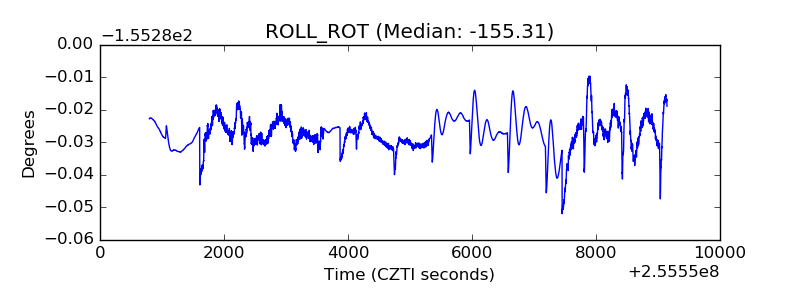 |
| _Roll_DEC | 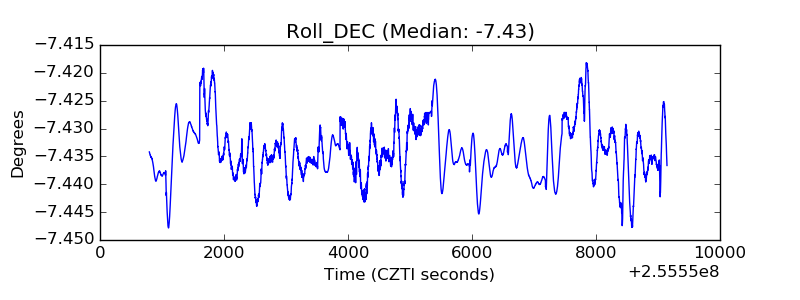 |
| _Roll_RA |  |
| Veto Counter | 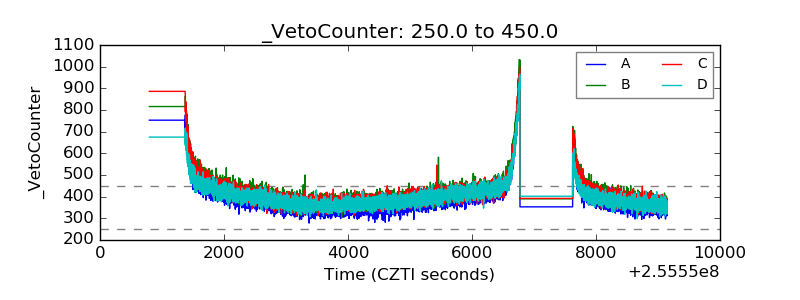 |