| Param | Original file | Final file |
|---|---|---|
| Filename | modeM0/AS1A04_044T01_9000001882_12755cztM0_level2.evt | modeM0/AS1A04_044T01_9000001882_12755cztM0_level2_quad_clean.evt |
| Size (bytes) | 648,996,480 | 93,692,160 |
| Size | 618.9 MB | 89.4 MB |
| Events in quadrant A | 3,951,583 | 599,254 |
| Events in quadrant B | 4,629,793 | 578,129 |
| Events in quadrant C | 4,015,848 | 611,104 |
| Events in quadrant D | 6,576,160 | 552,660 |
| Mode M0 | |||
|---|---|---|---|
| Quadrant | BADHDUFLAG | Total packets | Discarded packets |
| A | 0 | 16468 | 3 |
| B | 0 | 18432 | 2 |
| C | 0 | 16713 | 2 |
| D | 0 | 24558 | 2 |
| Mode M9 | |||
|---|---|---|---|
| Quadrant | BADHDUFLAG | Total packets | Discarded packets |
| A | 0 | 7 | 0 |
| B | 0 | 7 | 0 |
| C | 0 | 7 | 0 |
| D | 0 | 8 | 0 |
| Mode SS | |||
|---|---|---|---|
| Quadrant | BADHDUFLAG | Total packets | Discarded packets |
| A | 0 | 144 | 0 |
| B | 0 | 144 | 0 |
| C | 0 | 144 | 0 |
| D | 0 | 144 | 0 |
| Quadrant | Total seconds | Saturated seconds | Saturation percentage |
|---|---|---|---|
| A | 7121 | 33 | 0.463418% |
| B | 7121 | 498 | 6.993400% |
| C | 7121 | 131 | 1.839629% |
| D | 7121 | 619 | 8.692599% |
Noise dominated data is calculated using 1-second bins in cleaned event files. If a bin has >2000 counts, and if more than 50% of those come from <1% of pixels, then it is considered to be noise-dominated and hence unusable.
| Quadrant | # 1 sec bins | Bins with >0 counts | Bins with >2000 counts | High rate bins dominated by noise | Noise dominated (total time) | Noise dominated (detector-on time) | Marked lightcurve |
|---|---|---|---|---|---|---|---|
| A | 7662 | 7123 | 0 | 0 | 0.00% | 0.00% | 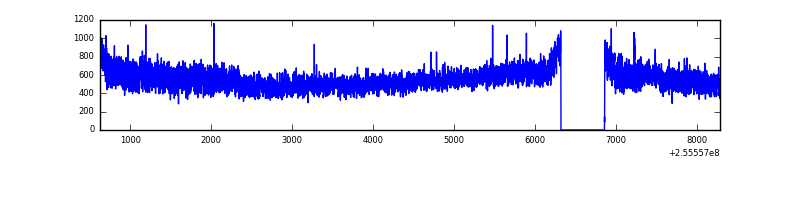 |
| B | 7662 | 7123 | 325 | 325 | 4.24% | 4.56% | 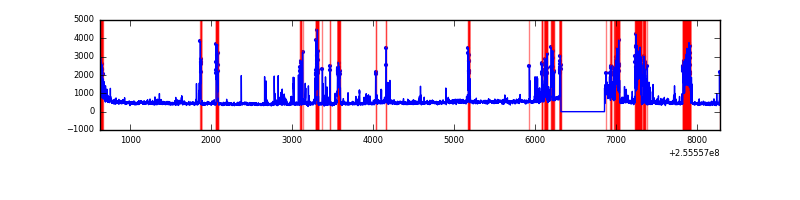 |
| C | 7662 | 7123 | 144 | 144 | 1.88% | 2.02% | 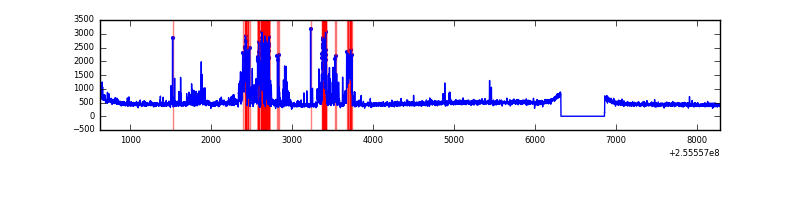 |
| D | 7662 | 7123 | 606 | 606 | 7.91% | 8.51% | 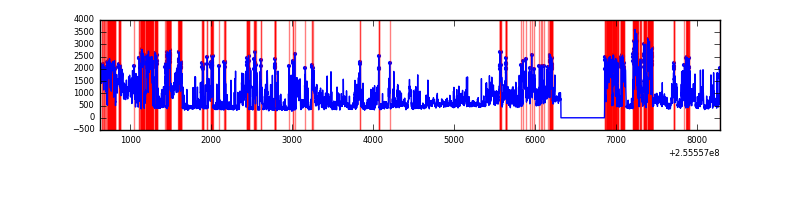 |
Top three noisy pixels from each quadrant. If the there are fewer than three noisy pixels in the level2.evt file, extra rows are filled as -1
| Pixel properties | Quadrant properties | ||||||
|---|---|---|---|---|---|---|---|
| Quadrant | DetID | PixID | Counts | Sigma | Mean | Median | Sigma |
| A | 0 | 23 | 565838 | 3279.46 | 841 | 825 | 172.3 |
| A | 15 | 222 | 88689 | 509.98 | 841 | 825 | 172.3 |
| A | 0 | 226 | 43164 | 245.74 | 841 | 825 | 172.3 |
| B | 4 | 239 | 1302532 | 8281.39 | 812 | 790 | 157.2 |
| B | 0 | 214 | 48442 | 303.15 | 812 | 790 | 157.2 |
| B | 0 | 197 | 33083 | 205.44 | 812 | 790 | 157.2 |
| C | 15 | 208 | 849460 | 4508.81 | 811 | 817 | 188.2 |
| C | 13 | 61 | 5898 | 27.0 | 811 | 817 | 188.2 |
| C | 14 | 234 | 4070 | 17.28 | 811 | 817 | 188.2 |
| D | 1 | 52 | 3290555 | 16816.62 | 796 | 772 | 195.6 |
| D | 8 | 195 | 126835 | 644.4 | 796 | 772 | 195.6 |
| D | 2 | 136 | 82588 | 418.22 | 796 | 772 | 195.6 |
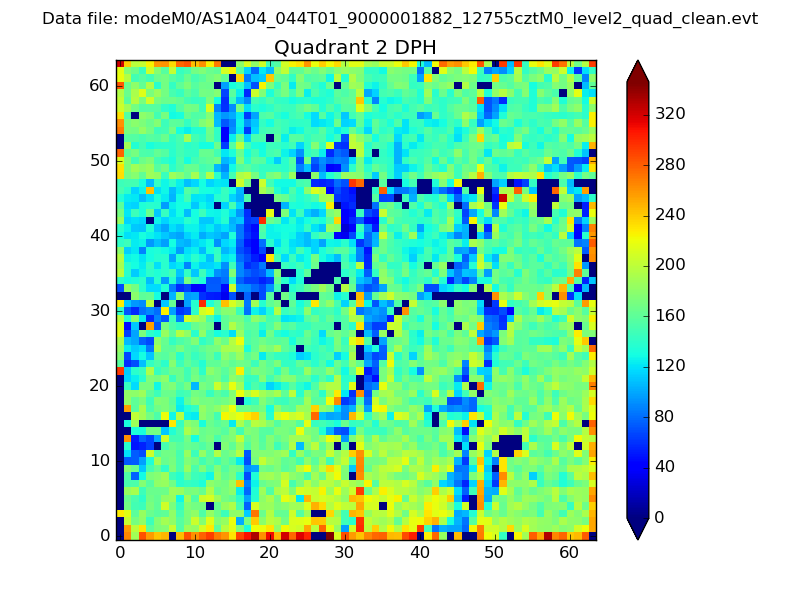
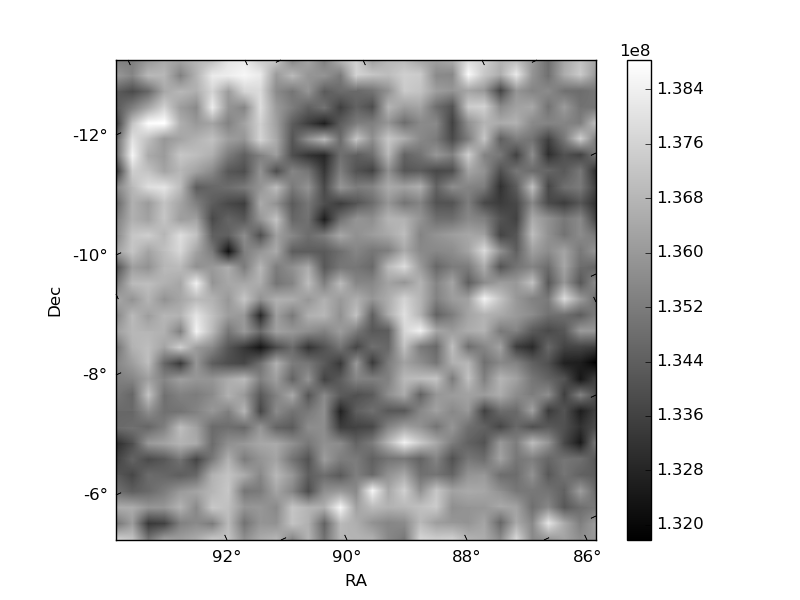
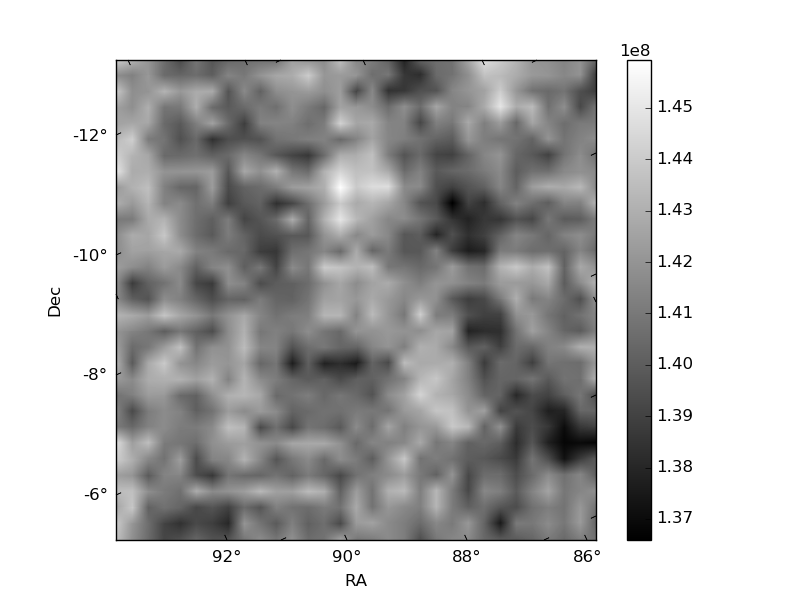
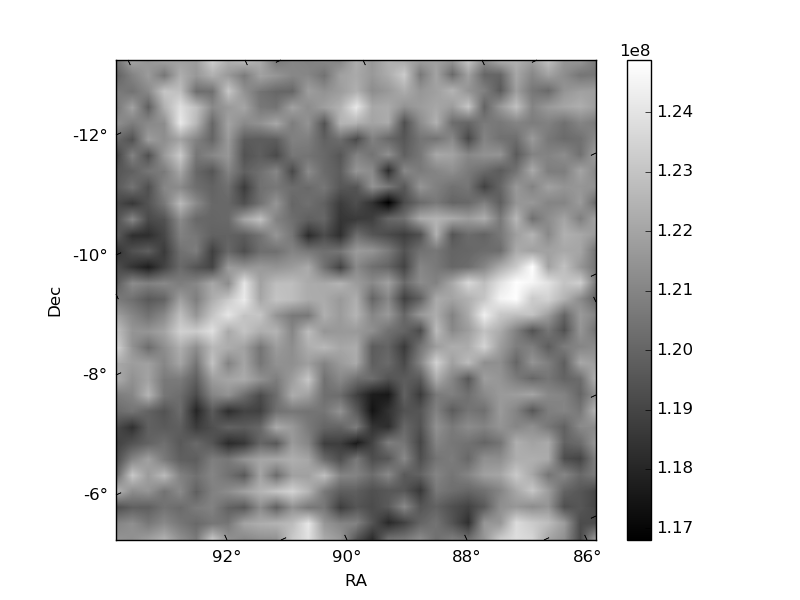
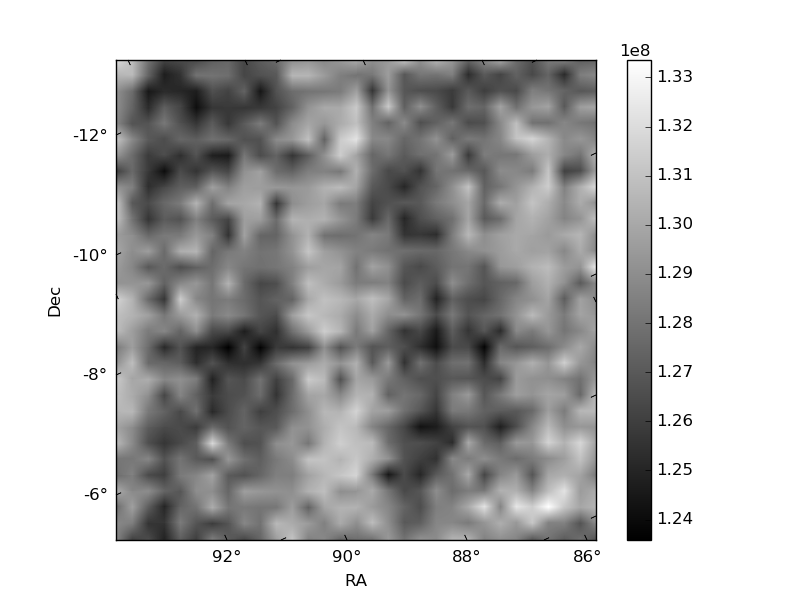
Histogram calculated using DETX and DETY for each event in the final _common_clean file
| Quadrant A | 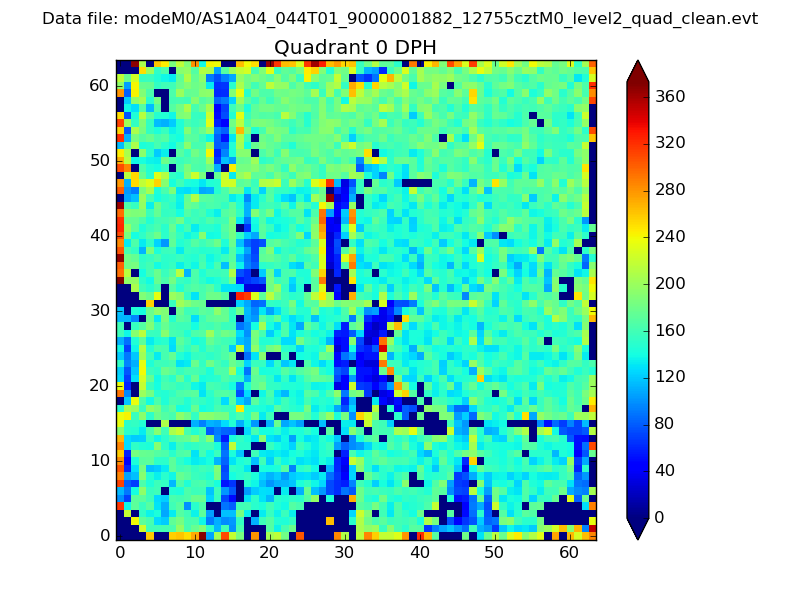 |
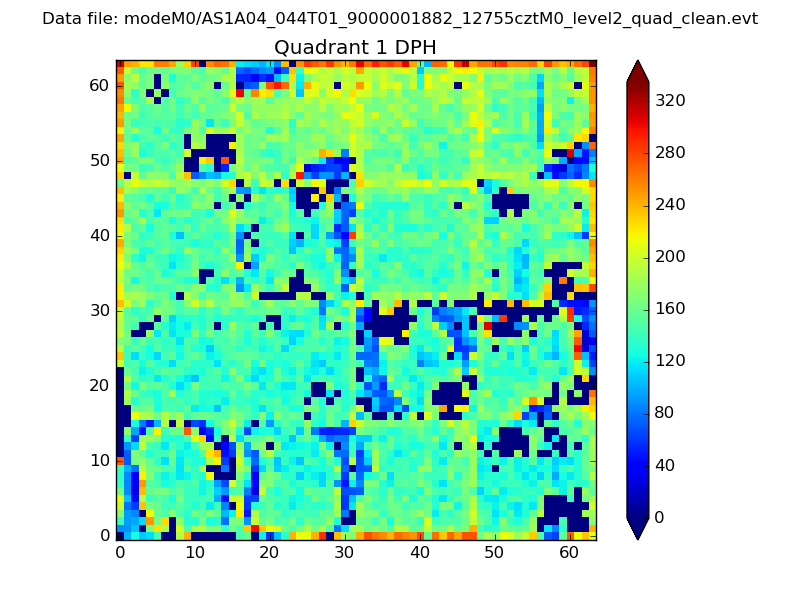 |
Quadrant B |
|---|---|---|---|
| Quadrant D | 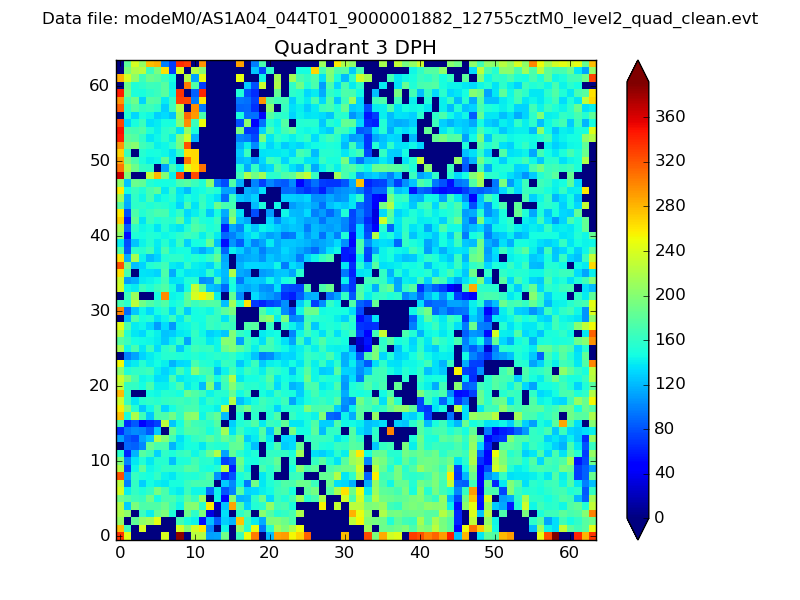 |
 |
Quadrant C |
| Plot type | Count rate plots | Images |
|---|---|---|
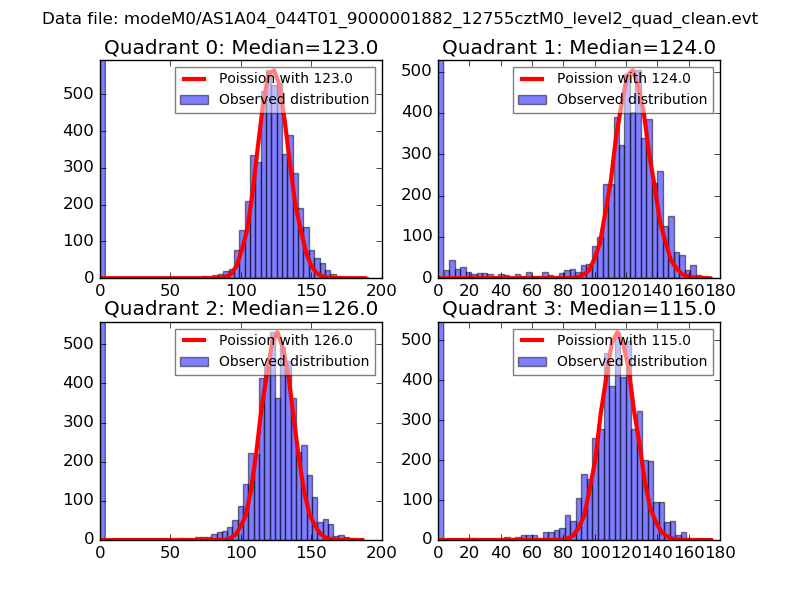
| Comparison with Poisson distribution Blue bars denote a histogram of data divided into 1 sec bins. Red curve is a Poisson curve with rate = median count rate of data. |
 |
 |
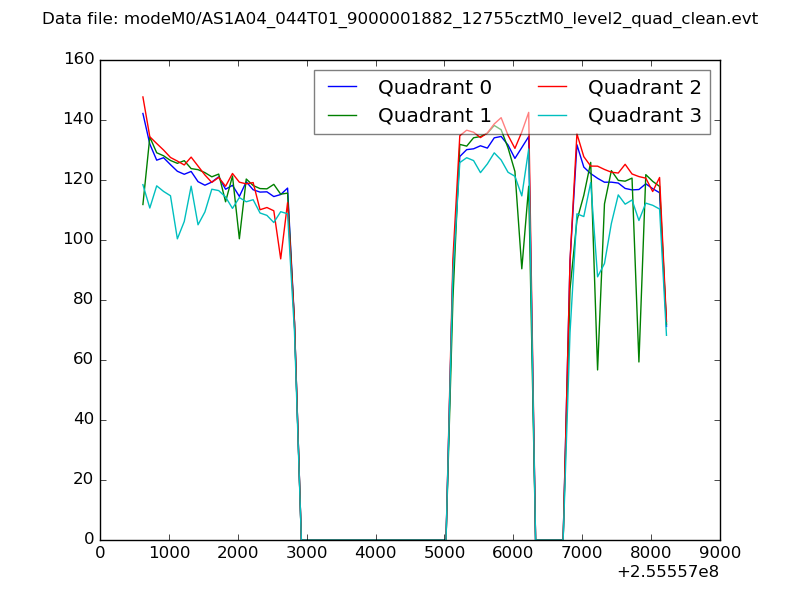
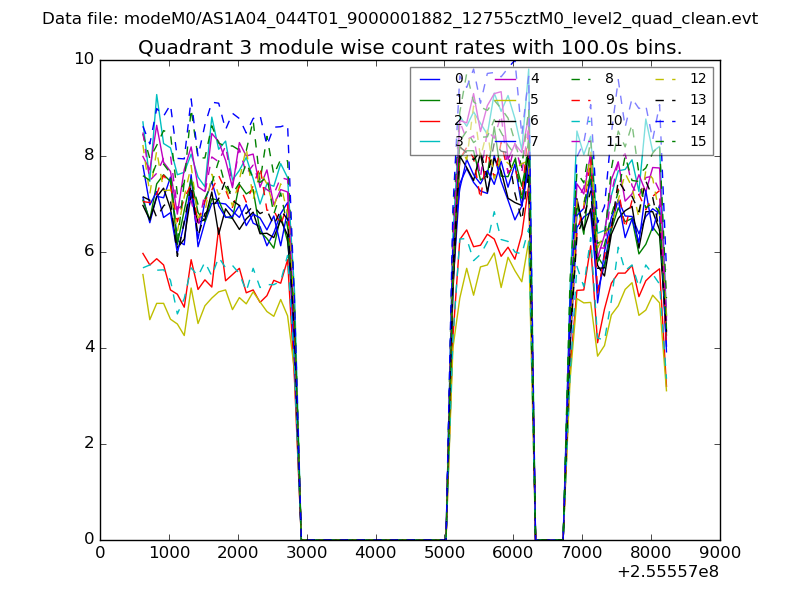
| Quadrant-wise count rates Data is divided into 100 sec bins |
 |
|
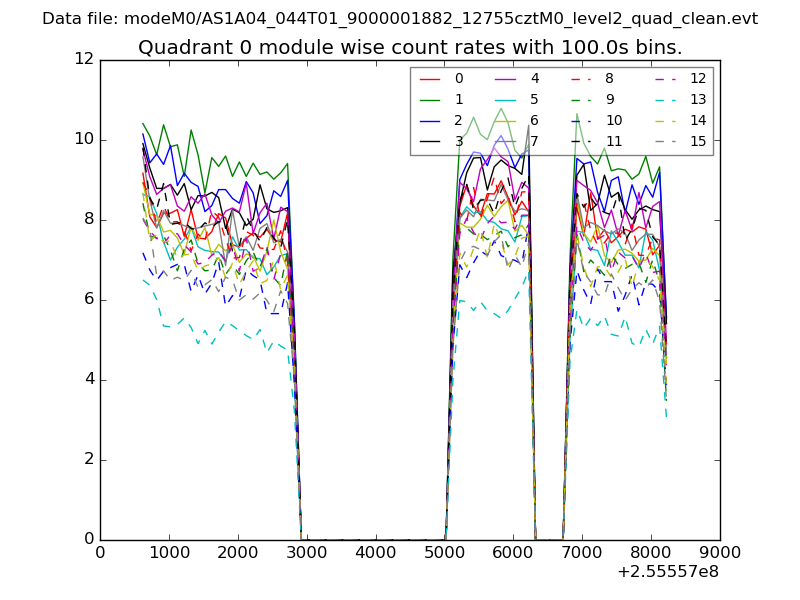
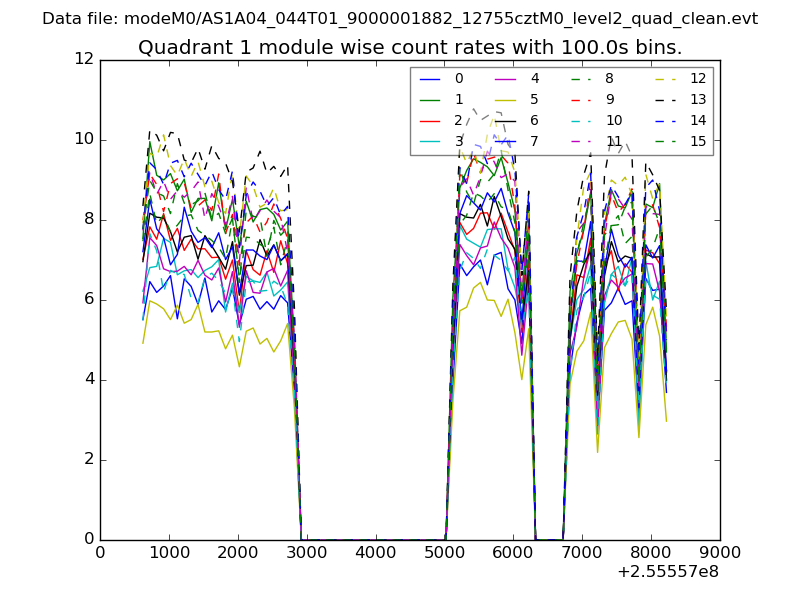
| Module-wise count rates for Quadrant A Data is divided into 100 sec bins |
 |
 |
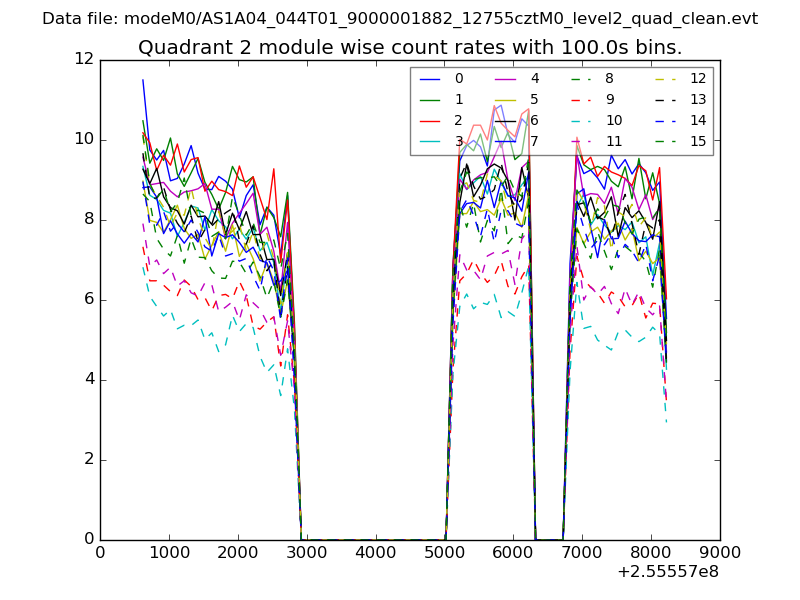
| Module-wise count rates for Quadrant B Data is divided into 100 sec bins |
 |
 |
| Module-wise count rates for Quadrant C Data is divided into 100 sec bins |
 |
 |
| Module-wise count rates for Quadrant D Data is divided into 100 sec bins |
 |
 |
| Parameter | Plot |
|---|---|
| CZT HV Monitor | 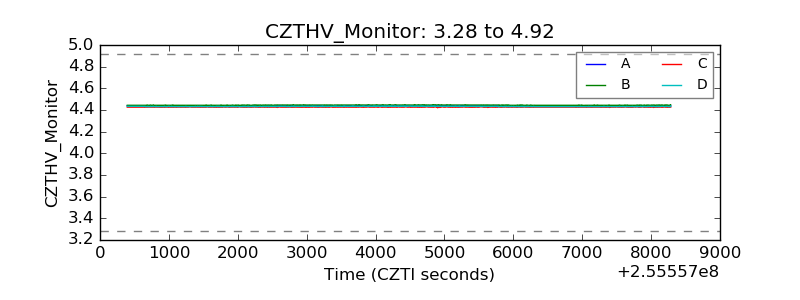 |
| D_VDD | 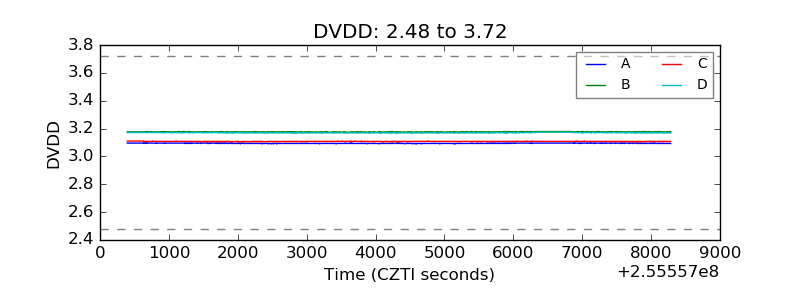 |
| Temperature 1 | 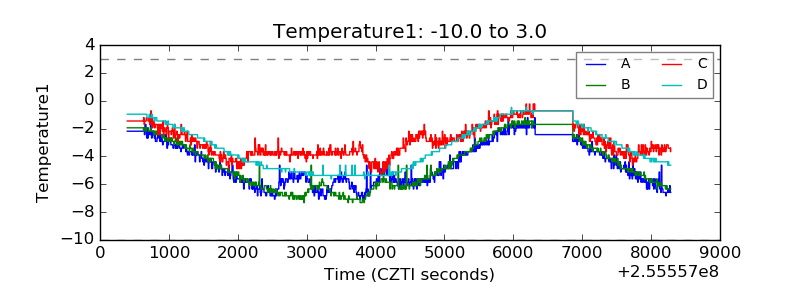 |
| Veto HV Monitor | 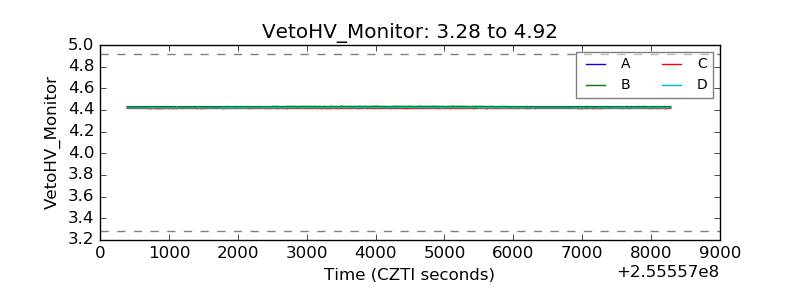 |
| Veto LLD | 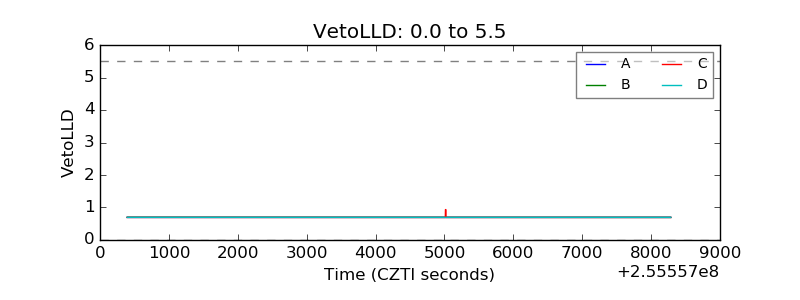 |
| Alpha Counter | 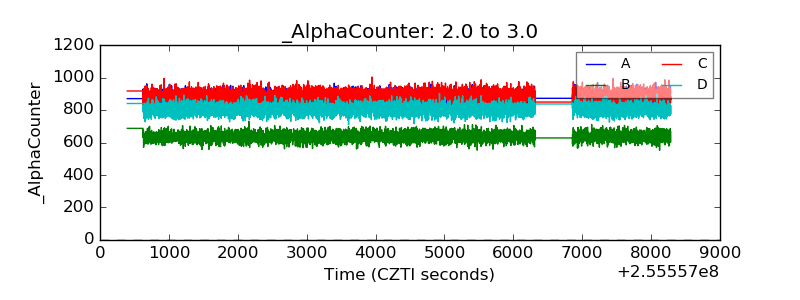 |
| _CPM_Rate | 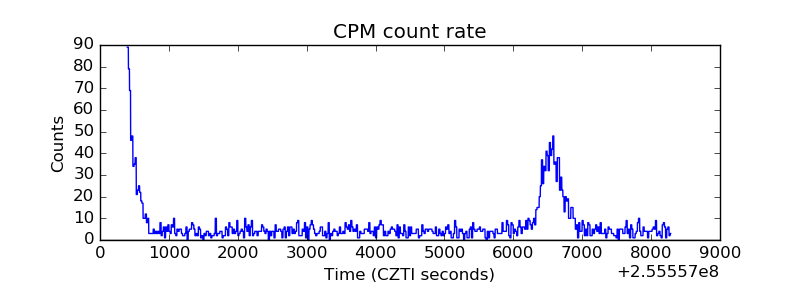 |
| CZT Counter | 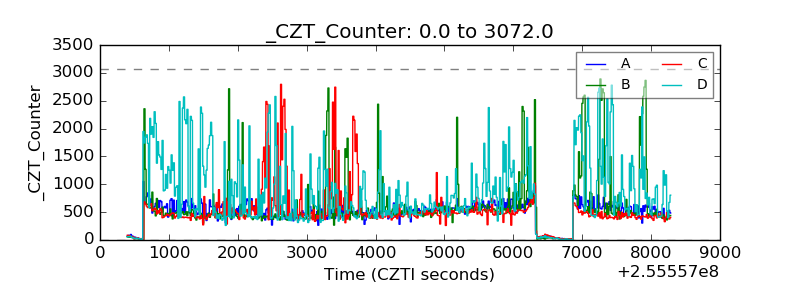 |
| +2.5 Volts monitor |  |
| +5 Volts monitor |  |
| _ROLL_ROT | 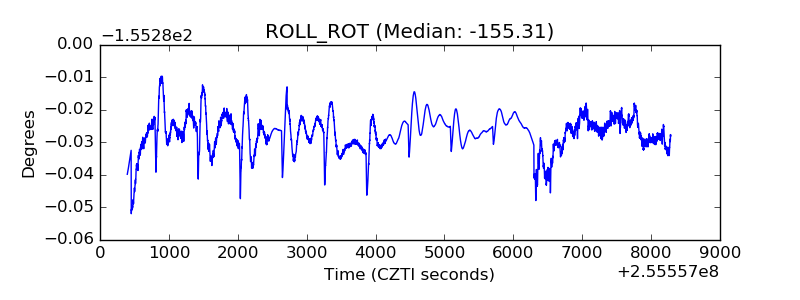 |
| _Roll_DEC | 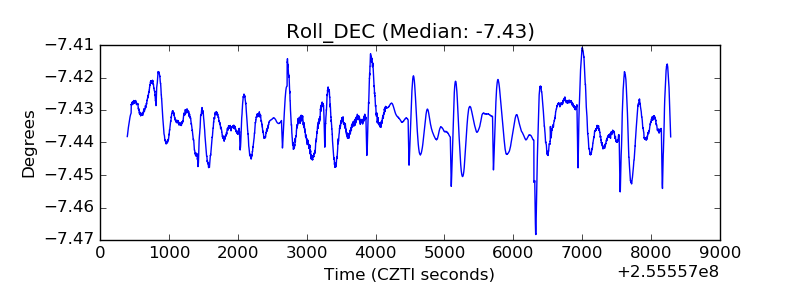 |
| _Roll_RA | 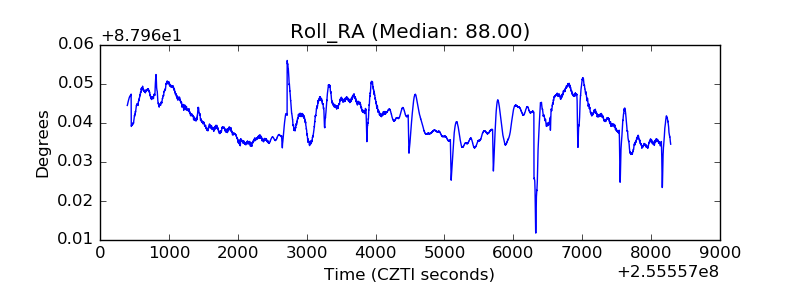 |
| Veto Counter | 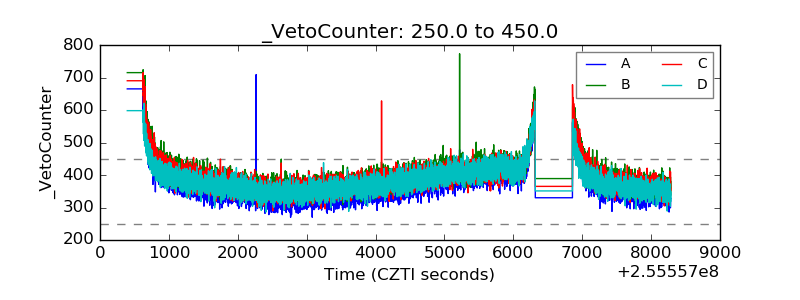 |