| Param | Original file | Final file |
|---|---|---|
| Filename | modeM0/AS1A04_044T01_9000001882_12756cztM0_level2.evt | modeM0/AS1A04_044T01_9000001882_12756cztM0_level2_quad_clean.evt |
| Size (bytes) | 768,643,200 | 109,584,000 |
| Size | 733.0 MB | 104.5 MB |
| Events in quadrant A | 4,784,303 | 707,075 |
| Events in quadrant B | 6,083,153 | 664,123 |
| Events in quadrant C | 4,867,023 | 719,877 |
| Events in quadrant D | 6,989,884 | 657,406 |
| Mode M0 | |||
|---|---|---|---|
| Quadrant | BADHDUFLAG | Total packets | Discarded packets |
| A | 0 | 19742 | 3 |
| B | 0 | 23526 | 2 |
| C | 0 | 19998 | 2 |
| D | 0 | 26391 | 2 |
| Mode M9 | |||
|---|---|---|---|
| Quadrant | BADHDUFLAG | Total packets | Discarded packets |
| A | 0 | 8 | 0 |
| B | 0 | 8 | 0 |
| C | 0 | 8 | 0 |
| D | 0 | 8 | 0 |
| Mode SS | |||
|---|---|---|---|
| Quadrant | BADHDUFLAG | Total packets | Discarded packets |
| A | 0 | 170 | 0 |
| B | 0 | 170 | 0 |
| C | 0 | 170 | 0 |
| D | 0 | 170 | 0 |
| Quadrant | Total seconds | Saturated seconds | Saturation percentage |
|---|---|---|---|
| A | 8192 | 68 | 0.830078% |
| B | 8192 | 914 | 11.157227% |
| C | 8192 | 298 | 3.637695% |
| D | 8192 | 594 | 7.250977% |
Noise dominated data is calculated using 1-second bins in cleaned event files. If a bin has >2000 counts, and if more than 50% of those come from <1% of pixels, then it is considered to be noise-dominated and hence unusable.
| Quadrant | # 1 sec bins | Bins with >0 counts | Bins with >2000 counts | High rate bins dominated by noise | Noise dominated (total time) | Noise dominated (detector-on time) | Marked lightcurve |
|---|---|---|---|---|---|---|---|
| A | 9052 | 8194 | 1 | 1 | 0.01% | 0.01% | 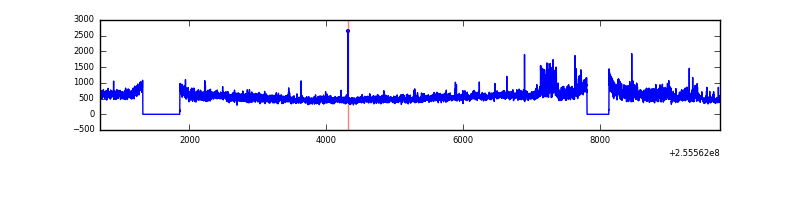 |
| B | 9052 | 8194 | 592 | 592 | 6.54% | 7.22% |  |
| C | 9052 | 8194 | 275 | 275 | 3.04% | 3.36% |  |
| D | 9052 | 8194 | 555 | 555 | 6.13% | 6.77% | 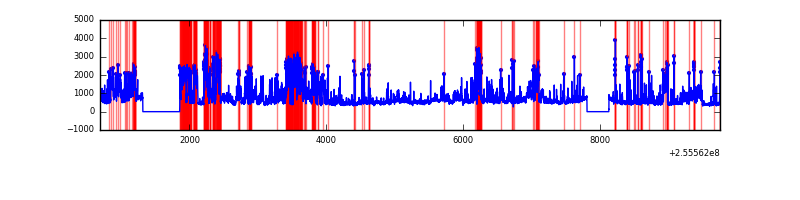 |
Top three noisy pixels from each quadrant. If the there are fewer than three noisy pixels in the level2.evt file, extra rows are filled as -1
| Pixel properties | Quadrant properties | ||||||
|---|---|---|---|---|---|---|---|
| Quadrant | DetID | PixID | Counts | Sigma | Mean | Median | Sigma |
| A | 0 | 23 | 566798 | 2840.44 | 972 | 949 | 199.2 |
| A | 15 | 222 | 369020 | 1847.64 | 972 | 949 | 199.2 |
| A | 0 | 226 | 45073 | 221.49 | 972 | 949 | 199.2 |
| B | 4 | 239 | 2276294 | 12818.87 | 919 | 895 | 177.5 |
| B | 0 | 214 | 51193 | 283.36 | 919 | 895 | 177.5 |
| B | 0 | 197 | 39783 | 219.08 | 919 | 895 | 177.5 |
| C | 15 | 208 | 1229796 | 5633.03 | 933 | 936 | 218.2 |
| C | 13 | 61 | 6763 | 26.71 | 933 | 936 | 218.2 |
| C | 3 | 202 | 2328 | 6.38 | 933 | 936 | 218.2 |
| D | 1 | 52 | 2818283 | 12447.29 | 918 | 889 | 226.3 |
| D | 10 | 199 | 240082 | 1056.76 | 918 | 889 | 226.3 |
| D | 2 | 136 | 197358 | 868.0 | 918 | 889 | 226.3 |
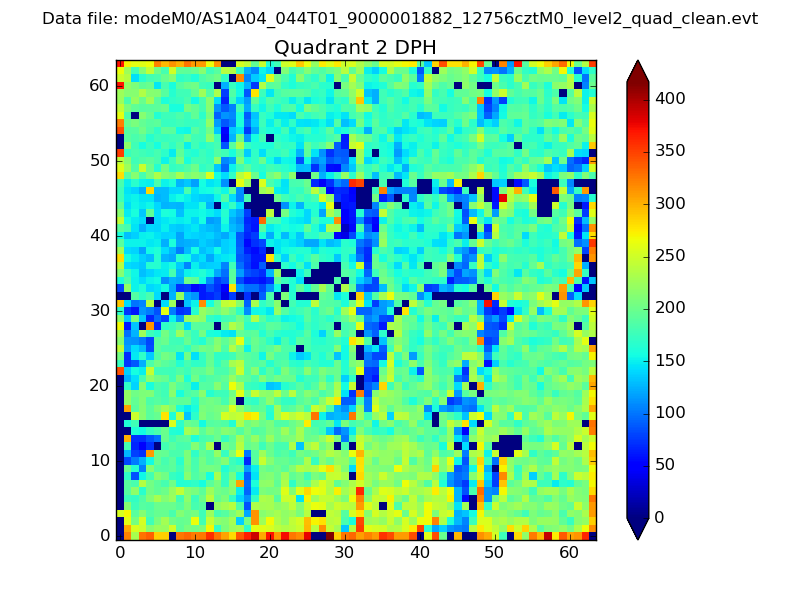
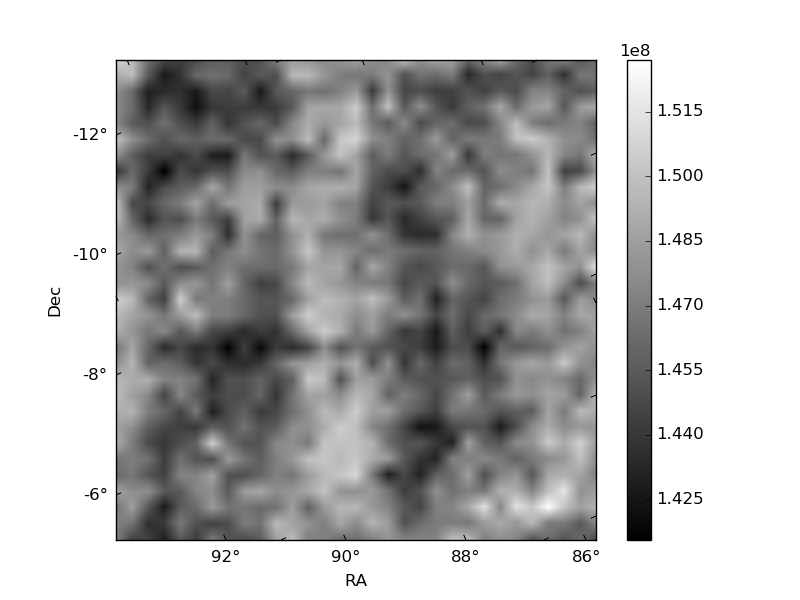
Histogram calculated using DETX and DETY for each event in the final _common_clean file
| Quadrant A | 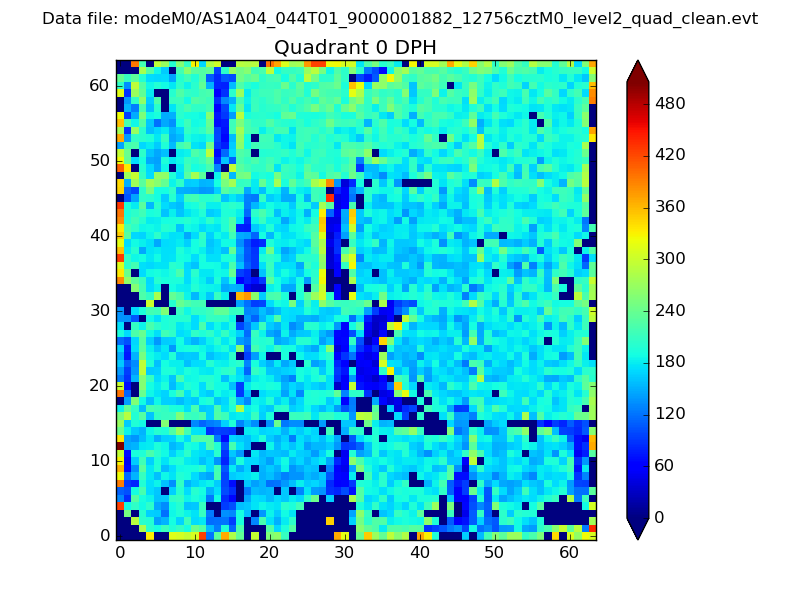 |
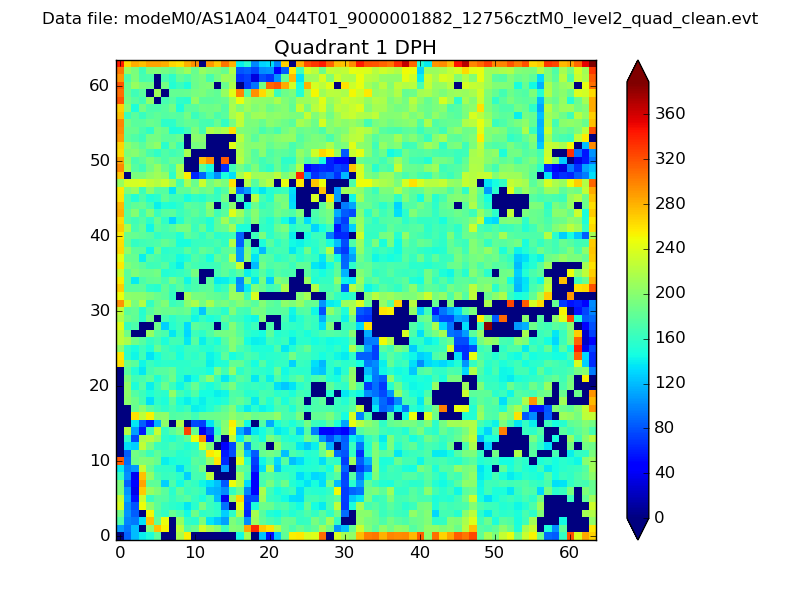 |
Quadrant B |
|---|---|---|---|
| Quadrant D | 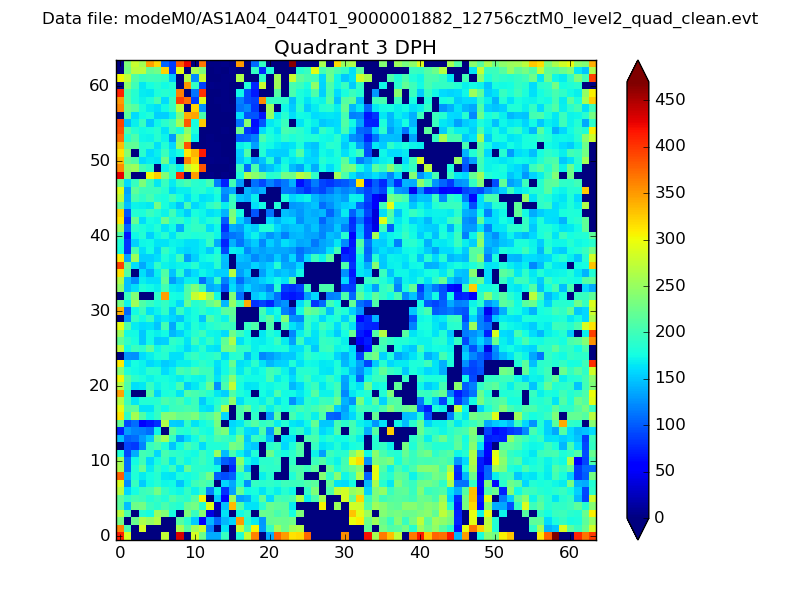 |
 |
Quadrant C |
| Plot type | Count rate plots | Images |
|---|---|---|
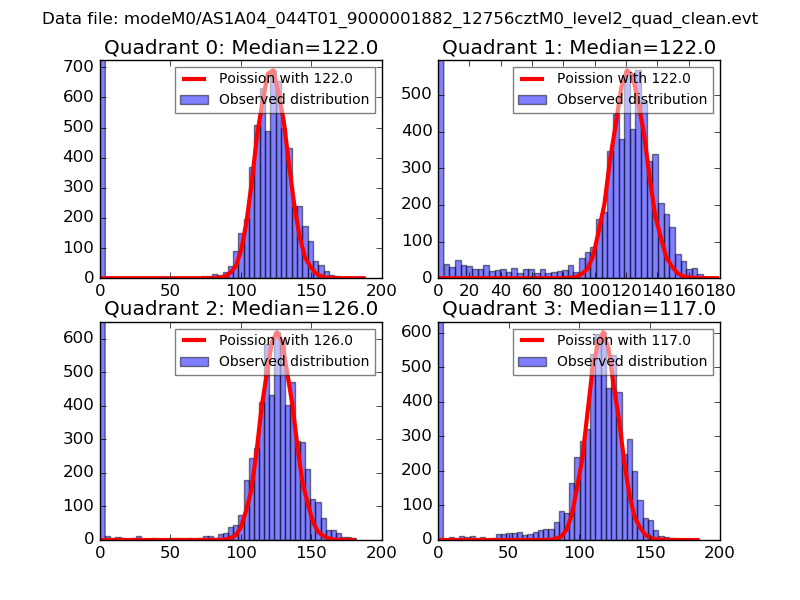
| Comparison with Poisson distribution Blue bars denote a histogram of data divided into 1 sec bins. Red curve is a Poisson curve with rate = median count rate of data. |
 |
 |
| Quadrant-wise count rates Data is divided into 100 sec bins |
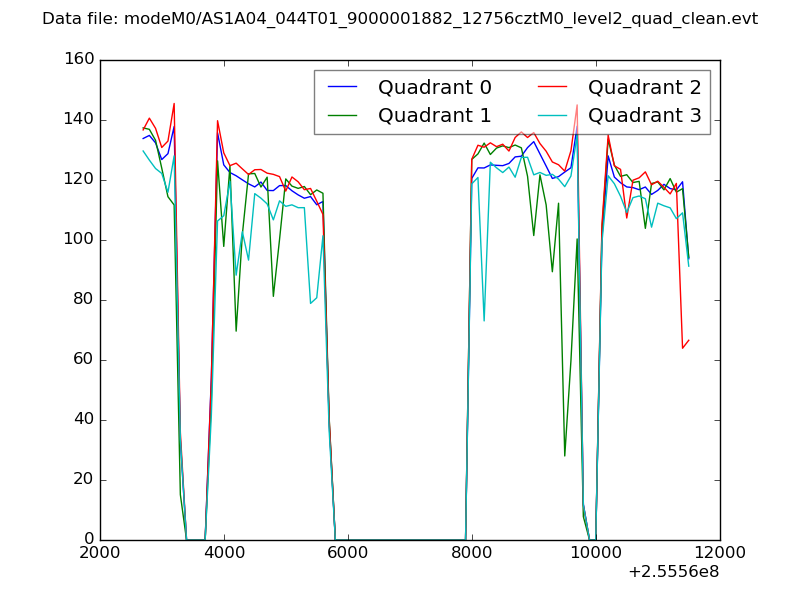 |
|
| Module-wise count rates for Quadrant A Data is divided into 100 sec bins |
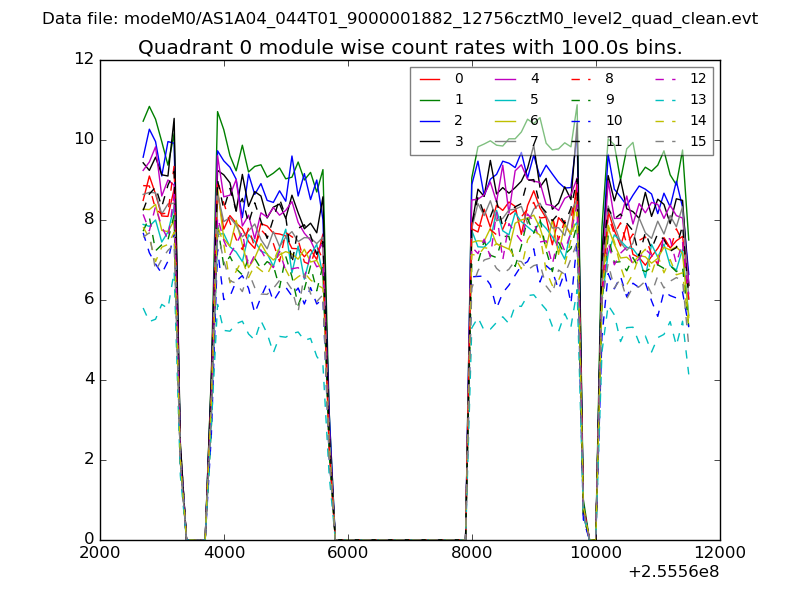 |
 |
| Module-wise count rates for Quadrant B Data is divided into 100 sec bins |
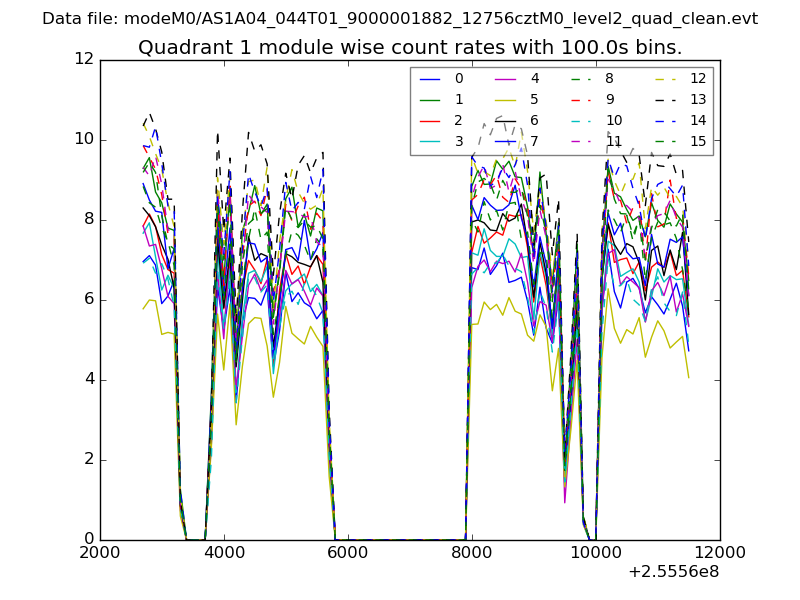 |
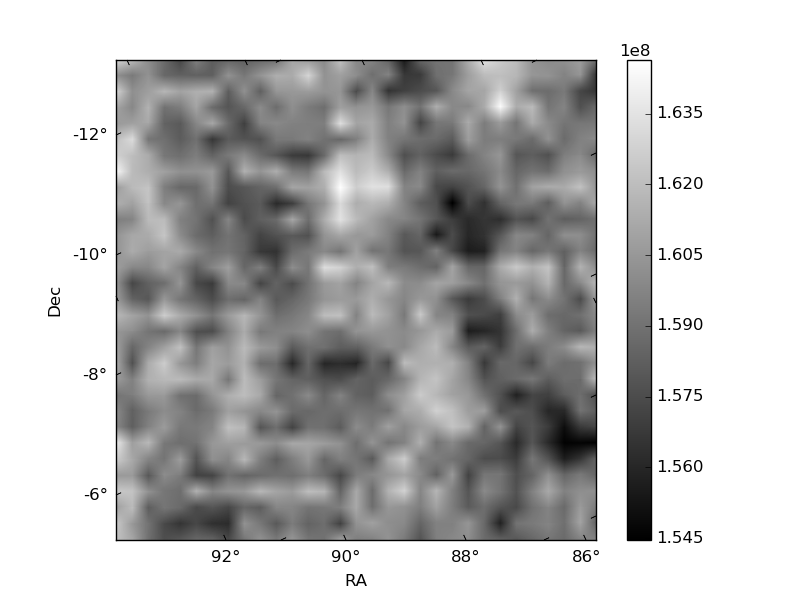 |
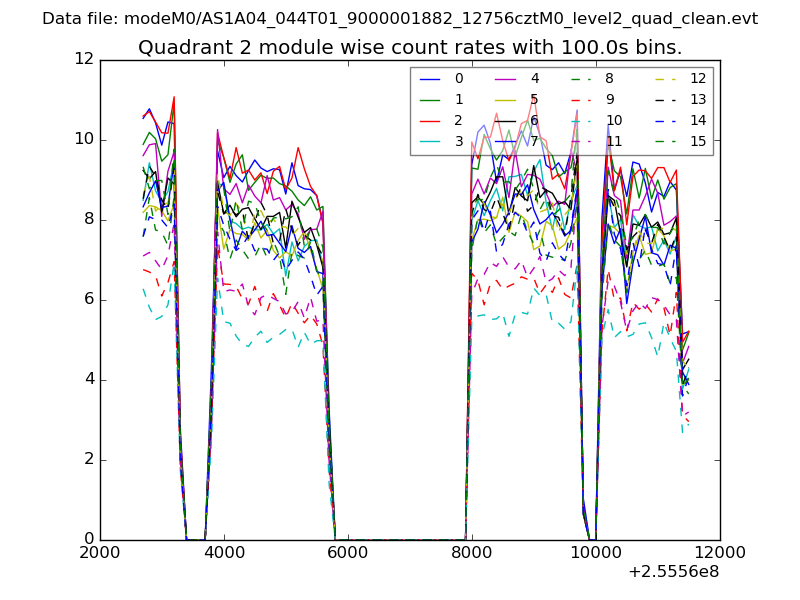
| Module-wise count rates for Quadrant C Data is divided into 100 sec bins |
 |
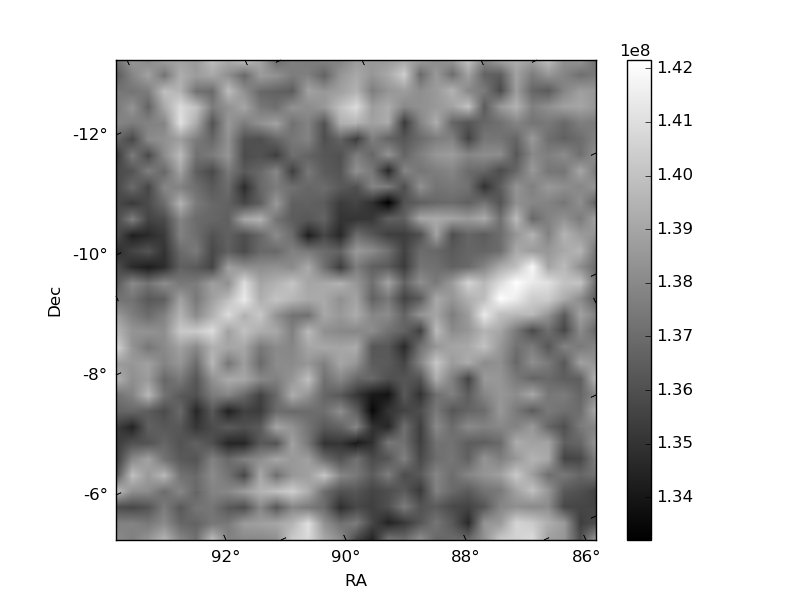 |
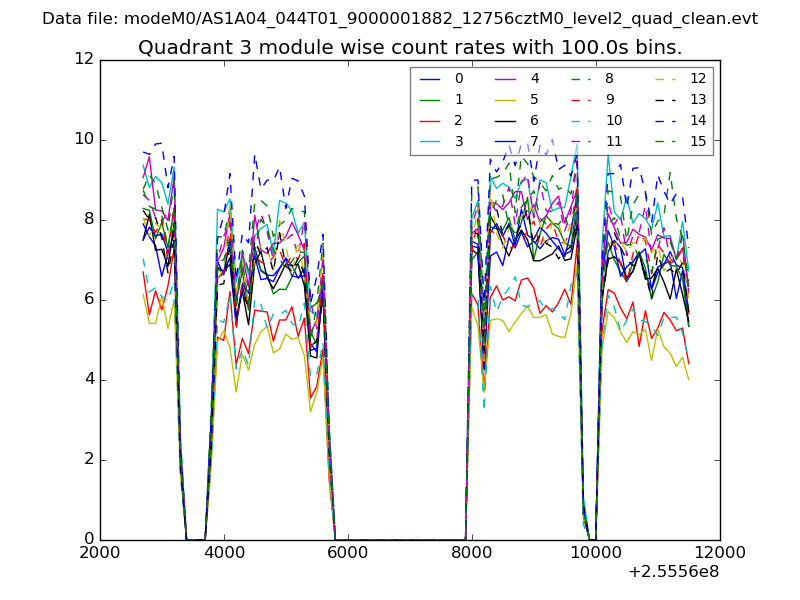
| Module-wise count rates for Quadrant D Data is divided into 100 sec bins |
 |
 |
| Parameter | Plot |
|---|---|
| CZT HV Monitor | 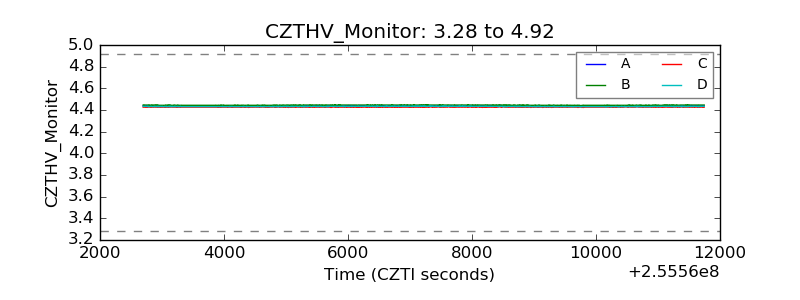 |
| D_VDD | 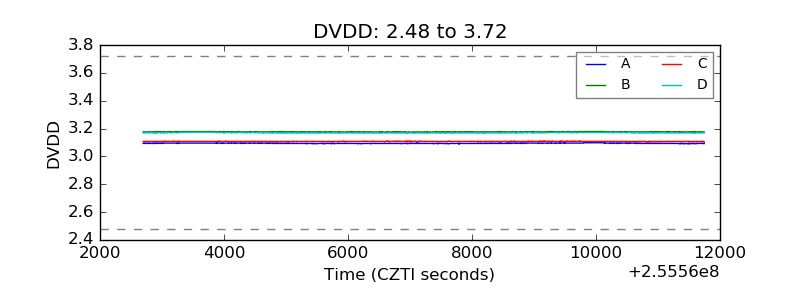 |
| Temperature 1 | 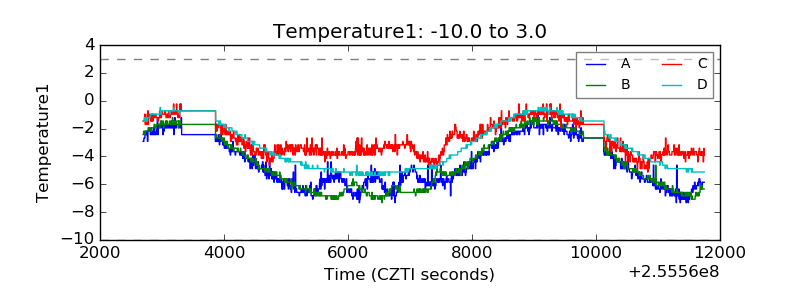 |
| Veto HV Monitor | 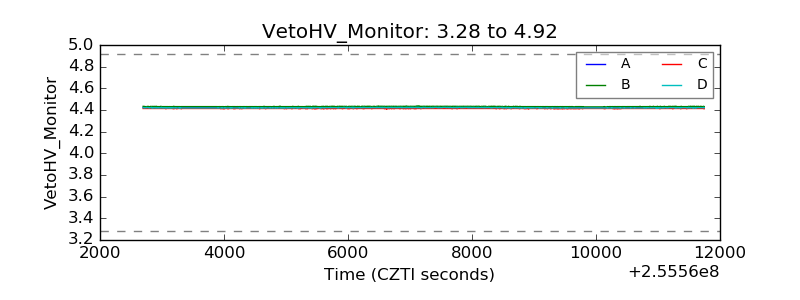 |
| Veto LLD | 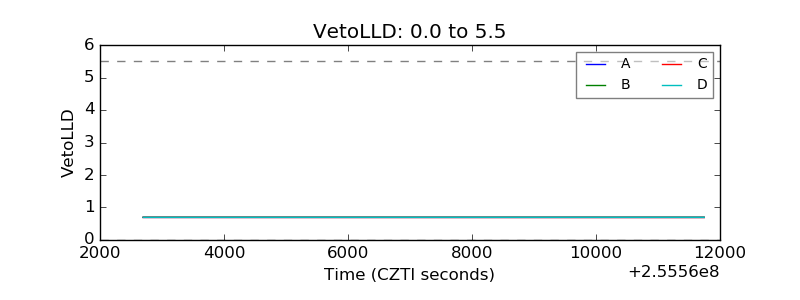 |
| Alpha Counter | 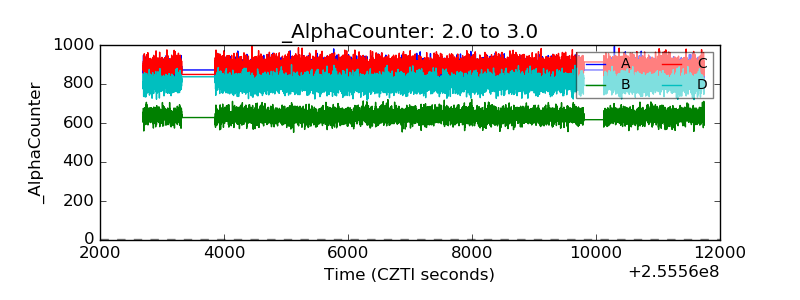 |
| _CPM_Rate | 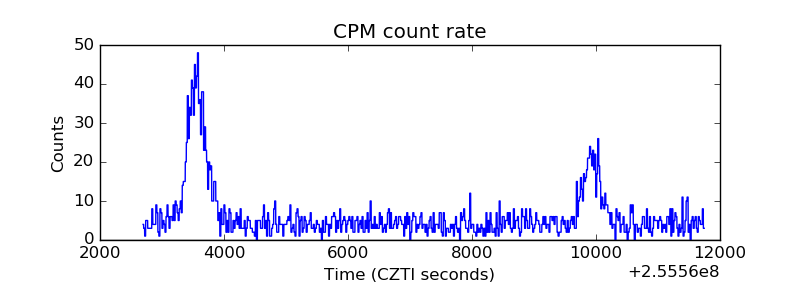 |
| CZT Counter | 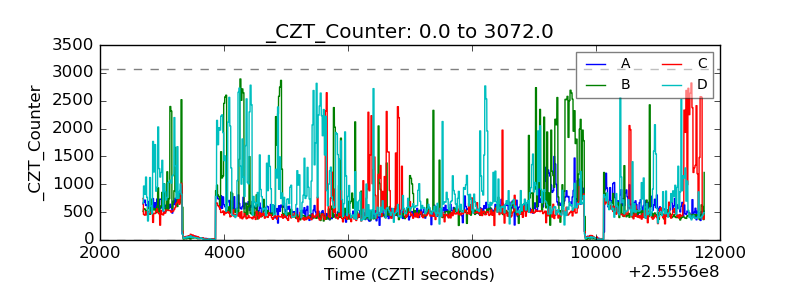 |
| +2.5 Volts monitor | 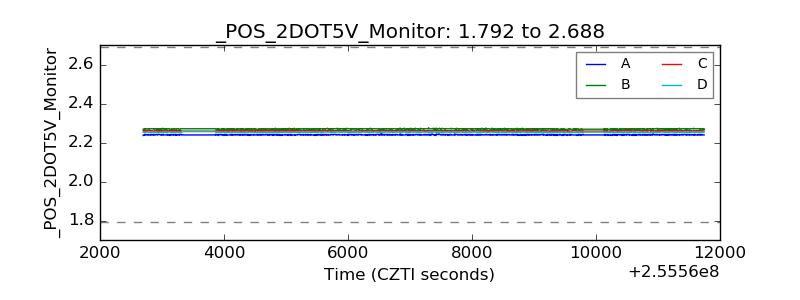 |
| +5 Volts monitor |  |
| _ROLL_ROT | 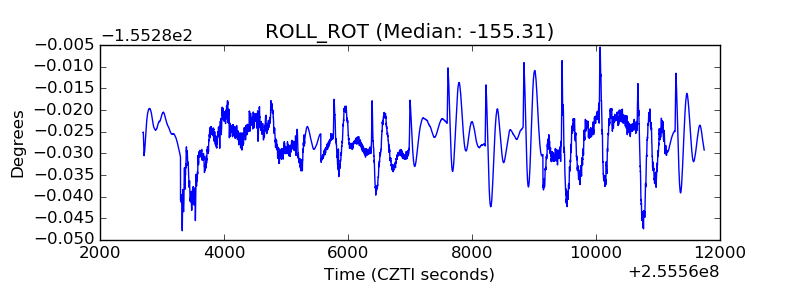 |
| _Roll_DEC | 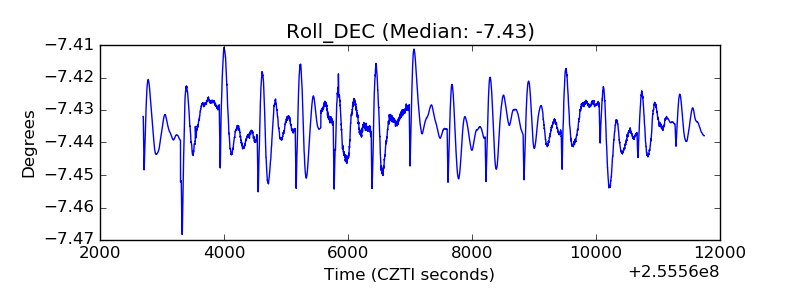 |
| _Roll_RA | 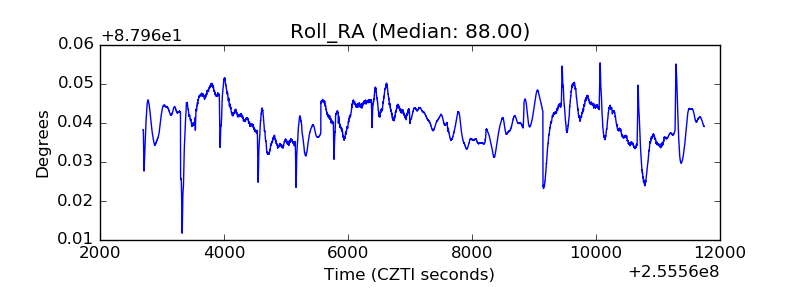 |
| Veto Counter | 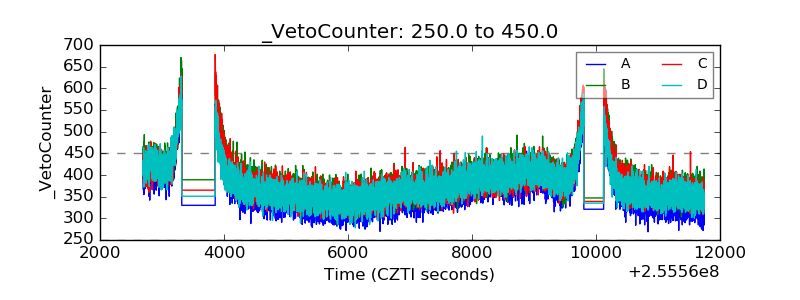 |