| Param | Original file | Final file |
|---|---|---|
| Filename | modeM0/AS1A04_044T01_9000001882_12757cztM0_level2.evt | modeM0/AS1A04_044T01_9000001882_12757cztM0_level2_quad_clean.evt |
| Size (bytes) | 743,106,240 | 108,192,960 |
| Size | 708.7 MB | 103.2 MB |
| Events in quadrant A | 5,284,342 | 683,083 |
| Events in quadrant B | 6,075,957 | 642,127 |
| Events in quadrant C | 5,427,280 | 696,576 |
| Events in quadrant D | 5,146,379 | 668,111 |
| Mode M0 | |||
|---|---|---|---|
| Quadrant | BADHDUFLAG | Total packets | Discarded packets |
| A | 0 | 21614 | 3 |
| B | 0 | 23593 | 2 |
| C | 0 | 21849 | 2 |
| D | 0 | 21167 | 2 |
| Mode M9 | |||
|---|---|---|---|
| Quadrant | BADHDUFLAG | Total packets | Discarded packets |
| A | 0 | 7 | 0 |
| B | 0 | 7 | 0 |
| C | 0 | 7 | 0 |
| D | 0 | 7 | 0 |
| Mode SS | |||
|---|---|---|---|
| Quadrant | BADHDUFLAG | Total packets | Discarded packets |
| A | 0 | 172 | 0 |
| B | 0 | 172 | 0 |
| C | 0 | 172 | 0 |
| D | 0 | 172 | 0 |
| Quadrant | Total seconds | Saturated seconds | Saturation percentage |
|---|---|---|---|
| A | 8441 | 146 | 1.729653% |
| B | 8441 | 1001 | 11.858785% |
| C | 8441 | 713 | 8.446866% |
| D | 8441 | 176 | 2.085061% |
Noise dominated data is calculated using 1-second bins in cleaned event files. If a bin has >2000 counts, and if more than 50% of those come from <1% of pixels, then it is considered to be noise-dominated and hence unusable.
| Quadrant | # 1 sec bins | Bins with >0 counts | Bins with >2000 counts | High rate bins dominated by noise | Noise dominated (total time) | Noise dominated (detector-on time) | Marked lightcurve |
|---|---|---|---|---|---|---|---|
| A | 9112 | 8444 | 33 | 33 | 0.36% | 0.39% | 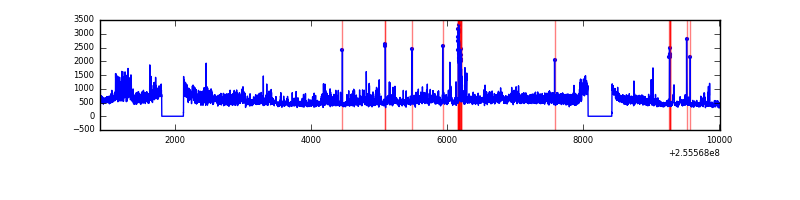 |
| B | 9112 | 8444 | 644 | 644 | 7.07% | 7.63% | 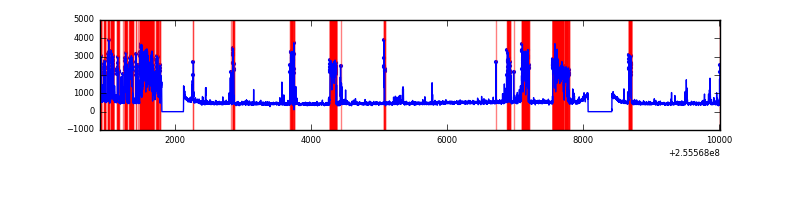 |
| C | 9112 | 8444 | 458 | 458 | 5.03% | 5.42% | 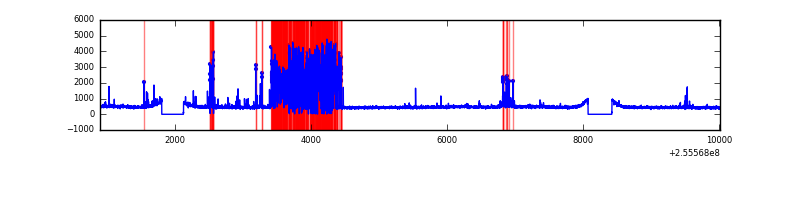 |
| D | 9112 | 8444 | 127 | 127 | 1.39% | 1.50% | 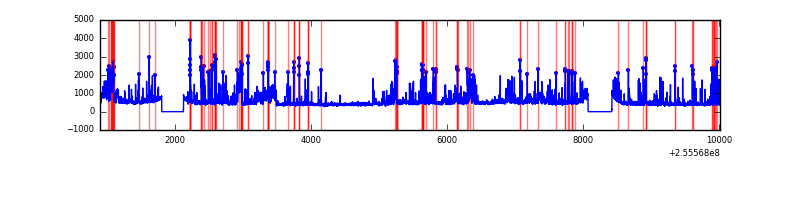 |
Top three noisy pixels from each quadrant. If the there are fewer than three noisy pixels in the level2.evt file, extra rows are filled as -1
| Pixel properties | Quadrant properties | ||||||
|---|---|---|---|---|---|---|---|
| Quadrant | DetID | PixID | Counts | Sigma | Mean | Median | Sigma |
| A | 0 | 23 | 577946 | 2789.58 | 998 | 973 | 206.8 |
| A | 15 | 222 | 551441 | 2661.43 | 998 | 973 | 206.8 |
| A | 9 | 143 | 179474 | 863.03 | 998 | 973 | 206.8 |
| B | 4 | 239 | 1833205 | 9975.94 | 948 | 923 | 183.7 |
| B | 0 | 85 | 396861 | 2155.7 | 948 | 923 | 183.7 |
| B | 0 | 214 | 33853 | 179.29 | 948 | 923 | 183.7 |
| C | 15 | 208 | 1797985 | 8303.28 | 930 | 936 | 216.4 |
| C | 13 | 61 | 6674 | 26.51 | 930 | 936 | 216.4 |
| C | 8 | 128 | 4322 | 15.65 | 930 | 936 | 216.4 |
| D | 1 | 52 | 989159 | 4194.68 | 969 | 939 | 235.6 |
| D | 8 | 195 | 135557 | 571.41 | 969 | 939 | 235.6 |
| D | 10 | 199 | 124806 | 525.78 | 969 | 939 | 235.6 |
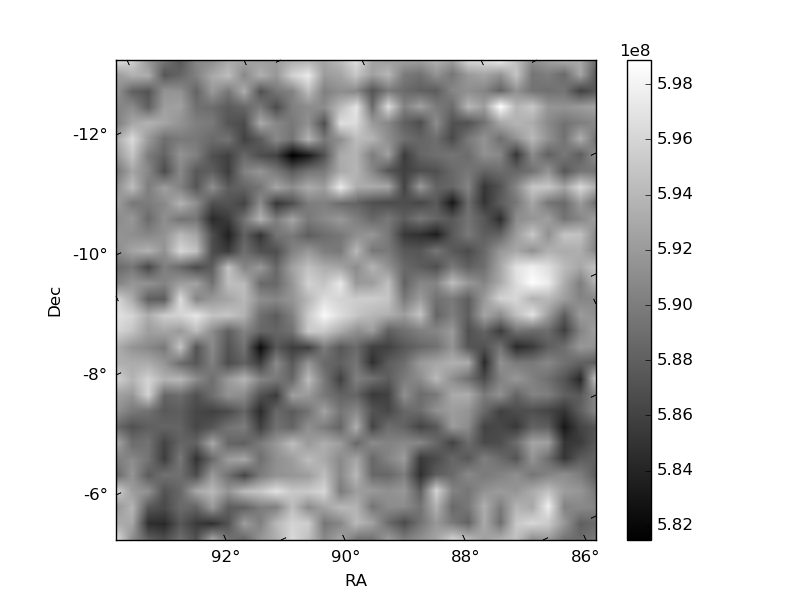
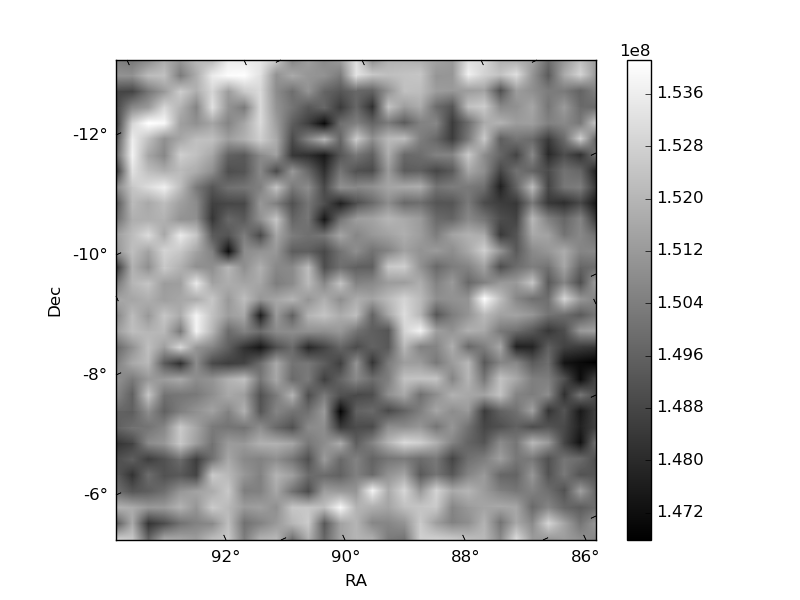
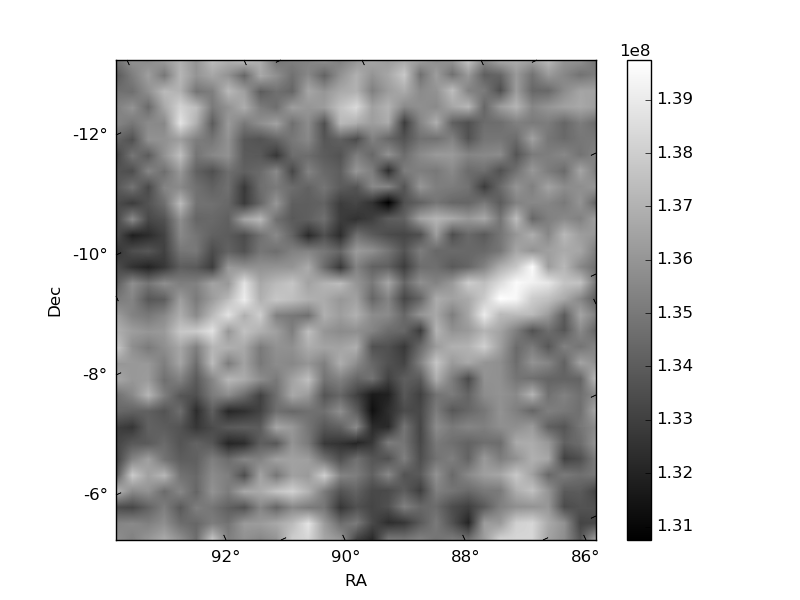
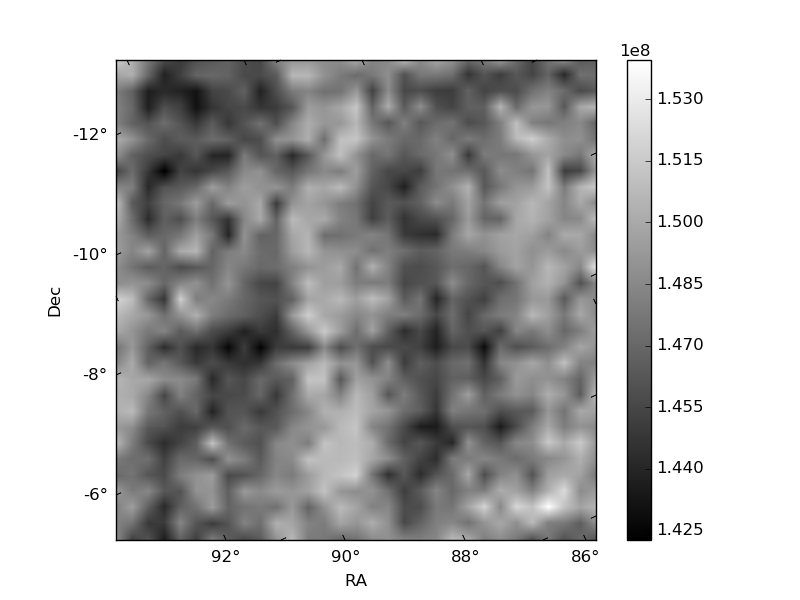
Histogram calculated using DETX and DETY for each event in the final _common_clean file
| Quadrant A | 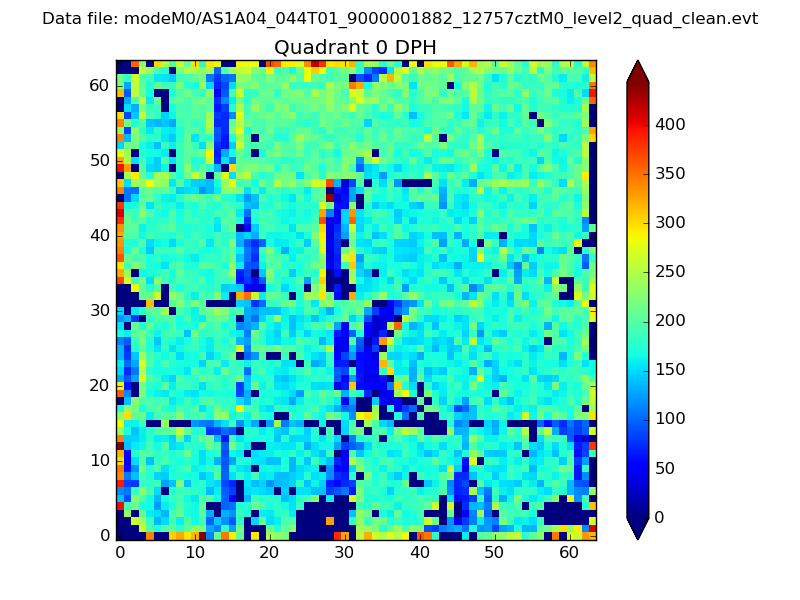 |
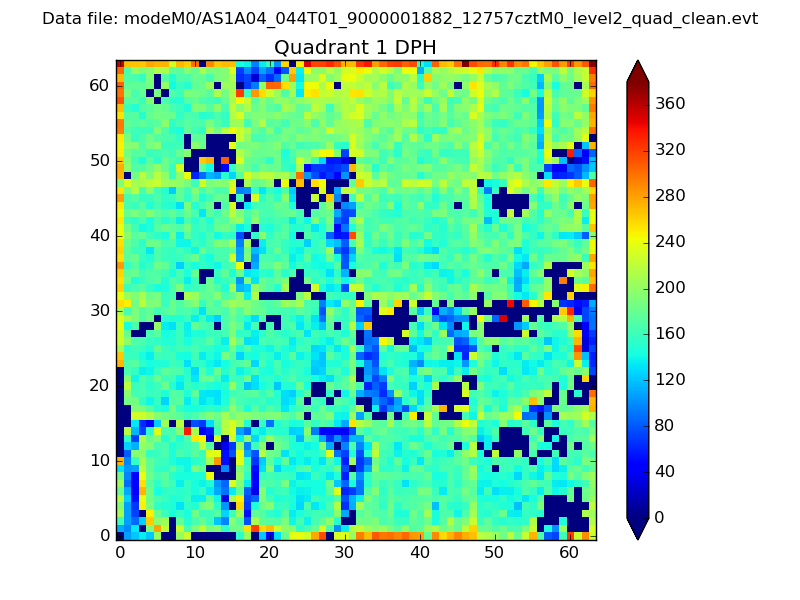 |
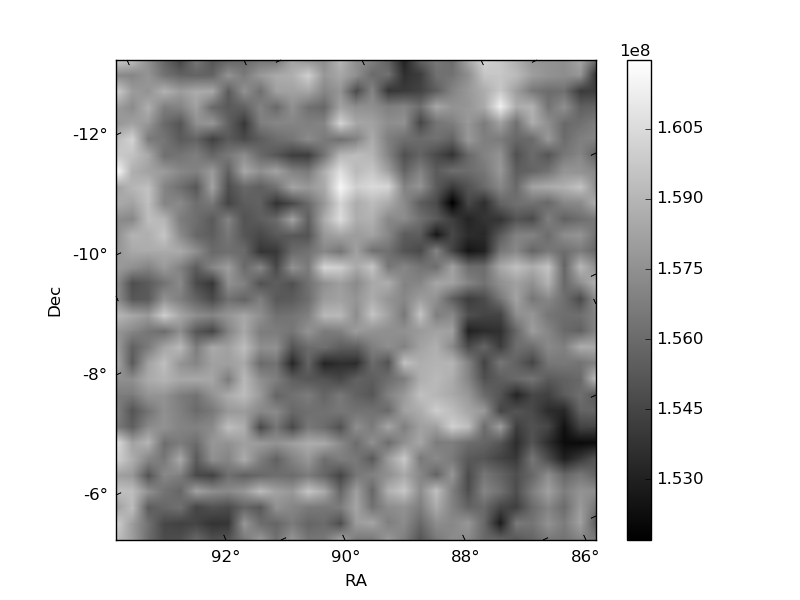
Quadrant B |
|---|---|---|---|
| Quadrant D | 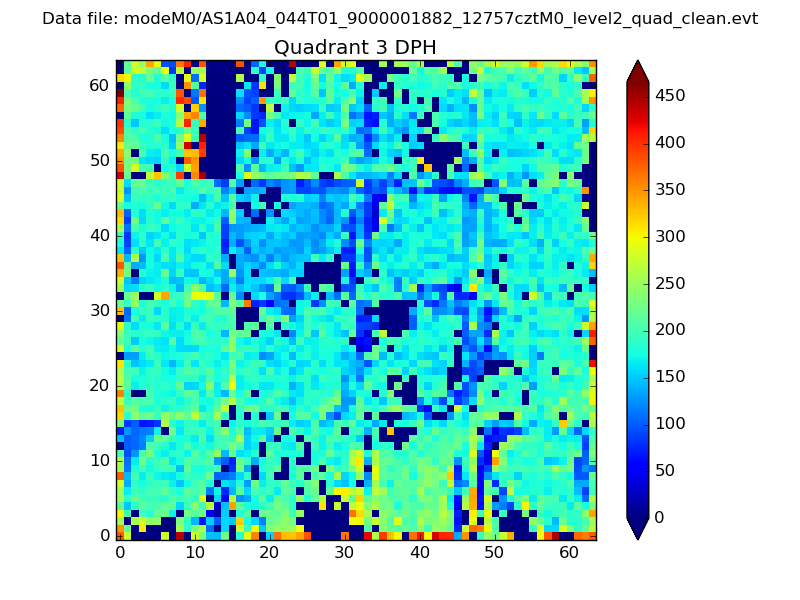 |
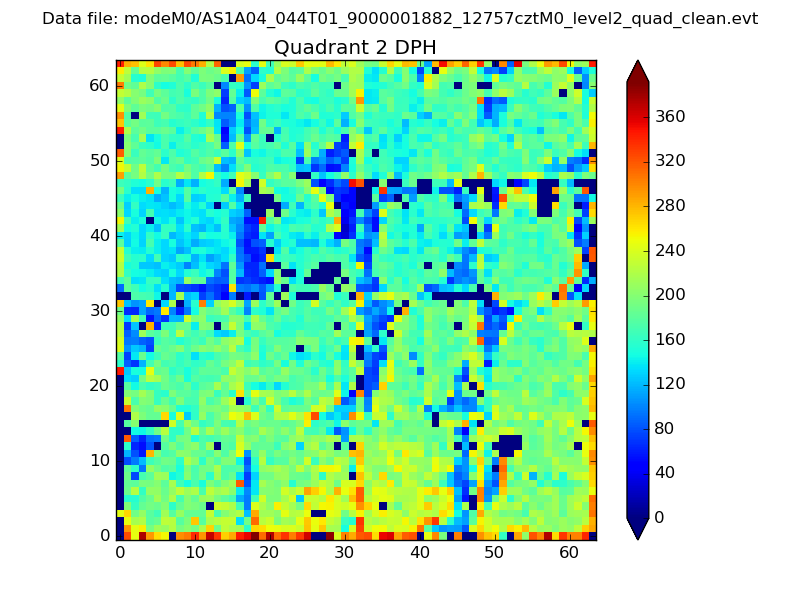 |
Quadrant C |
| Plot type | Count rate plots | Images |
|---|---|---|
| Comparison with Poisson distribution Blue bars denote a histogram of data divided into 1 sec bins. Red curve is a Poisson curve with rate = median count rate of data. |
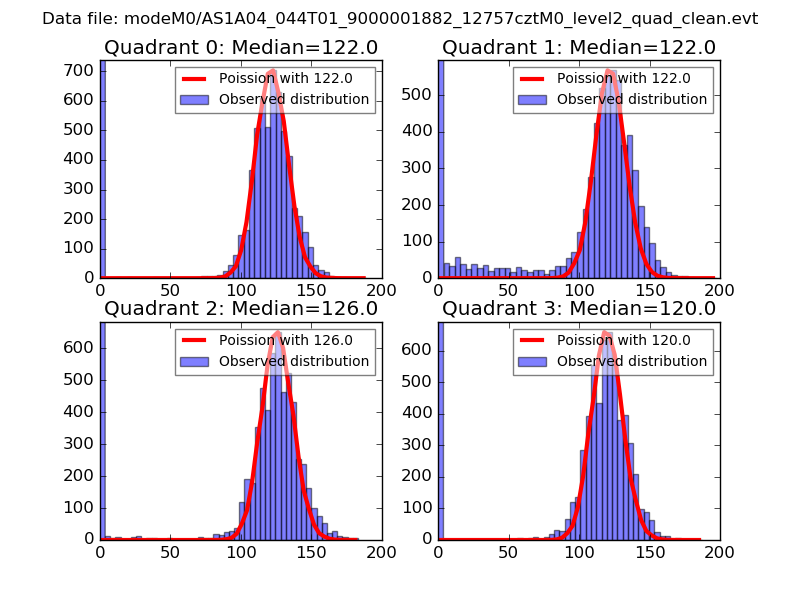 |
 |
| Quadrant-wise count rates Data is divided into 100 sec bins |
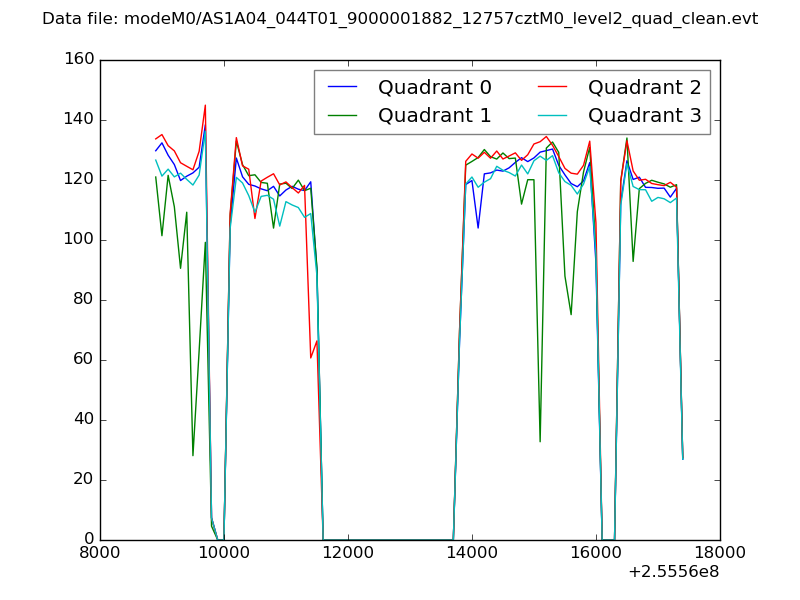 |
|
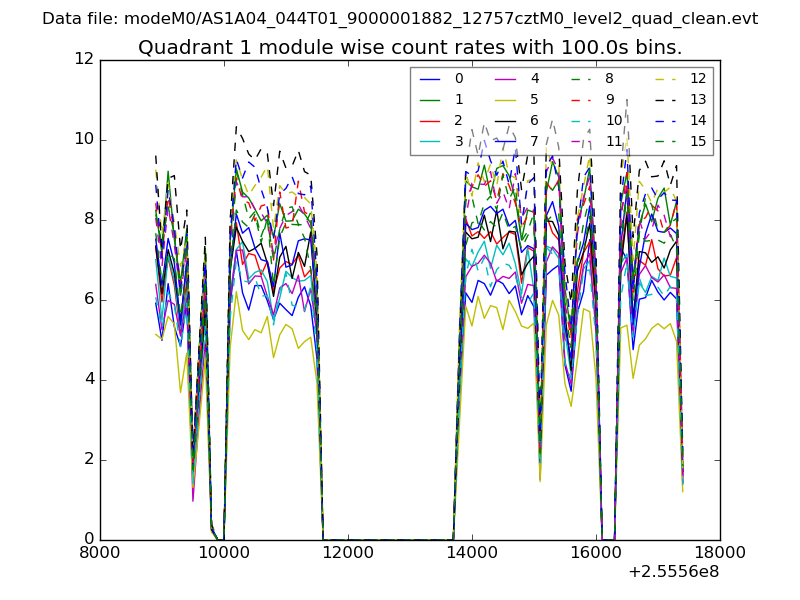
| Module-wise count rates for Quadrant A Data is divided into 100 sec bins |
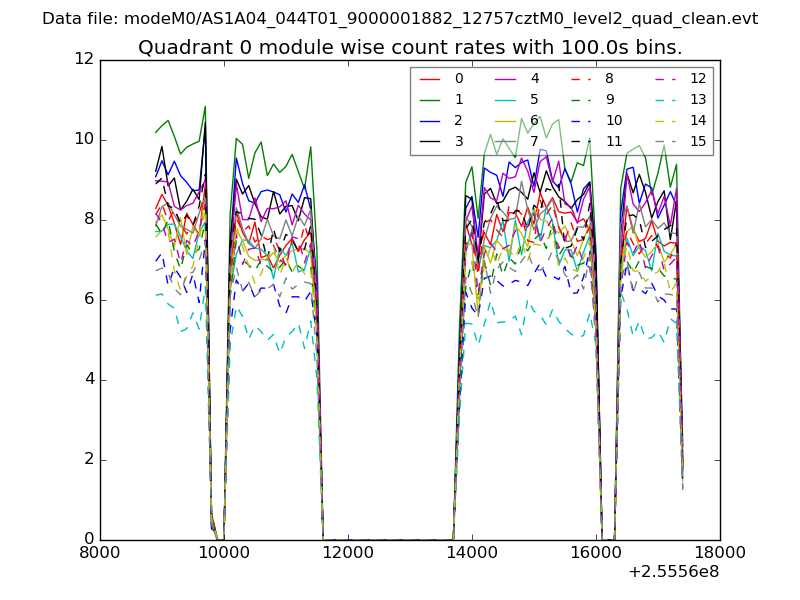 |
 |
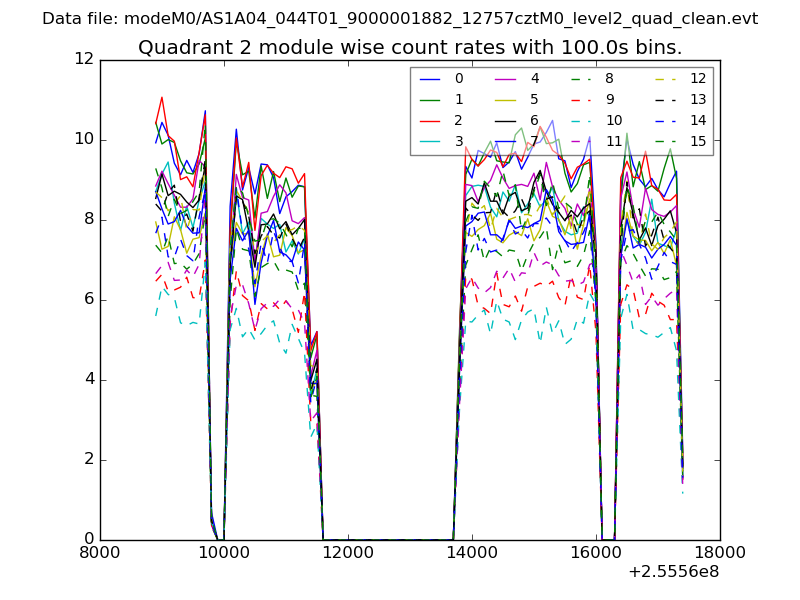
| Module-wise count rates for Quadrant B Data is divided into 100 sec bins |
 |
 |
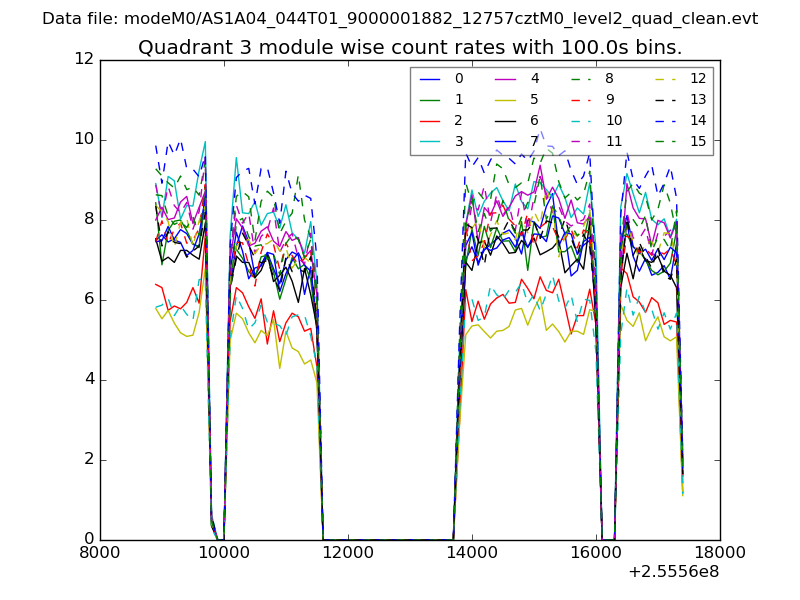
| Module-wise count rates for Quadrant C Data is divided into 100 sec bins |
 |
 |
| Module-wise count rates for Quadrant D Data is divided into 100 sec bins |
 |
 |
| Parameter | Plot |
|---|---|
| CZT HV Monitor | 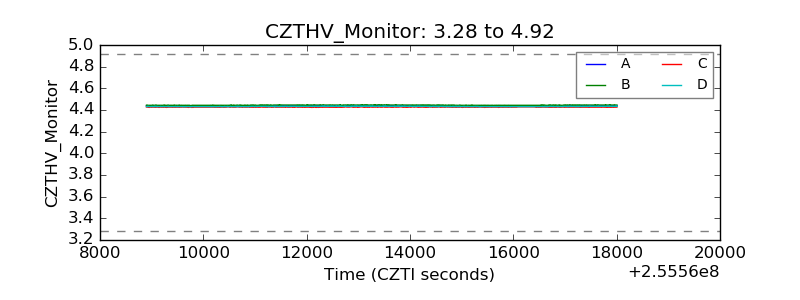 |
| D_VDD | 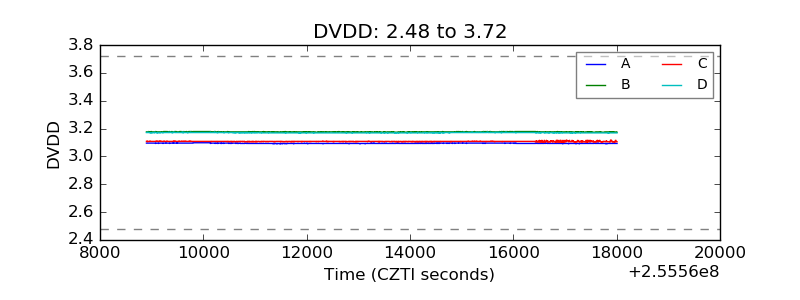 |
| Temperature 1 | 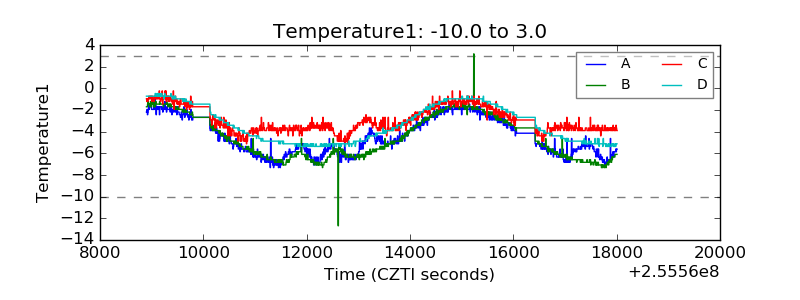 |
| Veto HV Monitor |  |
| Veto LLD | 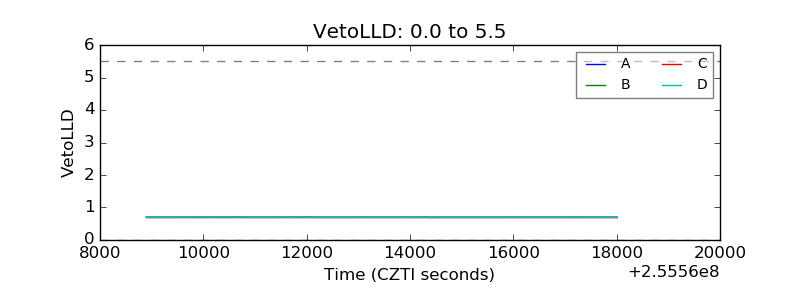 |
| Alpha Counter | 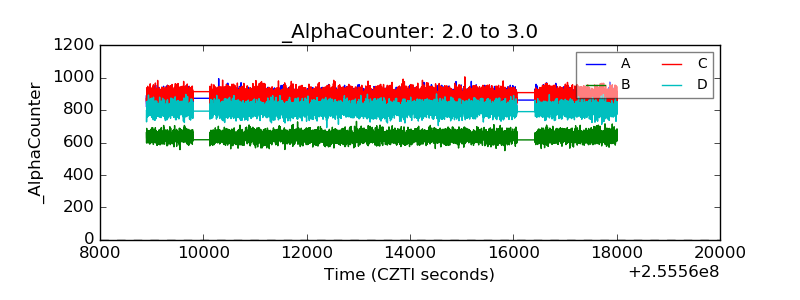 |
| _CPM_Rate | 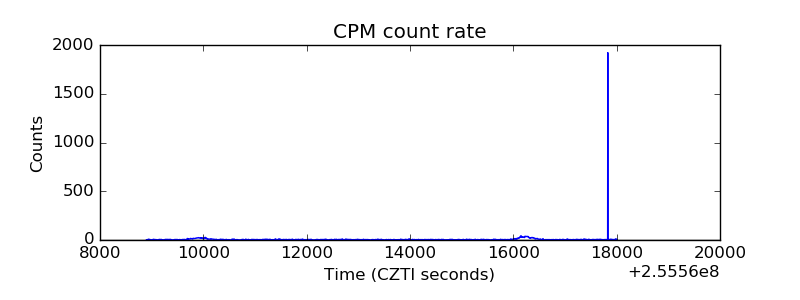 |
| CZT Counter | 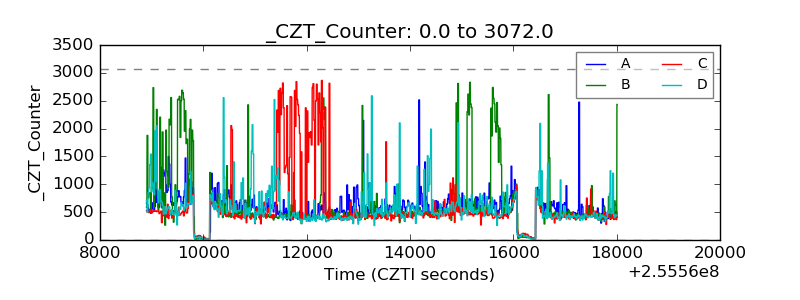 |
| +2.5 Volts monitor |  |
| +5 Volts monitor |  |
| _ROLL_ROT | 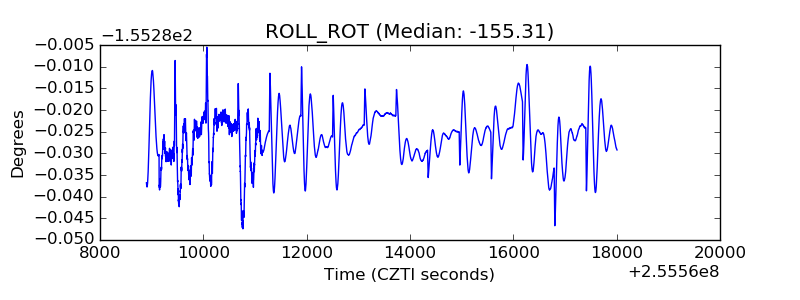 |
| _Roll_DEC | 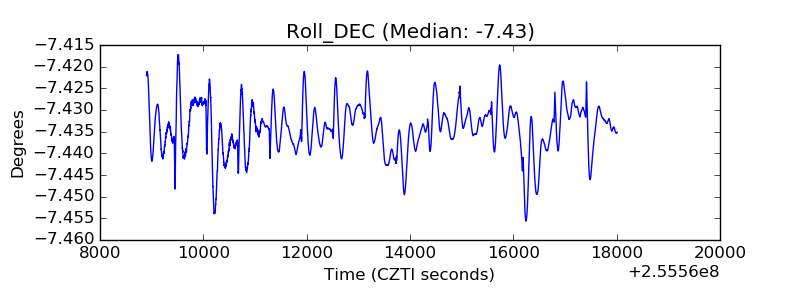 |
| _Roll_RA | 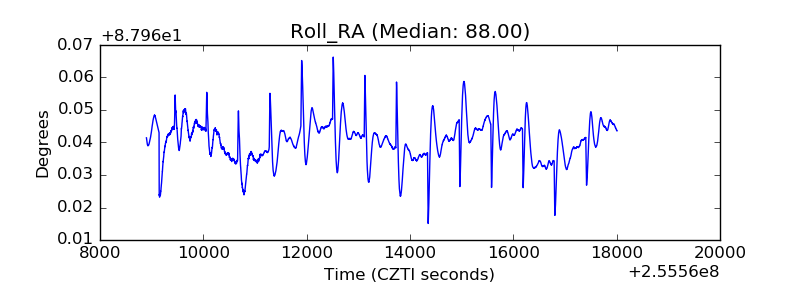 |
| Veto Counter | 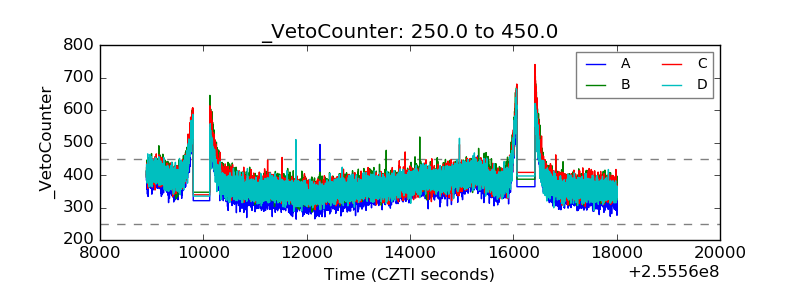 |