| Param | Original file | Final file |
|---|---|---|
| Filename | modeM0/AS1A04_044T01_9000001882_12760cztM0_level2.evt | modeM0/AS1A04_044T01_9000001882_12760cztM0_level2_quad_clean.evt |
| Size (bytes) | 894,360,960 | 140,598,720 |
| Size | 852.9 MB | 134.1 MB |
| Events in quadrant A | 6,650,349 | 864,042 |
| Events in quadrant B | 7,252,875 | 841,506 |
| Events in quadrant C | 5,386,191 | 896,934 |
| Events in quadrant D | 7,006,355 | 847,181 |
| Mode M0 | |||
|---|---|---|---|
| Quadrant | BADHDUFLAG | Total packets | Discarded packets |
| A | 0 | 27511 | 2 |
| B | 0 | 29185 | 2 |
| C | 0 | 24167 | 2 |
| D | 0 | 28870 | 2 |
| Mode M9 | |||
|---|---|---|---|
| Quadrant | BADHDUFLAG | Total packets | Discarded packets |
| A | 0 | 9 | 0 |
| B | 0 | 9 | 0 |
| C | 0 | 9 | 0 |
| D | 0 | 9 | 0 |
| Mode SS | |||
|---|---|---|---|
| Quadrant | BADHDUFLAG | Total packets | Discarded packets |
| A | 0 | 236 | 0 |
| B | 0 | 236 | 0 |
| C | 0 | 236 | 0 |
| D | 0 | 236 | 0 |
| Quadrant | Total seconds | Saturated seconds | Saturation percentage |
|---|---|---|---|
| A | 11684 | 157 | 1.343718% |
| B | 11684 | 742 | 6.350565% |
| C | 11684 | 80 | 0.684697% |
| D | 11684 | 259 | 2.216707% |
Noise dominated data is calculated using 1-second bins in cleaned event files. If a bin has >2000 counts, and if more than 50% of those come from <1% of pixels, then it is considered to be noise-dominated and hence unusable.
| Quadrant | # 1 sec bins | Bins with >0 counts | Bins with >2000 counts | High rate bins dominated by noise | Noise dominated (total time) | Noise dominated (detector-on time) | Marked lightcurve |
|---|---|---|---|---|---|---|---|
| A | 12555 | 11687 | 27 | 27 | 0.22% | 0.23% | 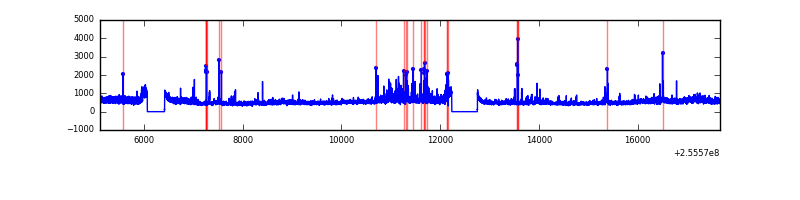 |
| B | 12555 | 11687 | 501 | 501 | 3.99% | 4.29% | 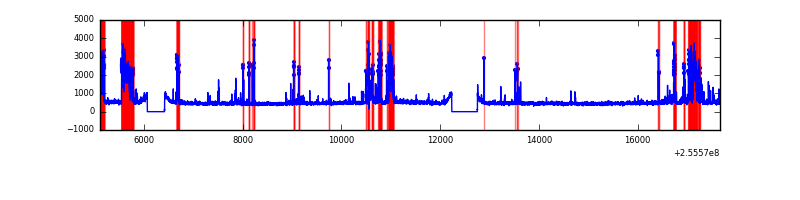 |
| C | 12555 | 11687 | 23 | 23 | 0.18% | 0.20% | 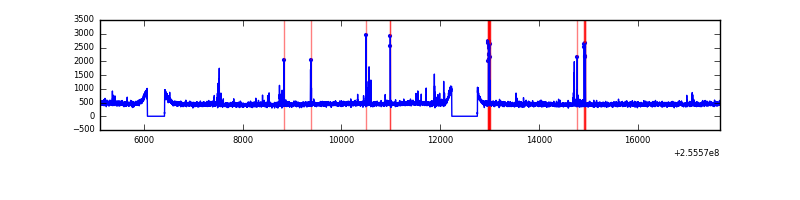 |
| D | 12555 | 11687 | 180 | 180 | 1.43% | 1.54% | 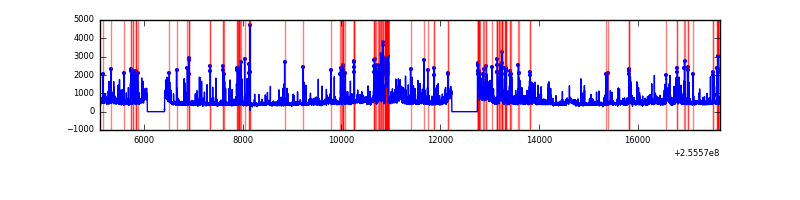 |
Top three noisy pixels from each quadrant. If the there are fewer than three noisy pixels in the level2.evt file, extra rows are filled as -1
| Pixel properties | Quadrant properties | ||||||
|---|---|---|---|---|---|---|---|
| Quadrant | DetID | PixID | Counts | Sigma | Mean | Median | Sigma |
| A | 0 | 23 | 618271 | 2204.58 | 1366 | 1330 | 279.8 |
| A | 15 | 239 | 224205 | 796.42 | 1366 | 1330 | 279.8 |
| A | 8 | 15 | 150882 | 534.41 | 1366 | 1330 | 279.8 |
| B | 4 | 239 | 1365670 | 5313.32 | 1338 | 1303 | 256.8 |
| B | 0 | 85 | 492224 | 1911.82 | 1338 | 1303 | 256.8 |
| B | 3 | 209 | 48105 | 182.26 | 1338 | 1303 | 256.8 |
| C | 15 | 208 | 157791 | 503.46 | 1336 | 1343 | 310.7 |
| C | 8 | 128 | 11903 | 33.98 | 1336 | 1343 | 310.7 |
| C | 13 | 61 | 9760 | 27.09 | 1336 | 1343 | 310.7 |
| D | 1 | 52 | 1230522 | 3858.26 | 1323 | 1283 | 318.6 |
| D | 8 | 195 | 286121 | 894.03 | 1323 | 1283 | 318.6 |
| D | 2 | 136 | 176849 | 551.06 | 1323 | 1283 | 318.6 |
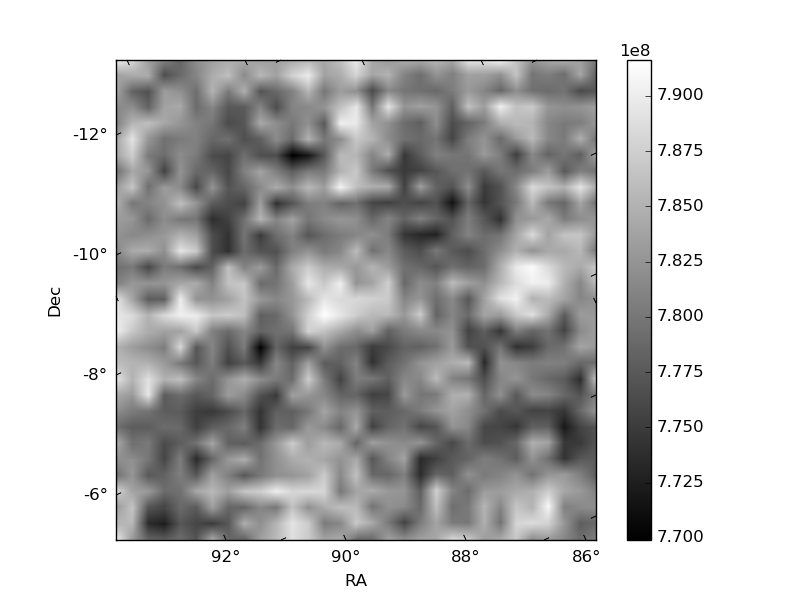
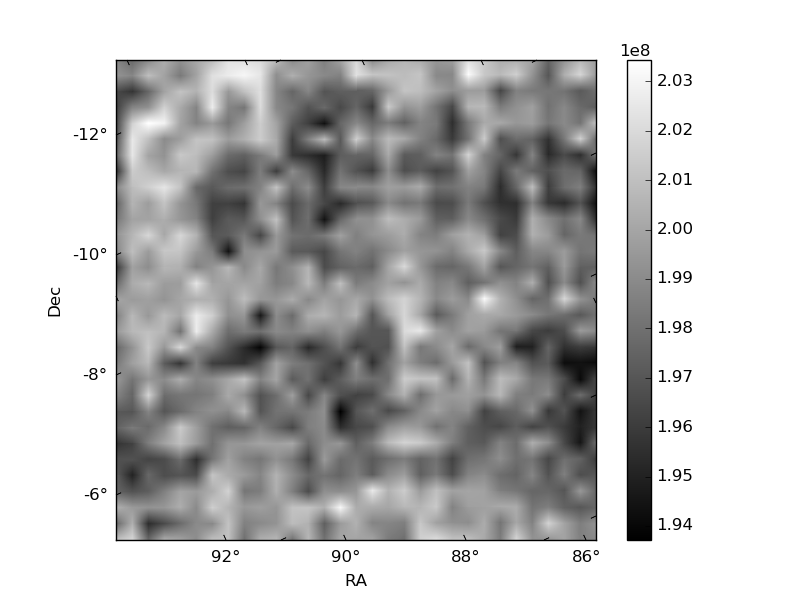
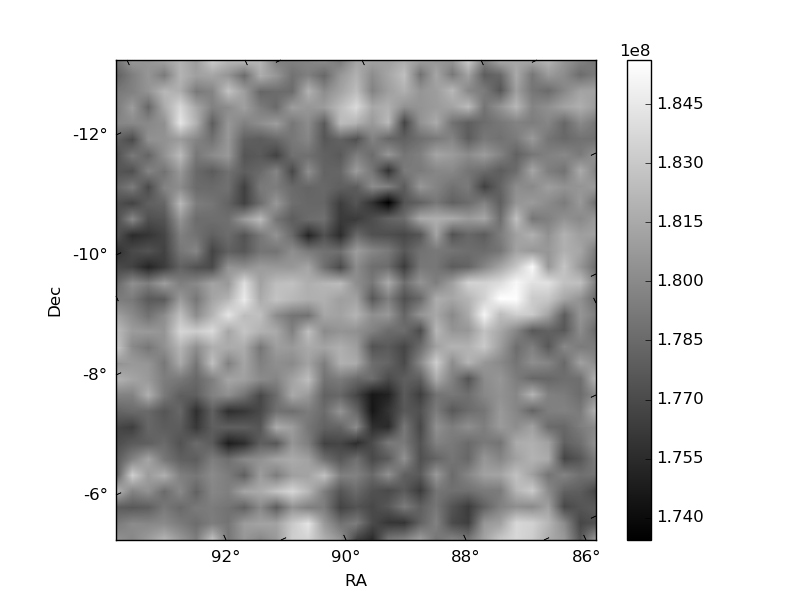
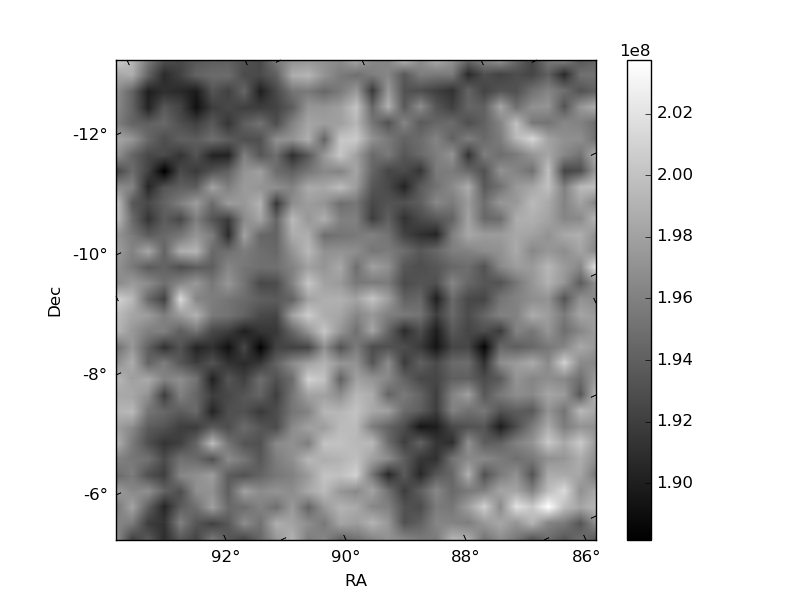
Histogram calculated using DETX and DETY for each event in the final _common_clean file
| Quadrant A | 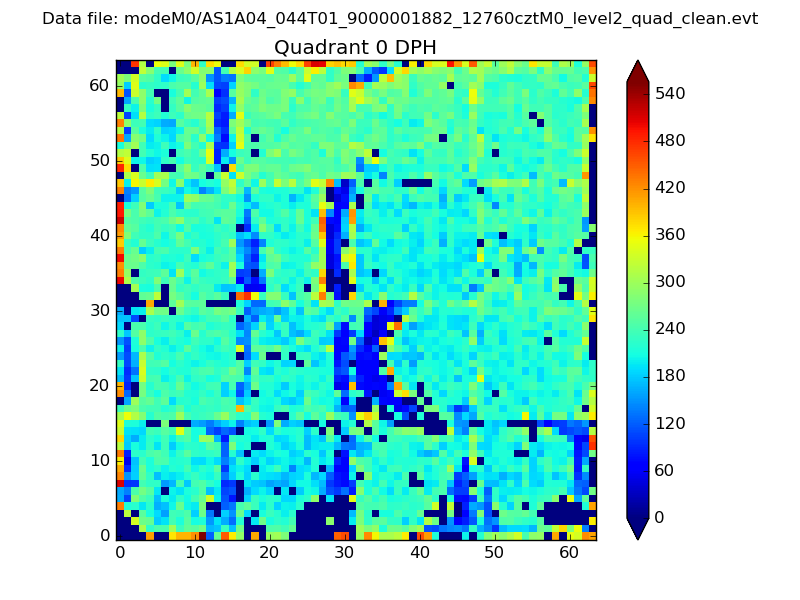 |
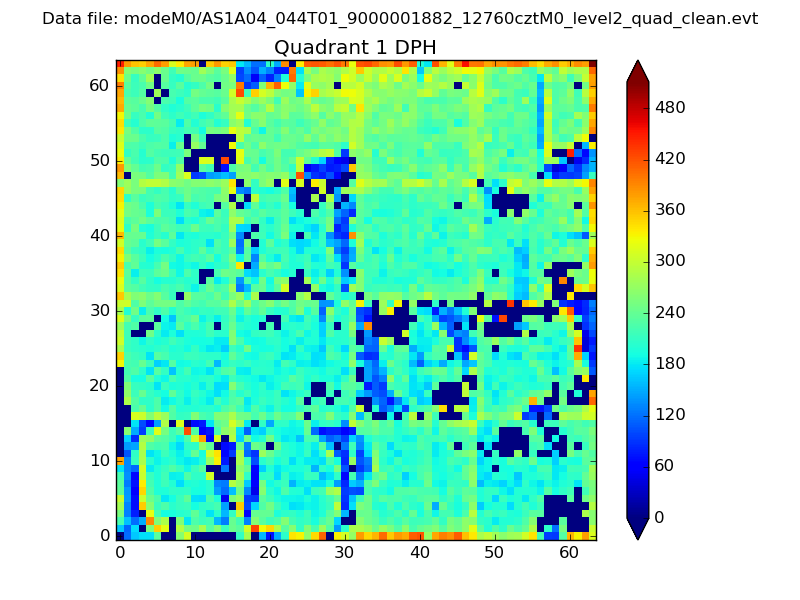 |
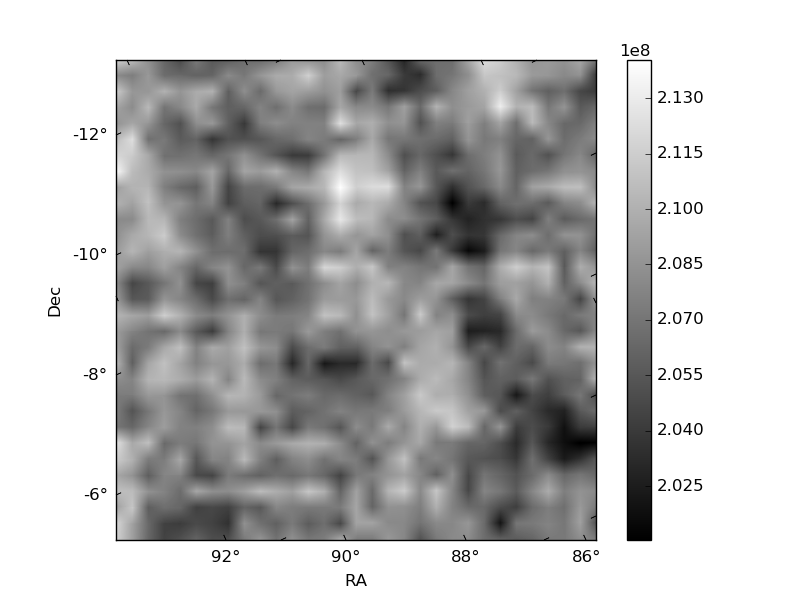
Quadrant B |
|---|---|---|---|
| Quadrant D | 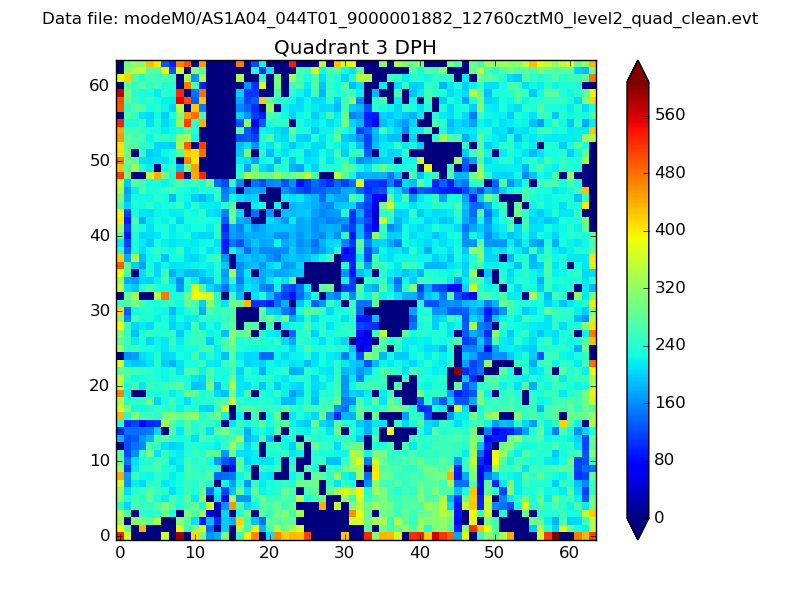 |
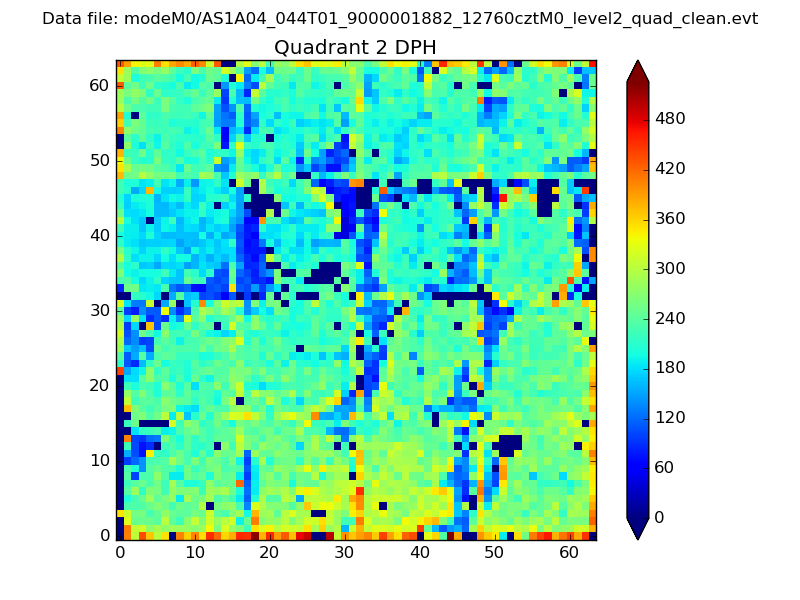 |
Quadrant C |
| Plot type | Count rate plots | Images |
|---|---|---|
| Comparison with Poisson distribution Blue bars denote a histogram of data divided into 1 sec bins. Red curve is a Poisson curve with rate = median count rate of data. |
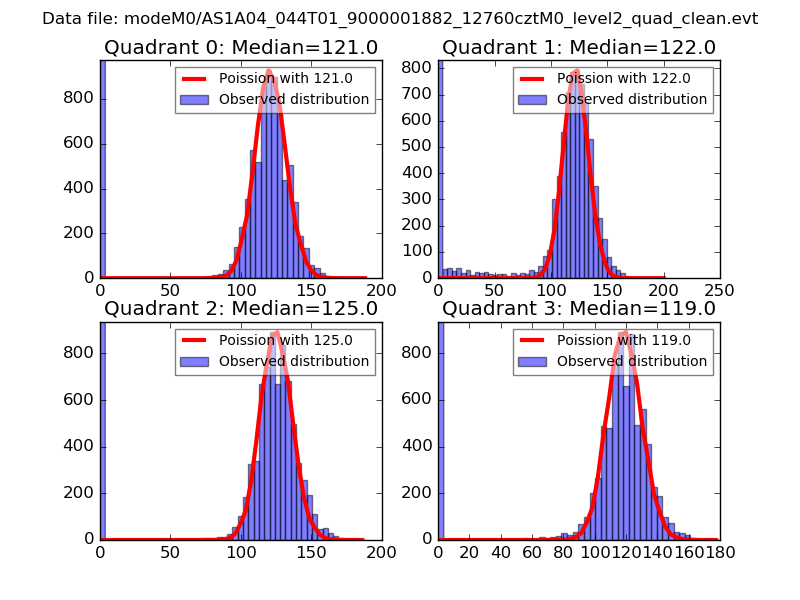 |
 |
| Quadrant-wise count rates Data is divided into 100 sec bins |
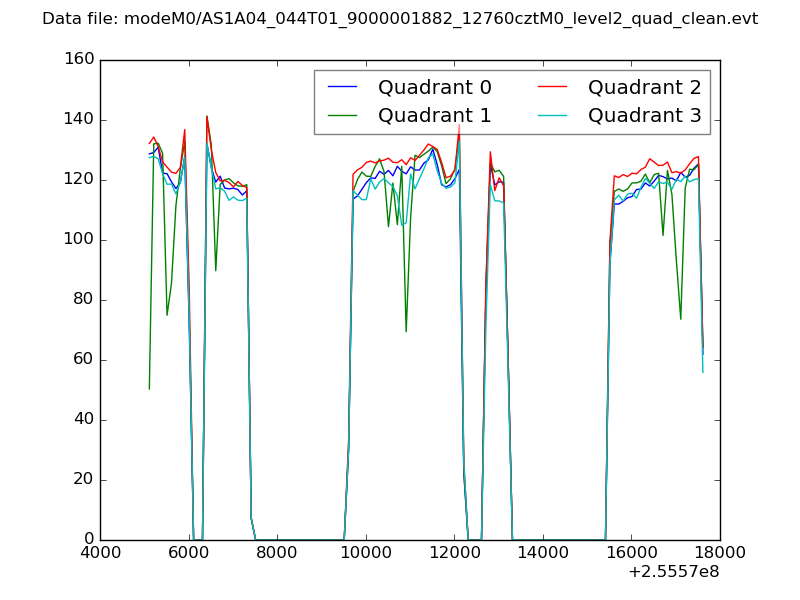 |
|
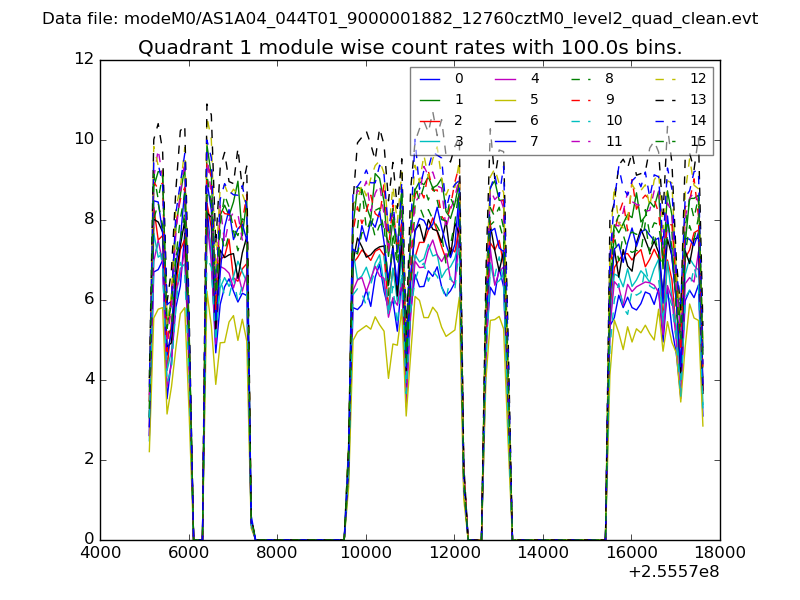
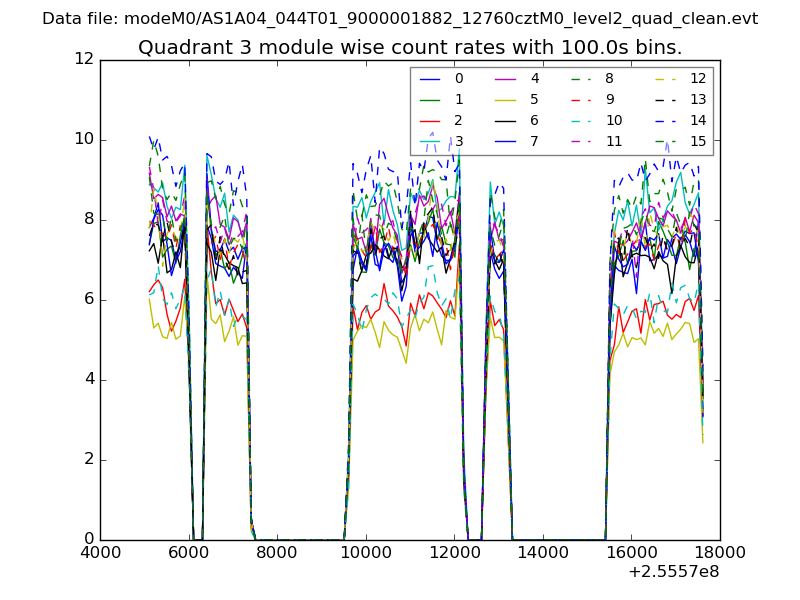
| Module-wise count rates for Quadrant A Data is divided into 100 sec bins |
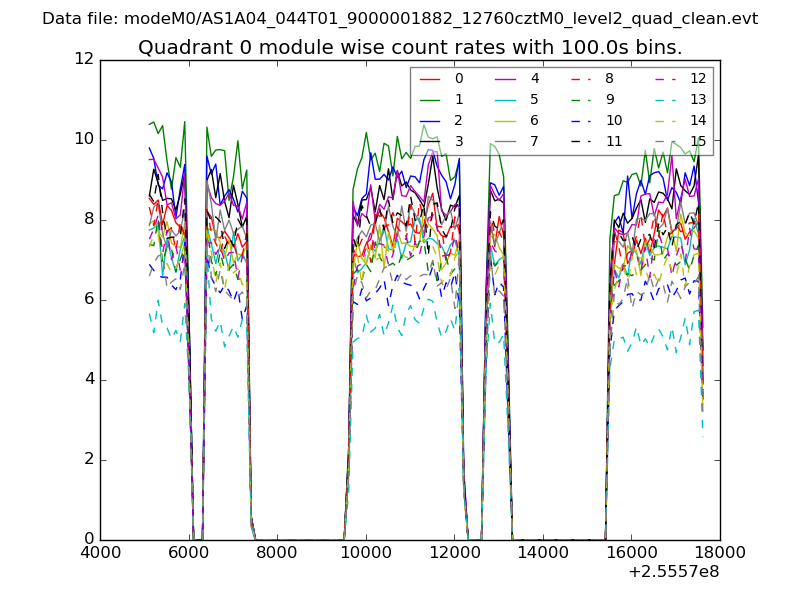 |
 |
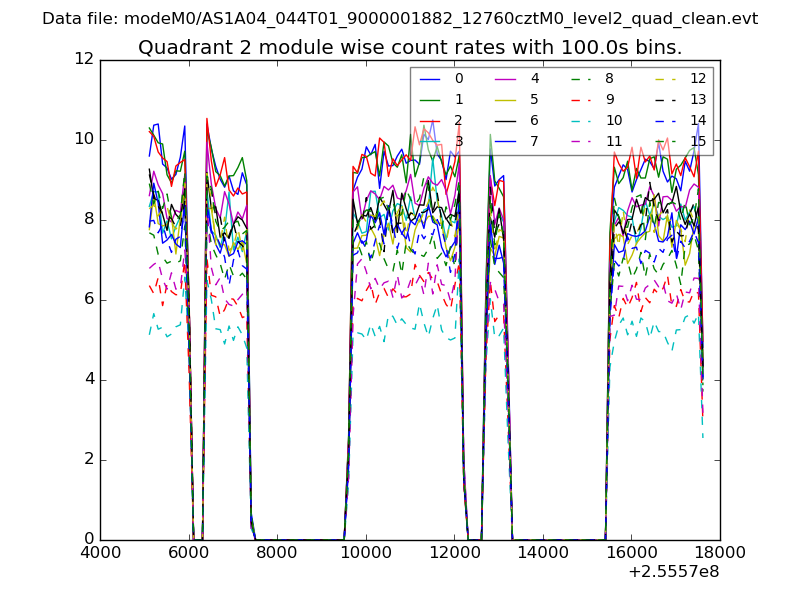
| Module-wise count rates for Quadrant B Data is divided into 100 sec bins |
 |
 |
| Module-wise count rates for Quadrant C Data is divided into 100 sec bins |
 |
 |
| Module-wise count rates for Quadrant D Data is divided into 100 sec bins |
 |
 |
| Parameter | Plot |
|---|---|
| CZT HV Monitor | 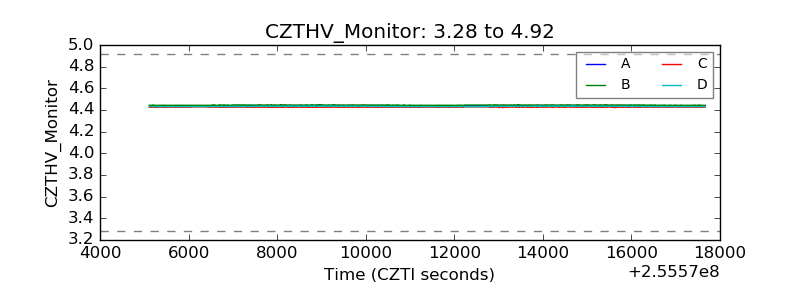 |
| D_VDD | 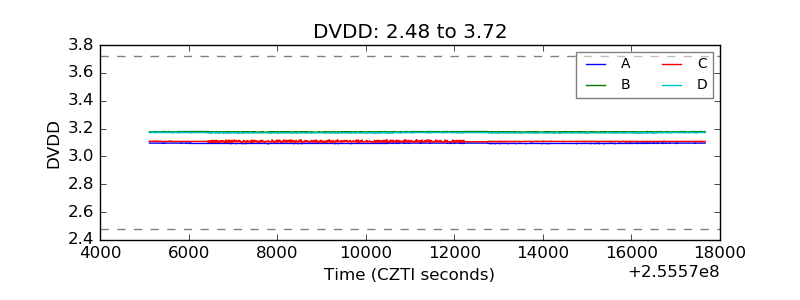 |
| Temperature 1 | 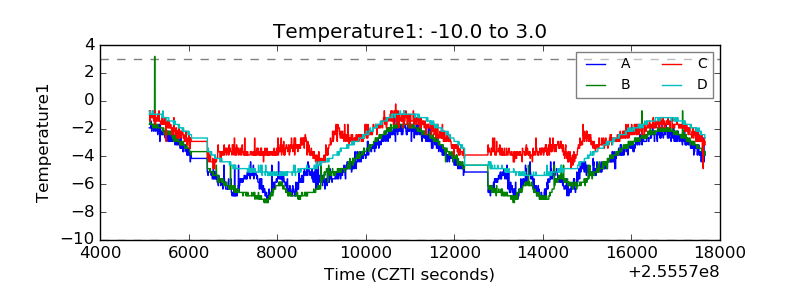 |
| Veto HV Monitor | 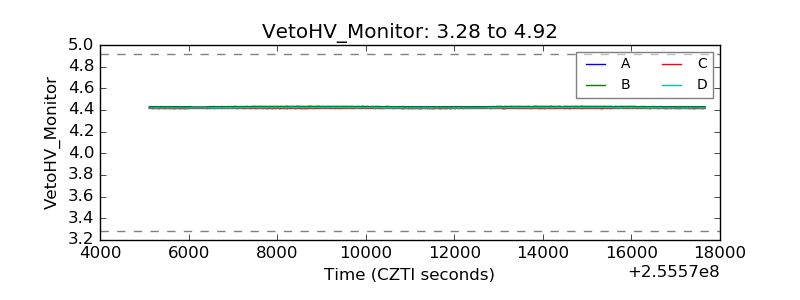 |
| Veto LLD | 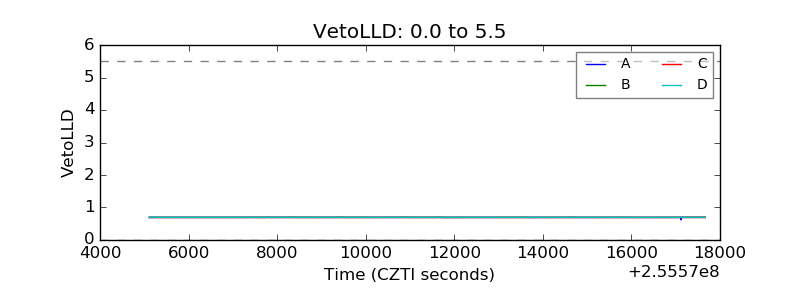 |
| Alpha Counter | 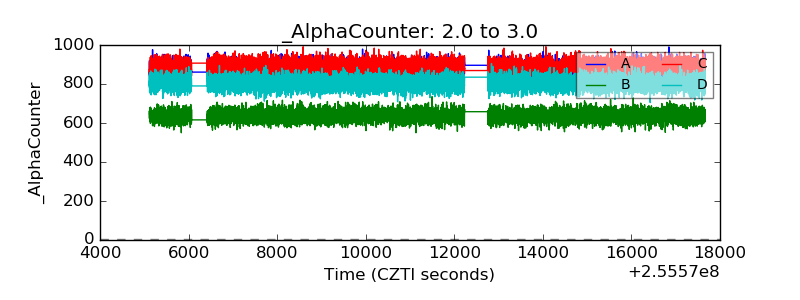 |
| _CPM_Rate | 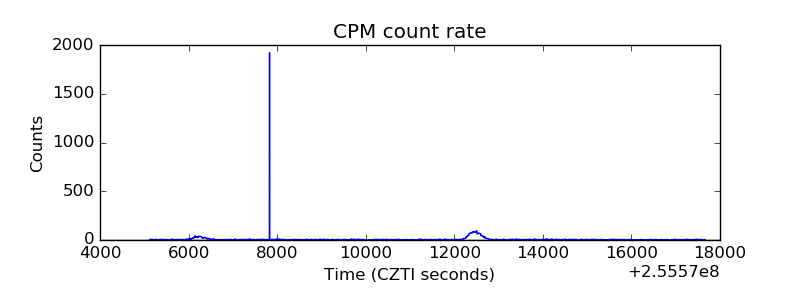 |
| CZT Counter | 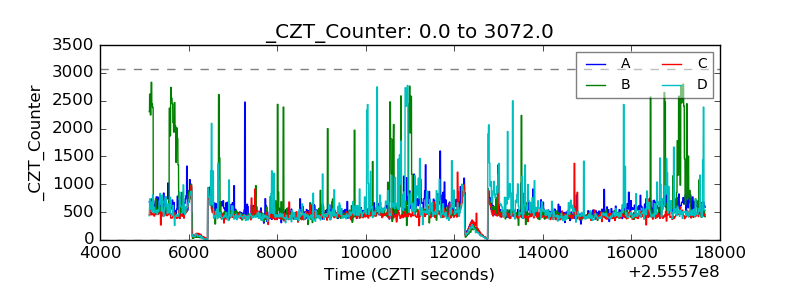 |
| +2.5 Volts monitor |  |
| +5 Volts monitor | 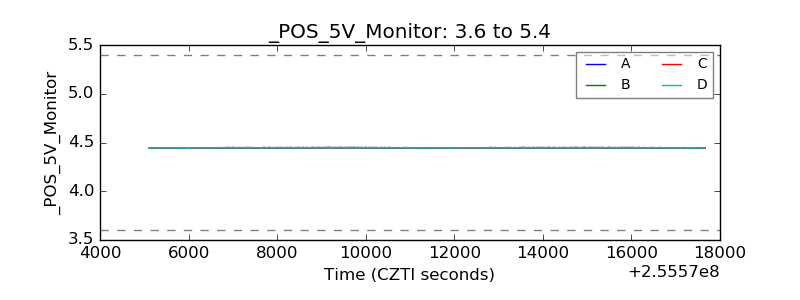 |
| _ROLL_ROT | 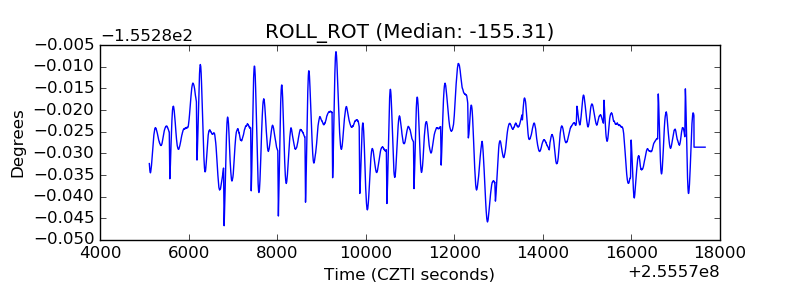 |
| _Roll_DEC | 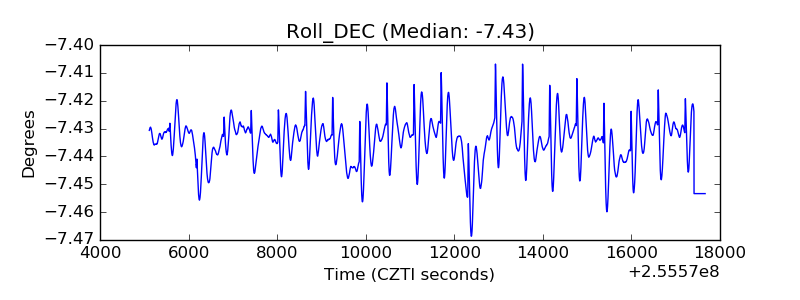 |
| _Roll_RA | 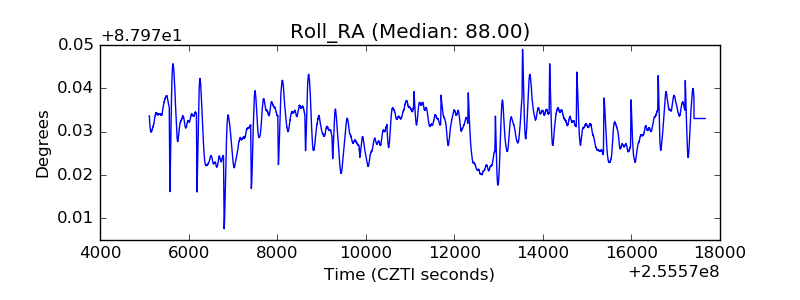 |
| Veto Counter | 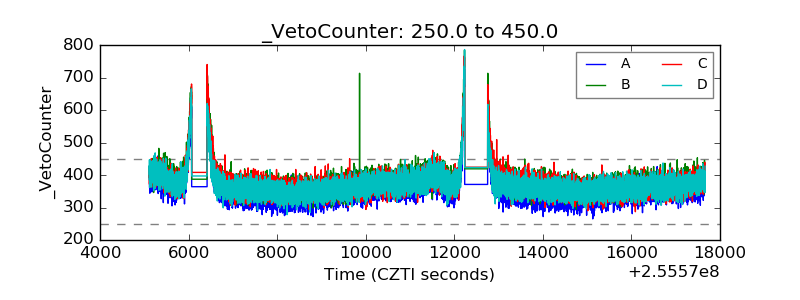 |